
 ?Mathematical formulae have been encoded as MathML and are displayed in this HTML version using MathJax in order to improve their display. Uncheck the box to turn MathJax off. This feature requires Javascript. Click on a formula to zoom.
ABSTRACT
Antarctic water tracks and ephemeral wetlands are a primary location for biogeochemical soil processes driving cold desert soil formation. Though the spatial extent of water tracks and wetted soils has been mapped in the McMurdo Dry Valleys (MDV) on the basis of mapping darkened pixels in high-resolution commercial satellite imagery, the timescale over which water tracks and wetlands form and the duration of these biogeochemically active environments remain unknown. Here, we determine the start date and end dates and the duration of wetted soils at ten sites located across the MDV using a combination of in situ soil sensors and two complementary remote imaging platforms (Planet and WorldView) to understand the hydroclimatic processes that drive water track and wetland formation. Our remote sensing employs a terrain correction workflow that removes the contribution of differential direct illumination and small-scale shadowing on pixel brightness, reducing false positives (soils identified as wetted when in fact they are shadowed or darkened as a consequence of high phase angle). Our findings extend the water track and wetland hydroperiod by over a month, showing darkening occurring from November to March, suggesting hydrological contributions from ground ice thaw, snowmelt, and salt deliquescence and soil brine growth.
Introduction
Recent observations of accelerating erosion and ground ice thaw in Antarctica’s coastal McMurdo Dry Valleys (MDV) suggest that shrinking permafrost extents, thickening active layers, and widespread thermokarst subsidence resulting from enhanced heat transport through recently wetted cold desert soils may be early indicators of imminent, continental-scale change in the topography, mineralogy, and the thermal state of the Antarctic terrestrial cryosphere (Levy et al. Citation2008; Levy, Fountain, Dickson et al. Citation2013; Fountain et al. Citation2014; Levy and Schmidt Citation2016; Sudman et al. Citation2017). Groundwater-mediated thawing of permafrost has been a defining characteristic of arctic landscapes over the past decades, where changes in drainage, thermokarst pond geometry, and active layer thermal properties have rapidly altered the distribution of soils, ice, and soil carbon (Jorgenson, Shur, and Pullman Citation2006; Gooseff, Basler et al. Citation2011; Arp et al. Citation2015; Kanevskiy et al. Citation2016; Strauss et al. Citation2016). As the Antarctic ice-free area grows (Lee et al. Citation2017), questions arise as to how hydrological and wetland processes will shape Antarctica’s contribution to global geological and hydrological processes in a world with dramatically less terrestrial ice cover.
Water tracks are the basic unit of the subsurface hydrological system that feeds polar and permafrost wetlands. Water tracks are narrow bands of high soil moisture that route water downslope through soils above the ice table, largely in the absence of overland flow (Hastings et al. Citation1989; McNamara, Kane, and Hinzman Citation1999). In water tracks, moisture moves primarily as shallow groundwater, flowing through the active layer (the seasonally thawed portion of the soil column) along linear depressions in the ice table (the top of the permafrost that remains ice-cemented during summer), although it can discharge at the surface as springs, seeps, or open ponds.
Wetlands associated with water tracks are ponded zones of soil moisture enhancement perched between the soil surface and the underlying ice table. Water track–fed wetlands may be present in low-slope portions of valley thalwegs, at breaks in slope along valley walls, or behind topographic barriers such as moraines. Accordingly, most MDV wetlands can be considered groundwater slope wetlands, based on Brinson’s (Citation1993) hydrogeomorphic classification, with lateral flow of snowmelt-derived groundwater responsible for most of the wetland moisture input and water loss primarily by evaporation from closed basins. In this article, we take an expansive definition of wetlands to include surficial soils with seasonally enhanced moisture content resulting from water track flow, ground ice melt, atmospheric vapor emplacement into brine droplets or unfrozen water droplets, etc., any process that increases soil moisture seasonally above the prevailing <1 weight percent soil moisture common across the MDV desert soils (Campbell and Claridge Citation1987).
Because they are soil landforms, water track discharge and wetland inundation state are notoriously difficult to measure; water tracks cannot be easily gauged like a stream (Gooseff et al. Citation2016), and wetland soil moisture conditions typically require multiple soil moisture sensors to determine reliably. However, their persistence in the same broad, linear ice table depressions, and ponding sites over interannual to century timescales in Antarctica (Levy et al. Citation2013; Langford, Gooseff, and Lampkin Citation2015) make them suitable for analysis by repeat remote sensing observations using a range of different sensing platforms.
Here, we use a combination of ground-based soil sensors and a combination of high spatial– and temporal–resolution commercial satellite data to determine the hydroperiod of water tracks and wetlands in the MDV. We used Planet imagery with high-frequency revisitation (subdaily to subweekly) and WorldView imagery with higher spatial resolution but less frequent repeat intervals (subweekly to monthly) and processed both data sets to correct for the effects of differential illumination and small-scale shadowing. From this processed image data, water track darkening could be confidently identified to determine the start and end of the water track hydroperiod. We then assessed possible origins of meltwater along water tracks by comparing the timing of these observations to high-frequency soil temperature measurements from several soil depths made in proximity to the water tracks. Together, these ground and satellite observations provide a regional view of how the hydroperiod of water tracks currently varies across the MDV, providing the first regional assessment of the annual duration of wetland processes in the Antarctic cold desert.
Background and motivation
In the MDV, Antarctica’s largest ice sheet–free area, plot- and reach-scale studies have shown that water tracks and water track–fed wetlands (1) decrease soil surface albedo, (2) increase soil thermal diffusivity and active layer thickness, (3) increase soil clay content and mineralogical diversity, (4) increase porewater salinity and silica saturation, and (5) increase soil organic matter (Lyons et al. Citation2005; Harris et al. Citation2007; Levy et al. Citation2011; Ball and Levy Citation2015; Linhardt, Levy, and Thomas Citation2019; George et al. Citation2021). As in many arctic and alpine regions, water tracks link snowmelt-fed soil watersheds to larger fluvial and lacustrine systems downstream (Gooseff et al. Citation2011, Citation2016; Schmidt and Levy Citation2017). Shallow groundwater in the form of water tracks and wetlands has been observed in the MDV for close to forty years (Cartwright and Harris Citation1982). However, efforts to determine its sources, duration, and extent (i.e., hydropattern) have only been recently explored (Langford, Gooseff, and Lampkin Citation2015) as part of a growing recognition that they are drivers of surface energy balance and soil processes (Linhardt, Levy, and Thomas Citation2019) and may be associated with deep, sub-permafrost brine systems (Mikucki et al. Citation2015).
Antarctic wetland systems have been described in the past as “insignificant” (Cartwright and Harris Citation1982); however, more recently, shallow groundwater processes have been shown to have global implications in terms of Antarctic and Southern Ocean geochemistry (as the headwater drainages of Antarctic streams, water tracks, and wetlands influence Fe and Si export to streams and coastal waters; e.g., Lyons et al. Citation2015; Olund et al. Citation2018) and the reconstruction of past ice sheet activity on the basis of terrestrial landscape records (because the thermal conductivity of MDV soils is strongly controlled by soil moisture [e.g., Levy and Schmidt Citation2016], the long-term stability of buried ice deposits such as the Ross Sea Drift or older buried ice-cored moraines is strongly dependent on changes to overlying soil moisture routing; e.g., Swanger and Marchant Citation2007; Gardner et al. Citation2022). As Antarctic ice-free area expands through the end of this century, water tracks and permafrost-affected wetlands are likely to be the dominant hydrological pathway modifying the up to 17,000 km2 of newly exposed rock and soil surfaces (Lee et al. Citation2017). The soil-derived flux of Fe, Si, and other key solutes to the Southern Ocean from streams and dust (Lyons et al. Citation2015; Wier Citation2018) equals or exceeds the flux of solutes from icebergs and ice-rafted debris (Rob et al. Citation2008). Because water tracks and permafrost wetlands are the primary sites of chemical weathering in the Antarctic cold desert (Campbell and Claridge Citation1987; Campbell et al. Citation1998; Toner and Sletten Citation2013), they directly mediate the formation and export of both solute-rich solutions and silt/clay-sized dust particles. The rates, spatial distribution, and magnitudes of all of these permafrost biogeochemical processes are controlled in the MDV by water track and wetland hydropattern.
Despite the demonstrated importance of water tracks in shaping permafrost and active layer biogeochemical processes, fundamental gaps exist in our understanding of where water track meltwater comes from, how water flows through and is stored in water tracks and seasonally wetted soils in Antarctica, over what timescale meltwater moves, and what the regional geochemical, thermal, and geobiological consequences of future increases in meltwater flow are. The hydropattern of MDV water tracks and wetlands is a fundamental parameter describing Antarctic wetland hydrology that remains unknown despite more than a decade of plot-scale inquiry into water track processes in the MDV. Here, hydropattern is used to expand the traditional concept of hydroperiod (i.e., the frequency and duration that a wetland is saturated) by incorporating additional information about the aerial extent and timing of wetting, stage/water level (including unsaturated water content for only partially wetted soils), and water budget/storage (Brinson Citation1993).
Most studies have focused on point and plot-scale investigations of water track and Antarctic wetland processes (e.g., Lyons et al. Citation2005; Harris et al. Citation2007); however, recently, regional- and valley-wide-scale remote sensing efforts have shown the efficacy of satellite observations for mapping Antarctic surface biogeochemical processes (Salvatore et al. Citation2014, Citation2020; Levy et al. Citation2020). Because most multispectral remote sensing platforms (e.g., Landsat) are at too coarse spatial resolution to directly detect water tracks, and because the MDV lack vascular plants that are sensitive to biota-related water indices like the Normalized Difference Water Index of Gao (Citation1996), Langford, Gooseff, and Lampkin (Citation2015) used WorldView commercial satellite observations to map areas inferred to be Antarctic wetlands and water tracks. Using observations with approximately monthly repeat intervals, they used a panchromatic pixel brightness (DN or digital number) supervised classification threshold that takes advantage of the strong darkening of MDV soils in at visible wavelengths in response to wetting by even small amounts of soil moisture (Levy et al. Citation2014). However, Langford, Gooseff, and Lampkin (Citation2015) did not account for surface darkening due to differential illumination (i.e., brighter appearing surfaces at low phase angle, darker appearing surfaces at high phase angle) or shadowing (e.g., from boulders, stream banks, or other obstacles), which could lead to misclassification of darkened pixels as wetted pixels.
Langford, Gooseff, and Lampkin (Citation2015) found that water track locations are highly repeatable from year to year, water tracks are spatially variable in their density, and water tracks commonly are associated with perennial snowbanks, suggesting a snowmelt source. In contrast, isotopic measurements of water track solution 18O and D have suggested that melting of ground ice plays a leading role in water track water budgets (Harris et al. Citation2007; Levy et al. Citation2011), consistent with deep active layer thaw depths beneath wetted soils (Levy and Schmidt Citation2016).
These conflicting observations from plot-scale and remote sensing–scale measurements motivate several key questions: are water tracks dominantly snowmelt fed or ground ice fed? Can darkening of MDV soils by water track and ephemeral wetland pore solutions be detected over daily to seasonal timescales through remote sensing, or do other pixel-darkening processes (e.g., topographic shading) dominate satellite remote sensing scenes? Is the timescale of wetting in water tracks and other Antarctic wetlands, the hydroperiod, short (lasting only a month or two during peak summer thaw) or long (persisting before and/or after ground temperatures reach 0°C during shoulder seasons)?
Methods
Field setting
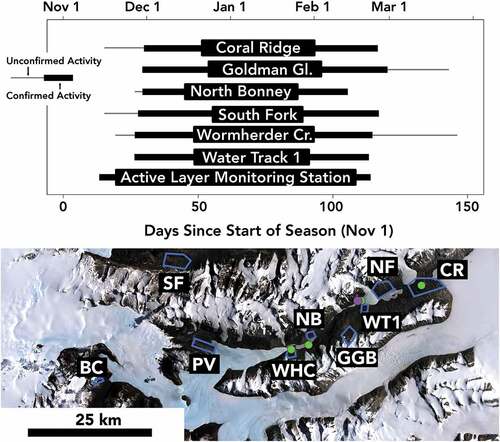
The study sites are located in Taylor, Wright, Barwick, Pearse, and Beacon Valleys in the MDV, Antarctica (77.68°S, 162.62°E; ). Study sites vary in elevation (20–1,511 m.a.s.l.), slope (1°–21°), azimuth (north- and south-facing), and distance from the Ross Sea (2–68 km). In order of increasing distance from the Ross Sea, the study sites are Coral Ridge (CR), North Fryxell (NF), Water Track 1 (WT1), Goldman Glacier Basin (GGB), North Bonney (NB), Wormherder Creek (WHC), Pearse Valley (PV), Vaskha Parallels (VP), South Fork (SF), and Beacon Cirque (BC). Of these sites, CR, WT1, GCB, WHC, SF, PV, and BC are north-facing (equator-facing), whereas NF, NB, and VP are south-facing (pole-facing).
Figure 1. Site map showing the location of water track study areas (AOIs), the spatial footprint of the AOIs (blue rectangles), the location of MCM-LTER meteorological stations used for ground temperature comparison (green dots), and the location of the active layer monitoring station used to determine water track hydroperiod at one site (purple dot). Base map is the Landsat Image Mosaic of Antarctica (Bindschadler et al. Citation2008). Inset shows the location of the McMurdo Dry Valley study area in the red box.
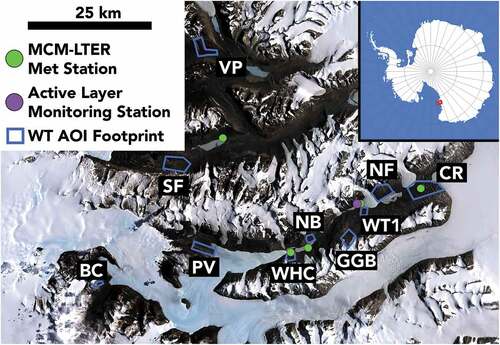
Satellite observations at these sites were compared to on-the-ground soil temperature data collected at three depths (surface, 5 cm, and 10 cm) from McMurdo Dry Valleys Long Term Ecological Research Project (MCM-LTER) meteorological stations at Explorer’s Cove, Lake Bonney, Lake Hoare, and Lake Vanda (Doran and Fountain Citation2019).
Remote sensing data and methods
Two imagery data sets were analyzed using a terrain correction workflow that removes the effects of differential illumination and small-scale shadowing to identify darkening in the scene associated with intrinsic changes to surface albedo. Both high temporal–/moderate spatial–resolution PlanetScope imagery and high spatial/low temporal–resolution WorldView data were used for this analysis and were processed as described below.
Multispectral visual three-band and four-band surface reflectance imagery from PlanetScope (~3 m per pixel; Planet Team Citation2017) was collected for the ten areas of interest (AOIs; ). These images were filtered for less than 40 percent cloud cover and at least 40 percent coverage of the AOI. The PlanetScope constellation of 180+ CubeSats in near-polar, sun-synchronous orbit has a revisit frequency of <24 hours, producing a large number of candidate images (348 across all sites after filtering). To constrain the annual duration of the MDV hydroperiod, Planet data were processed from the 2018–2019 austral summer season, the first full summer season for which Planet data were available at these sites.
Panchromatic WorldView-1, -2, and -3 imagery (~0.5 m per pixel) was tasked at a weekly acquisition interval over the whole MDV region. Radiometrically processed and georeferenced images were delivered by the Polar Geospatial Center. This data set was then manually filtered for cloud cover where necessary before image processing, described in the following paragraphs. Images collected during the austral summer (October to March) between 2010 and 2017 were used in this analysis. While tasking requested weekly to bimonthly imaging, satellite orbital configuration and cloud conditions result in image delivery at an approximately monthly cadence.
For the purposes of this study, water track and wetland activity are defined as either darkening of a soil surface outside of a lake, pond, or stream hyporheic zone or as instrumental detection of enhanced soil moisture above the winter water content background value for sensor-equipped sites. Accordingly, processing of remote sensing imagery focused on determining the intrinsic reflectivity of the imaged soil surfaces to identify linear or patchy zones of darkening associated with moist soil in water tracks.
A terrain correction workflow was used to account for topographic shading and illumination in each satellite imaging scene that builds from previous terrain correction methods developed by Li and Sheng (Citation2012), Stillman et al. (Citation2020), and Munaretto et al. (Citation2021). Because the PlanetScope and WorldView scenes include rough surfaces and shadows, the effects of differential illumination and small-scale shadowing need to be removed to confidently identify pixels that are dark in comparison to neighboring pixels with the same lithology but with different moisture contents.
A time-of-collection hillshade was generated for each WorldView or PlanetScope image using the solar azimuth and solar elevation calculated for the image acquisition date and time at each AOI’s centroid geographical coordinates. Topographic data for the illumination model were provided by the Fountain et al. (Citation2017) lidar grid for the MDV, which has a posting of 1 m/pixel. Time-of-collection hillshades were generated, which are eight-bit brightness images for which pixel value is is a function of phase angle. In the hillshade images, DN changes as the cosine of phase angle, from a maximum DN at 0° phase angle and a minimum DN at a phase angle of 180°. Pixels in the hillshade model that are fully shadowed by in-scene topographic obstacles have a DN of 0.
The next processing step was to compare time-of-collection hillshade DNs to imagery reflectivity values. Because surface darkening can occur across all bands in color imagery, multiband PlanetScope images were summed by pixel into a pseudo-panchromatic image (called a “summed RGB” layer) by combining the red, green, and blue bands (near-infrared was not included if present, because not all PlanetScope sensors collect near-infrared measurements). WorldView data only consisted of panchromatic imagery.
To correlate time-of-collection hillshade DNs with imagery DN values, training regions were established in each AOI in which co-incident reflectance imagery and hillshade pixel values could be extracted for comparison. Polygonal training regions were manually digitized by selecting portions of the image data set with uniform lithology, a wide range of surface slope azimuths producing variably illuminated surfaces, and no apparent wetting or snow. Most training data sites contained small hills, ridges, or rocky outcrops where illumination could be modeled by the hillshade over nearly all azimuths. Pixel values from the hillshade and panchromatic rasters were extracted from each cell in the training polygon regions and a linear model was fit between the two pixel value data sets. This linear model predicts panchromatic imagery DNs as a function of the underlying hillshade DN. Deviation from the linear model is due to differences in surface albedo that are not captured by the hillshade, such as intrinsic differences in albedo; for example, those caused by soil moisture.
The linear model from the training values was then used to correct the entire image by removing the contribution to image DNs that resulted purely from differential illumination of the rough surface. For each pixel of the Planet or WorldView image in the AOI, a predicted panchromatic DN was determined using the linear model relating image DN to time-of-collection hillshade DN:
where m is the slope of the best-fit line and b is the image DN value for hillshade values of 0 (in practice, the image brightness recorded from fully shadowed pixels; i.e., the upwelling surface radiance resulting from diffuse illumination of the scene). For each image pixel in the AOI, the predicted panchromatic DN was subtracted from the original panchromatic image DN to produce the terrain corrected image:
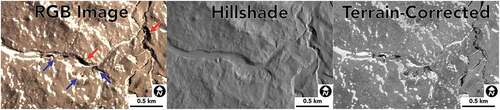
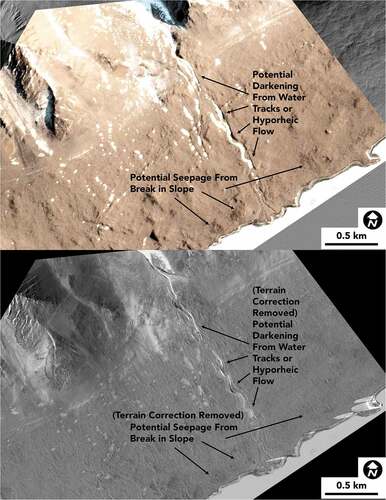
This process produces an image that has been visually “flattened” by removing the contribution to pixel brightness resulting from surface roughness and differential illumination of terrain (). It is equivalent to the DN values that would be produced in the image data set if the only illumination of the scene was the diffuse illumination occurring at the time of collection (see Supplementary Information).
Figure 2. Example of the terrain correction process at the Coral Ridge site. The color image (RGB image, left) contains both wetted soils (blue arrows) and shadowed dark pixels (red arrows). Using the time-of-collection hillshade (center panel), it is possible to remove the contribution to surface reflectance from illumination falling on rough surfaces and darkening caused by shadows to produce a “flattened” terrain-corrected image (right), where dark pixels are dominantly caused by wetting of soils. Bright pixels may be snow and/or bright surface materials such as salt.
The final terrain correction step is to normalize each terrain-corrected DN value to a standard so that surface brightness across the AOI can be compared between images collected at different times to identify darkening pixels. Here, we normalized each terrain-corrected DN value to the brightest pixel in the AOI to produce a terrain-corrected ratio value:
In practice, the brightest pixel in the scene is either snow (which is persistent in sublimating snowbanks across the MDV) or a hut roof (e.g., the New Harbor hut near the Coral Ridge AOI). The brightest pixels are consistent across images but may be different between AOIs. Accordingly, brightness of the surfaces is not compared between AOIs.
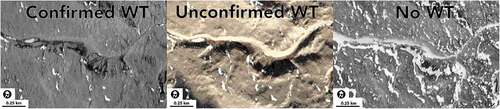
Water track and wetland activity was identified in terrain-corrected ratio images by manually inspecting each image for the presence of narrow, linear dark stretches of soil oriented downslope. Terrain-corrected images with water tracks present were classified as “confirmed WT.” Imagery for which terrain correction was not possible (e.g., because of the presence of large, exogenous shadows; low cloud/fog; or high pixel noise) but where water tracks appear present in the same locations and morphologies as in terrain-corrected images were classified as “unconfirmed WT.” If terrain-corrected or non-terrain-corrected imagery lacked indications of dark water track pixels, they were classified “no WT” ().
Figure 3. Example of classification of water track or wetland activity. At left, in the terrain-corrected image, dark linear features are interpreted as water tracks. In the center panel, darkened pixels may be water tracks and/or ponded soil moisture wetlands; however, because the image could not be terrain corrected, it is considered “unconfirmed.” At right, no water tracks are present in the terrain-corrected image.
To evaluate the possible origins of any meltwater present in water tracks and wetlands, the onset of water track activity was compared to MCM-LTER soil temperature measurements on the ground from the nearest meteorological station for each AOI (). For stations with data gaps, missing values were interpolated through a linear fit between the two data points surrounding the gap.
To more easily compare the timing of water track activity between sites, water track start and end dates are reported as days since 1 November. This date was selected because it is the earliest observation date in the 2018–2019 Planet imaging record and also because it provides a temporal margin prior to previously reported start dates for water track thaw (e.g., in December, based on observations in Levy et al. [Citation2011] and Langford, Gooseff, and Lampkin [Citation2015]). Water track hydroperiod was calculated as the difference between water track start date (first observed surface darkening) and water track end date (last observed darkening). Note that this will tend to underestimate water track hydroperiod for sites that are not bracketed by early or late season images that lack evidence of water track darkening. Water track initiation and duration were also compared to the cumulative number of thawing degree days (TDD) elapsed from 1 November to the start of water activity, as computed using the MCM-LTER weather station 15-minute observations. Both the start dates for confirmed and unconfirmed WT activity were compared to the cumulative TDD value to examine how much time above freezing had elapsed at each soil depth prior to the onset of water track activity.
Field methods
Two sets of field-collected data sets were used in this analysis: long-term soil temperature data collected at 0, 5, and 10 cm depths from MCM-LTER autonomous weather stations (AWSs; Doran et al. Citation2002) and a water track temperature and soil moisture active layer monitoring station (Levy Citation2015).
MCM-LTER AWS soil temperature measurements are collected at 15-minute intervals using Campbell 107 thermistors. Stations used in this study are located at Explorer’s Cove, Lake Hoare, Lake Bonney, and Lake Vanda. All MCM-LTER data can be downloaded directly from mcmlter.org. To help determine the source of moisture darkening water tracks, MCM-LTER soil temperature measurements are used to infer ground temperature at the remotely sensed water track study sites. By plotting the time of image collection alongside ground temperature at the nearest station to the study site (for PlanetScope observations) and by plotting the multi-annual range of ground temperatures alongside the aggregated WorldView observations, we can determine whether darkening occurs when surface (0 cm depth) temperatures reach 0°C (implying surficial sources of moisture like snowmelt) or whether darkening occurs when subsurface temperatures (at 5 or 10 cm depth) reach the thaw point. These stations are the nearest available ground-based temperature observation points and are typically <5 km from the AOI (only Goldman Glacier Basin is >5 km from the temperature measurement point at Lake Hoare; ).
Soil temperature and soil volumetric water content (VWC) measurements were collected at the water track active layer monitoring station to provide a high-cadence (hourly) measurement of water track activity, albeit at one spatial location. This can serve as a check on the remote sensing observations of surface darkening; if there is temporal overlap between soil moisture increases at the active layer monitoring site and pixel darkening at nearby water track sites observed with remote sensing data, then it increases the likelihood that darkening is being driven by albedo change associated with soil moisture increases. The water track station was installed at −77.624°N, 162.887°E and collected data each hour from December 2009 to September 2014. The water track station consists of two strings of temperature (Campbell 107 thermistors) and soil moisture (Campbell CS 616 time-domain reflectometry) probes, one located within the wetted boundaries of a water track and the other located in adjacent, off-track dry soil. Sensors are located at −10, −20, −30, and −40 cm depth.
Uncertainty for the CS 107 temperature probes is typically less than ±0.5°C over the measurement range. CS 616 TDR probes convert electromagnetic pulse travel time to VWC using a stock calibration for sandy soils, which produces uncertainty of ±2.5 percent. Note that water track soils are typically saltier than 0.5 dS/m and are denser than the optimum CS-616 bulk density (1.8 g/cm3 vs. 1.55 g/cm3), which may increase uncertainty in VWC measurements.
To determine whether the water track was active or not for comparison with remotely sensed albedo measurements, the water track active layer monitoring station data were processed as follows (scripts available at https://github.com/jslevy/wt_hydroperiod). Mean VWC and VWC variability (standard deviation) for the months of March and October were determined for each year to serve as a baseline for water track inactivity, because no water tracks have been detected during these months by previous studies (Levy et al. Citation2011; Langford, Gooseff, and Lampkin Citation2015). The initiation of water track activity was then defined as the measurement time at which the recorded VWC is greater than five standard deviations above the October baseline at the start of the thaw season. Likewise, the end of station-recorded water track activity was defined as the measurement time at which VWC falls below five standard deviations of the March mean VWC at the end of the thaw season.
Results
Here we report water track activity, defined either as surface darkening determined from remote sensing or as a measured increase in soil moisture at the active layer monitoring station across three spatiotemporal scales: a single point at the active layer monitoring station, Planet multiband observations from 2018 to 2019, and WorldView panchromatic images from 2010 to 2017. In total, 348 Planet images were analyzed for the 2018–2019 study period, with 179 images successfully terrain corrected, and 219 WorldView images were analyzed across the entire 2010–2017 study period, with 118 successfully terrain corrected.
Active layer monitoring station observations
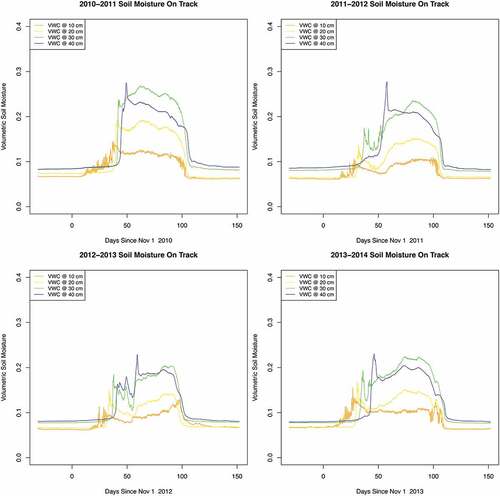
Across all years at the water track active layer monitoring station, mean October volumetric water content was 0.064 ± 0.0004 and mean March volumetric water content was 0.065 ± 0.0005 (). Both values were recorded in frozen soil (T < 0°C). The spring wetted period at the station began on average 14 ± 8 days after 1 November (range = 4 to 24 days), or approximately 14 November (). The mean end of the wetted period at the station occurred 113 ± 3 days after 1 November (range = 110 to 117 days), or approximately 22 February. The initial rise in soil moisture at 10 cm depth recorded at the station occurred at subzero temperatures in all years, with average temperature at the time of activation ranging from −1.2°C to −8.8°C (mean = −3.7°C). Likewise, the end of water track activity at the station and the beginning of the March inactive period occurred at soil temperatures ranging from −3.0°C to −8.0°C (mean = −4.9°C).
Table 1. Summary of water track temperature and soil moisture measurements at the water track active layer monitoring station.
Figure 4. Soil moisture measurements at the water track active layer monitoring station. Volumetric water content (VWC) is low and uniform in October but begins to rise at the near-surface (10 cm depth) sensor shortly after 1 November. In each measurement year, soil moisture increases in the water track from the surface downwards as thawing and flow begin, reaching saturated values at 30 to 40 cm depth. Freezing occurs more than 100 days after the start of thaw and at temperatures below 0°C.
Planet observations
The terrain-corrected images show evidence for water track activity at six of the ten study site AOIs. Water tracks have an average confirmed start date of 29 November but may become active (unconfirmed) as early as 16 November. Water tracks cease showing signs of surface darkening on average on 22 February but may remain active (unconfirmed) through 27 March. This produces an average confirmed water track hydroperiod across all sites of 86 days (confirmed observations), with a potential unconfirmed hydroperiod of up to 128 days (including unconfirmed observations; ).
Figure 5. Summary of water track darkening activity determined using Planet image data. Water track–related darkening could be detected in terrain-corrected images at six of the ten study sites. Unconfirmed activity (images for which terrain correction was not fully successful) extend the hydroperiod from late November to mid-December and from late February to mid-March, suggesting the persistence of soil moisture at the surface of water tracks for up to 127.6 days. Map from (bottom) provided for spatial context.
Darkening associated with water tracks was expected at the remaining four sites based on prior mapping by Langford, Gooseff, and Lampkin (Citation2015) and Levy et al. (Citation2020). However, the presence of darkening in terrain-corrected images could not be confirmed at any point between 1 November and 28 February using the 2018–2019 PlanetScope data. Shadowing in surface channels and troughs was identified in these images and removed by the terrain correction method ().
Figure 6. Terrain correction at the North Fryxell (Huey Creek) site. Although surface darkening from water tracks, hyporheic flow, or seepage along breaks in slope near the lake surface are suggested in color imagery, terrain correction reveals that all of this darkening results from shadowing and differential illumination. Although stream flow does occur at this site seasonally (Runkel, McKnight, and Andrews Citation1998), no water track–related surface darkening was identified at this site in 2018–2019. All apparent darkening is due to roughness and shadowing. Imagery © Planet 2019. All rights reserved.
Next, we describe water track hydroperiod activity at each site in detail and in relation to subsurface temperature conditions at the nearest MCM-LTER weather station.
Coral Ridge
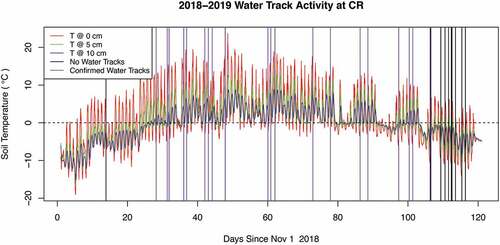
The Coral Ridge site is the lowest elevation and closest site to the Ross Sea and sits on ice-cored Ross Sea Drift sediments. Confirmed water track activity in the terrain-corrected images appears on 30 November, with unconfirmed darkening taking place on 27 November. The confirmed water track darkening date aligns with the onset of temperatures above 0°C at 10 cm below the surface, and the unconfirmed start date occurs shortly before the onset of 0°C temperatures at 5 cm below the surface (). Additionally, water tracks appeared at CR after 57 TDD at the surface and after only 1.5 TDD at 10 cm below the surface. Water track darkening occurred at CR several days after temperatures reached 0°C at the surface.
Figure 7. Water track activity at Coral Ridge determined via Planet image analysis. Vertical lines mark the time of Planet image collection. Vertical purple lines indicate confirmed water track observations in that particular image. Black vertical lines indicate no water tracks observed in that image. Confirmed water track activity begins as temperatures at 10 cm depth cross 0°C. Temperature data are from the nearby Explorer’s Cove MCM-LTER soil temperature station.
Water Track 1
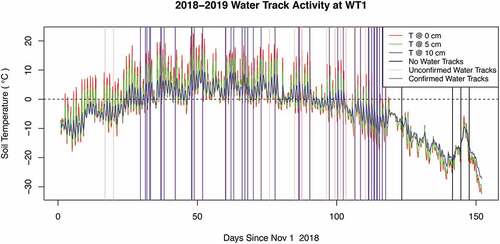
WT1 is located in central Taylor Valley and is a site with ~200 m of relief from the uppermost reaches of the water track to Lake Hoare at the bottom. Confirmed water track activity begins on 29 November, with unconfirmed water track occurrences as early as 16 November. The first confirmed occurrence of water track soil wetting at WT1 took place after approximately one week of thawing 10 cm below the surface (). The unconfirmed start date for water track activity at WT1 occurred after ~3.5 TDD at soils 5 cm below the surface. Darkening did not appear on the surface at WT1 until well after subsurface soils reached above 0°C. (Note that the Lake Hoare meteorology station is the closest AWS to the WT1 site and is ~100 m lower than the highest reach of WT1).
Figure 8. Water track activity at Water Track 1 determined via Planet image analysis. Vertical lines mark the time of Planet image collection. Vertical purple lines indicate confirmed water track observations in that particular image. Pink vertical lines indicate unconfirmed water track detections in that image. Black vertical lines indicate no water tracks observed in that image. Confirmed water track darkening postdates thaw at 0 and 10 cm depth by several days, whereas unconfirmed water track activity precedes subsurface thaw. Temperature data are from the nearby Lake Hoare MCM-LTER soil temperature station.
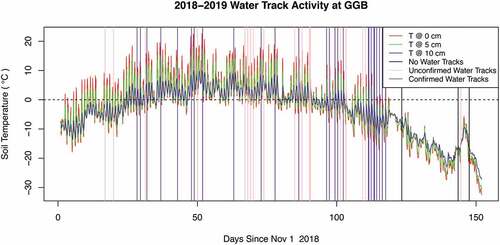
Goldman Glacier Basin
Goldman Glacier Basin is a mid-valley, north-facing valley wall site and is significantly higher in elevation than the previous two sites (~700 m vs. <200 m) and the second highest elevation site overall. Confirmed darkening occurred on 1 December 2018. However, the unprocessed three- and four-band images show unconfirmed water track darkening as early as 16 November. When plotted against the nearby soil temperature values from the MCM-LTER Lake Hoare meteorological station (), confirmed soil darkening took place ~10 days after soils 10 cm below the surface reached 0°C. The earliest date for unconfirmed darkening activity occurred after ~3.5 TDD at 5 cm below the surface. The confirmed and unconfirmed starts of water track activity align with subsurface soils reaching the thawing threshold and postdate surface temperatures reaching 0°C.
Figure 9. Water track activity at Goldman Glacier Basin determined via Planet image analysis. Vertical lines mark the time of Planet image collection. Vertical purple lines indicate confirmed water track observations in that particular image. Pink vertical lines indicate unconfirmed water track detections in that image. Black vertical lines indicate no water tracks observed in that image. Confirmed water track darkening occurs latest at this site of all analyzed sites. Unconfirmed water track darkening occurs in mid-November and persists into March. Temperature data are from the nearby Lake Hoare MCM-LTER soil temperature station.
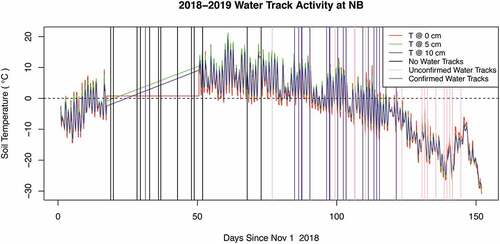
North Bonney
North Bonney is a south-facing site ~28 km inland from the Ross Sea coast on the north flank of the Lake Bonney basin. Confirmed water track darkening at NB occurred on 28 November 2018. Water tracks are not present in imagery prior to the confirmed start date. After this initial observation, water tracks are not visible again until 15 January (unconfirmed) and 23 January (confirmed). This gap in observations suggests possible rewetting of water track pathways during a single season. Water tracks become visible in the NB imagery shortly after soil temperatures reach the thawing threshold at all depths on the valley floor where the Lake Bonney met station is located ().
Figure 10. Water track activity at North Bonney determined via Planet image analysis. Vertical lines mark the time of Planet image collection. Vertical purple lines indicate confirmed water track observations in that particular image. Pink vertical lines indicate unconfirmed water track detections in that image. Black vertical lines indicate no water tracks observed in that image. Note that data are not available from the Lake Bonney MCM-LTER AWS station for part of 2018–2019. Confirmed darkening at North Bonney is not observed until much later in the season than at other water track sites. Temperature data are from the nearby Lake Bonney MCM-LTER soil temperature station.
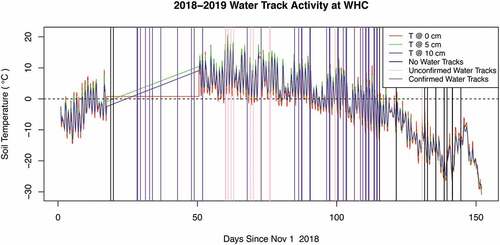
Wormherder Creek
WHC is a north-facing site within the West Lobe Lake Bonney basin, with ~500 m relief from the glacier-covered valley rim to the lake shore where the water track discharges. Confirmed water track darkening at WHC begins on 27 November (). Limited imaging of the site from 19 to 27 November precludes earlier observations of potential activity in the unprocessed images. Soil temperatures between 17 November 2018 and 20 December 2018 were interpolated using a linear fit between the two endpoints of the data gap. Like the previous north-facing sites, the timing of the onset of confirmed darkening activity corresponds to subsurface (5 and 10 cm depth) soil temperatures reaching the thawing threshold. The earliest confirmed darkening occurrence takes place after about a week of thawing temperatures in soils at 10 cm depth.
Figure 11. Water track activity at Wormherder Creek determined via Planet image analysis. Vertical lines mark the time of Planet image collection. Vertical purple lines indicate confirmed water track observations in that particular image. Pink vertical lines indicate unconfirmed water track detections in that image. Black vertical lines indicate no water tracks observed in that image. Subsurface temperatures were interpolated across the 2018–2019 data gap but are broadly consistent with confirmed water track darkening occurring as subsurface temperatures approach thawing temperatures. Temperature data are from the nearby Lake Bonney MCM-LTER soil temperature station.
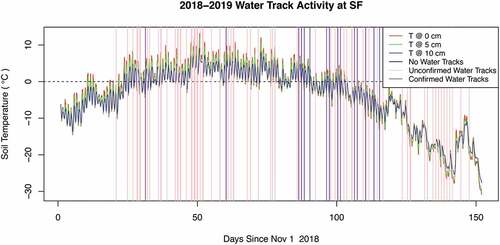
South Fork
South Fork is a north-facing site in western Wright Valley with ~1 km relief from the valley rim to the valley thalweg into which the water track flows. Dark patches of soil are present in the SF imagery on the first available image date (20 November 2018), so confirmed water track darkening was identified here as the first date when these patches were connected into linear features on 17 November (). When compared to soil temperature data from the Lake Vanda met station, confirmed darkening activity occurred after ~16 TDD at the surface and after ~6 TDD in soils at 10 cm depth. Confirmed wetted soils are visible along the valley floors of SF well before most other sites, though confirmed water tracks do not appear until the 27 November, comparable to the range of dates for other north-facing sites.
Figure 12. Water track activity at South Fork determined via Planet image analysis. Vertical lines mark the time of Planet image collection. Vertical purple lines indicate confirmed water track observations in that particular image. Pink vertical lines indicate unconfirmed water track detections in that image. Black vertical lines indicate no water tracks observed in that image. Unconfirmed water track darkening is present in the first image available in spring of 2018, but confirmed images are logged only when the darkened features merge into a linear feature at this site. Temperature data are from the nearby Lake Vanda MCM-LTER soil temperature station.
Pearse Valley Beacon Cirque, Vashka Parallels, and North Fryxell
Water track activity could not be identified at any of the four remaining sites for the 2018–2019 summer season, despite the inferred presence of water tracks at these sites based on past studies (e.g., Heldmann et al. [2012] for Pearse Valley, Levy et al. [Citation2020] for Beacon Cirque, and Langford, Gooseff, and Lampkin [Citation2015] for Vashka Parallels and North Fryxell). The soils at PV showed no albedo change for the duration of the season, and the imagery for the BC site was unsuitable for processing due to cloud coverage and late season snowfall. The NF and VP sites did not exhibit water track activity for the duration of the season, although imagery did show linear stretches of dark pixels along stream channels, consistent with overland flow and stream hyporheic zone formation (McKnight et al. Citation1999). Although wetted soils were identified at these sites by Langford, Gooseff, and Lampkin (Citation2015), the image processing method used here showed that many of these surface darkening features are the result of shadows cast into stream channels ().
WorldView hydroperiod observations
Water track–related soil darkening is detectable in terrain-corrected WorldView images; however, it is not always possible to determine a hydroperiod for water tracks at each study site, because some sites have only one terrain-corrected WorldView observation per year. Where multiple observations are available in a given year, WorldView-derived confirmed and unconfirmed hydroperiod initiation/cessation dates are bracketed by PlanetScope observations of the site. Across all water track sites, darkening initiates on average 47.5 days after 1 November (for confirmed water track darkening) or 53.9 days after 1 November (for unconfirmed water track darkening. Note that, in this case, the unconfirmed start date average is later than the confirmed start date average because it includes one site, for Coral Ridge, for which a confirmed start date was not present but for which a late-season unconfirmed start date was. See Supplementary Table 1.
WorldView observations across all sites produce an average end of the water track wetted period 84.6 days from 1 November (for confirmed observations) or 80.3 days (for unconfirmed water track darkening; note that, in this case, the unconfirmed end date average is smaller than the confirmed end date average because it includes Coral Ridge, for which confirmed end dates were not always available). Together, WorldView observations across CR, GGB, NB, NF, WHC, and WT1 point to a hydroperiod that is a subset of the hydroperiod detected in PlanetScope data. The onset of water track darkening detected in WorldView data occurs over a range of dates from November to January, depending on observation year. Water track activity ceases in WorldView data between January and February (confirmed), although it should be noted that terrain-corrected March images are not available in every year. This produces an average WorldView-derived hydroperiod of 43 days and can reach up to 85 days if unconfirmed images are included.
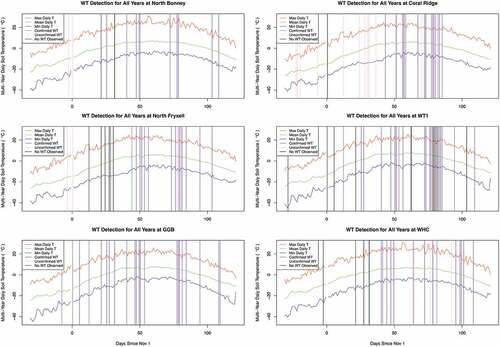
Because terrain-corrected WorldView images are few in number compared to terrain-corrected Planet images, we present the WorldView hydroperiod climatology estimates as aggregates over all years (), plotting all WorldView observations by day of season, regardless of year. Across all years and most of the sites, confirmed observations of water track darkening typically postdate the onset of thaw (T > 0°C) at the surface by several days and up to approximately one week. Sites further from the coast or south-facing sites (e.g., North Bonney, North Fryxell, and Wormherder Creek) commonly show delayed onset of water track darkening compared to north-facing and coastal sites. GGB shows confirmed water track darkening more than twenty-five days before surface soils at the Lake Hoare meteorological station reach 0°C.
Figure 13. Summary of water track activity across all sites and all years (2010–2017) for all available WorldView images, plotted against maximum, minimum, and mean surface temperature at the nearest MCM-LTER meteorological station to the study site. Vertical lines mark the time of WorldView image collection. Vertical purple lines indicate confirmed water track observations in that particular image. Pink vertical lines indicate unconfirmed water track detections in that image. Black vertical lines indicate no water tracks observed in that image. Across all years and most sites, confirmed and unconfirmed observations of water track darkening typically slightly precede the onset of thaw (T > 0°C) at the surface. Sites further from the coast or south-facing sites (e.g., North Bonney, North Fryxell, and Wormherder Creek) commonly show delayed onset of water track darkening. Black lines (WT not detected) could be due to cloud cover in the image, poor lighting geometry, or lack of the presence of water tracks.
Discussion
This combined remote sensing and ground-based sensor study sheds new light on water track hydroperiod, challenging prior analyses that deduced that water track and wetland activity occurred primarily in December and January and that water tracks are largely fed by surface snowmelt (e.g., Langford, Gooseff, and Lampkin Citation2015). Instead, we found that both ground-based and satellite observations show evidence that water track and wetland darkening in MDV soils occurs in many sites in mid- to late November and persists at least through February (with darkened soils persisting at some sites through March; e.g., GGB). It is important to note that in this pilot study using the first year of Planet imagery available for the MDV, only some sites (e.g., Wormherder Creek) are bookended by observations showing no darkening at the area of interest. For those sites, uncertainty in the start/end of darkening in the AOI is the number of days between the first/last image with detected darkening and the first/last image with no detected darkening (e.g., Cooley and Pavelsky Citation2016); at WHC, this uncertainty is approximately eight days at the start of the season and approximately one day at the end of the season. Sites that have confirmed or unconfirmed water track darkening as their first observation may have undetected prior instances of earlier darkening; sites with darkening observations as their last observation may have undetected subsequent instances of darkening. At these sites, the earliest possible darkening date and the latest possible darkening date cannot be determined. As additional high-cadence Planet image data become available for the MDV, it will become possible to place more certain uncertainty bounds on the duration of soil wetting at these sites as well as to determine interannual variability in water track hydroperiods.
In addition to a greatly extended wetted season for soils at these sites, we found that soil surface temperatures at or exceeding 0°C are not necessary for water track and wetland soil darkening to occur, suggesting that surface snowmelt is not the only hydrological process driving water track and wetland darkening. Indeed, most sites where water track darkening is observed in PlanetScope imagery show darkening well after the surface 0°C isotherm is reached (e.g., CR), whereas others show confirmed water track darkening well before the surface 0°C isotherm is reached, suggesting that temperatures at or exceeding 0°C are not sufficient for water track and wetland darkening and may not even be necessary.
Evaluation of terrain correction
How effective is the terrain correction method for identifying darkened soils associated with seasonal hydrological activity in Antarctic wetlands and water tracks? The terrain correction method described here is a modified cosine correction, which leverages the high-resolution lidar elevation data available in the MDV (Fountain et al. Citation2017) to both adjust imaging pixel brightness for orientation and slope relative to the solar incidence angle and elevation and determine which regions of the scene are shadowed by small, in-view obstacles like boulders, steep stream banks, etc. This is especially important because water tracks flow through broad surface depressions, such as abandoned stream channels, and because MDV groundwater commonly pools or discharges as springs and seeps at breaks in slope. At most of the study AOIs, the terrain-corrected imagery clearly identified the presence of darkened pixels that were absent in early and late-season images and that were elongated, digitated, linear-branching features consistent with water tracks and other MDV wetlands (). Through validation using lab studies, Salvatore et al. (Citation2021) estimated the detection threshold and uncertainties in VWC estimations to be roughly ±3 percent (Salvatore et al. Citation2021).
Figure 14. Water tracks at their full spatial extent and maximum darkening. Water track and wetland soils are dark, digitated, and oriented in broad depressions. All images are terrain-corrected PlanetScope images overlaying time of collection hillshades. Imagery © Planet 2019. All rights reserved.
The terrain correction method was able to remove the effects of variable illumination and surface roughness at the study sites, producing visually “flattened” images and allowing water track and wetland activity to be distinguished from darkening associated with shadowing and terrain roughness. Large shadows cast by nearby peaks were partially but incompletely removed because shadowing due to large-scale surface features like mountain peaks is independent of the azimuth of the shadowed surface. However, the terrain correction method was successful in eliminating the effects of differential illumination on rough surfaces and small-scale shadowing so that linear dark features in the resultant rasters could be interpreted as surface darkening within water tracks, rather than shadows.
Terrain-corrected WorldView and PlanetScope images were also useful for confirming the absence of wetted soil at a site. In many locations—for example, North Fryxell or Vashka Parallels—water tracks and other wetted soils had been reported by Langford, Gooseff, and Lampkin (Citation2015). During the 2018–2019 PlanetScope imaging campaign, these sites were heavily shadowed, and no darkened soils could be observed outside of stream channels at these sites, suggesting that in steeply sloped regions, terrain correction is an essential tool for removing shadows so that the spatial extent of darkened, moist soil is not overestimated.
Beyond shadowing, what uncertainty exists in identifying wetted soil on the basis of albedo change using the terrain-corrected imagery? Several factors control image brightness in terrain-corrected images, of which soil moisture is only one. Lithologic variability should also be considered as a factor that can alter surface albedo and lead to possible misinterpretations of the landscape. Differences in local bedrock can create color contrasts in the MDV surface where there are exposed outcrops or where sediment varies in origin. Although the MDV feature some lithologic variability, from sediments, to metasediments, to primary igneous intrusive and eruptive rock types (Cox and the GeoMAP Action Group, 2019), most study sites observed here are spatially constrained enough to consist of only one soil type (e.g., Ross Sea Drift), so brightness variability attributed to sediment composition is negligible within each study AOI. Likewise, soil lithology is likely to be consistent over time across images of a single site and would not change inhomogeneously in response to temperature, relative humidity, or other environmental factors. Finally, water tracks can cross lithological or soil boundaries, allowing the digitate and elongate shape of water tracks to provide morphological characteristics that can distinguish them from soil or rock type boundaries (). Future efforts to quantify soil moisture using surface albedo and to compare soil moisture between sites would require use of a baseline albedo product to determine relative darkening between sites.
Comparison between remote sensing and in situ measurements
How do remotely sensed measurements of soil darkening compare to on-the-ground measurements of water track soil moisture at the active layer monitoring station? The water track active layer monitoring station hydroperiod is broadly consistent with PlanetScope imaging data from central Taylor Valley (e.g., WT1 and GGB). Thaw at the active layer monitoring station begins slightly earlier (averaging 14 ± 8 days after 1 November versus 30 days at GGB (15 days, unconfirmed) and 28 days after 1 November at WT1 (15 days, unconfirmed). Likewise, wetting at the station ceases slightly earlier than at nearby remote sensing AOIs, ending 113 ± 3 days after 1 November versus 116 days after 1 November at GGB and 116 days after 1 November at WT1. This pattern of both earlier and later wetting at the active layer monitoring station than is detected in the remotely sensed data is fully consistent with the lack of images showing no activity at the WT1 and GGB sites at the start of the observing season—there is likely wetting and darkening at these sites that is not captured, even in these rapid-cadence remote sensing images. Still, although there is some year-to-year variability in start and end dates of wetting at the active layer monitoring station (), the ground-based measurements reliably extend the wetted season for water track soils in central Taylor Valley from November until at least mid-February.
Active layer monitoring station measurements of wetting largely overlap remotely sensed detections of surface darkening (), with moisture increases beginning in late November and persisting through at least late February. Ground observations are different from remotely sensed measurements of soil darkening for several reasons but still suggest broadly similar patterns of soil seasonal hydrological activity across the study area. First, the active layer monitoring station is located along the valley floor, 75 and 550 m lower than WT1 and GGB, respectively, where temperatures are typically warmer than at high elevations (Doran et al. Citation2002; Fountain et al. Citation2014; note that the station is at approximately the same elevation as the Lake Hoare meteorological station, which was used for soil temperature comparison for WT1 and GGB). Active layer monitoring station measurements are also limited to a soil volume located ~10 cm beneath the surface compared to remote sensing observations, which only are sensitive to albedo change at the very soil surface. This means that the station is unlikely to record ephemeral or thaw-season-starting snowmelt, because small amounts of melt take time to infiltrate into the subsurface. This suggests that the initial increase in soil moisture recorded by the active layer monitoring station has a source that is not surface snowmelt, consistent with the subfreezing temperatures recorded at the station during the onset of spring thaw. We interpret the monotonic increase of soil moisture starting at or near thaw initiation time () as evidence of the thaw of ice in pore spaces in the soil at temperatures below 0°C, suggesting a role for freezing depression in saline soils (Campbell et al. Citation1998; Toner, Sletten, and Prentice Citation2013).
Water track and wetland processes and water sources
Based on the remote sensing and active layer monitoring station observations, what soil processes might be at work causing darkening in water tracks and wetland soils, and how does this change our understanding of the seasonal hydrology of the MDV? Across sites, water sources clearly vary. At GGB and WHC, glacier melt contributes to wetted soils across the basin (), whereas snow is present in many water track watersheds and ground ice clearly contributes to water track growth and expansion at other sites (e.g., ). In glacier-fed sites, water track darkening commonly initiates upslope, near the start of the water track flowpath ( and Supplementary Material).
Figure 15. Water track and wetland soil within the Goldman Glacier Basin site. WorldView images show darkening in the right side of the image early in the season (by 4 November), followed by growth of glacier runoff on the left side of the image later in the month. Water track darkening persists and grows, even as glacier melt and runoff shuts down on 26 November 2010 as snow blankets the glaciated region of the image. Images © 2010 Maxar.
Figure 16. Water track and wetland evolution at the Coral Ridge AOI. PlanetScope images show the evolution of the site from no water tracks (13 November 2018) through water track growth and expansion. Snow is largely absent from water track alcoves by 6 December, yet water tracks continue to expand, suggesting that ground ice at this site contributes meltwater to water track and wetland soils. Imagery © Planet 2019. All rights reserved.
Water track and wetland darkening appears notably insensitive to surface thaw temperatures. At many sites—for example, CR, WT1, and WHC—active darkening occurs after surface temperatures reach 0°C at the nearest AWS station, suggesting that melt of surface snow is not a necessary, or sufficient, driver of all water track and wetland activity. Ground ice thaw, indicated by subsurface (5 or 10 cm depth) temperatures reaching 0°C, particularly the thaw of pore ice and excess ice locked in the shallow subsurface of the water track soil profile from the prior year’s flow season (e.g., Levy et al. Citation2011) may be the main driver of water track darkening at these sites. For example, soil darkening at WT1 appears first in the ponded central reach of the water track, before expanding both up- and downslope, suggesting simultaneous seasonal wetting of soil, rather than propagation of melt from an upslope watershed (, Supplementary Material). Such subsurface pore ice represents a multiyear inventory of groundwater moving slowly downslope through the water track soils as saturated and unsaturated groundwater flow.
In contrast, some sites show (largely unconfirmed) darkening well before subsurface temperatures approach 0°C. Soil salts are common across the MDV AOIs examined here (Toner, Sletten, and Prentice Citation2013; Bisson et al. Citation2015), which are hygroscopic and can form small soil brine droplets at high relative humidity (Gough et al. Citation2017). Under very high ground-level humidity conditions, these brine droplets can grow in size, altering the optical properties of the soil and darkening it by several percent, even at surface temperatures below freezing (Levy Citation2021). We hypothesize that growth of water track and wetland brine droplets under subfreezing conditions may be driving the very early and very late season darkening observed in water tracks and wetlands at temperatures well below 0°C as part of the salt and clay “eutectic active layer” recognized across saline soils in the MDV (Cuozzo et al. Citation2020). Sites showing notable darkening distributed along the water track flow path that darken prior to the arrival of the 0°C isotherm include South Fork and Wormherder Creek.
Accordingly, we interpret the water track and wetland darkening timescales observed in this study to indicate that meltwater, ongoing groundwater flow, and more exotic processes like the growth of biogeochemically active brine droplets all contribute moisture to water track and wetland soils in these study sites. Importantly, each season, these wetland and water track sources drive soil darkening before snow- and glacier melt, persist through the previously recognized thaw season, and continue past the cessation of surface runoff from glaciers and snowbanks as snow blankets ablation zone sites or surface temperatures drop (e.g., ). Accordingly, soil hydroperiod exceeds that of most MDV streams by approximately one month early in the season (November versus mid-December for streams) and by a month or more on the end of the season (February/March versus mid-January for streams; Gooseff et al. Citation2016). Our remote sensing observations of the duration of water track and wetland darkening expand our understanding of the period during which soils are wetted in the MDV by at least a month, both early in the summer season (November) and late in the summer season (February into March). The diversity of hydrological processes at work in the MDV and the soil biogeochemical response to these wetting processes suggest a reconsideration of when the summer “thaw” season is in the MDV and support expansion of the concept of austral summer to include more of these shoulder seasons (Obryk et al. Citation2020).
Remote sensing data set intercomparison
After analyzing both PlanetScope and WorldView data sets, are there particular advantages or disadvantages to each constellation’s use for polar hydrological studies? For this particular study, related to the timing and duration of water track and wetland darkening, the rapid-repeat cadence of Planet imagery was absolutely essential. Across the MDV AOIs, the full record of WorldView repeat observations is not as dense as one year of Planet observations. As a consequence, inferring the temporal relationship between soil darkening and concurrent soil temperature conditions is only possible with the PlanetScope data. In contrast, WorldView observations are sparse to the point that it was more informative to compare WorldView ground observations to interannual temperature ranges than to infer particular ground thaw conditions in particular WorldView frames. However, for other questions, WorldView data may provide different and greater insights than the PlanetScope observations. In addition to more spectroscopic bands (Salvatore Citation2015; Salvatore et al. Citation2020), WorldView imagers have higher signal/noise and greater pixel depth, which means more sensitivity to the magnitude of darkening at water track and wetland sites. This optical sensitivity may be useful for inferring the magnitude of soil wetting, not merely its presence or absence as reported here. Likewise, WorldView’s high spatial resolution may permit the identification of small-scale patches of water tracks and wetland soils that are not detectable with 3 m/pixel PlanetScope imagery; for example, wetting activity at sites like Pearse Valley, Vashka Parallels, or Beacon Cirque.
Water track hydroperiod summary and future work
Our results indicate idiosyncratic hydrological behavior for each site, within the context of broader durations of cold desert soil wetting than previously known. Each individual site’s specific physical characteristics (soil properties, azimuth, elevation, etc.) have some control over hydroperiod characteristics, as illustrated by the range of confirmed and unconfirmed start and end dates. This motivates the need for future site-by-site characterization of the conditions that lead to melt and/or porewater growth at these sites. Within individual water tracks and wetlands, salt concentrations, clay concentrations, and seasonal ice concentrations may be spatially variable, producing complex patterns of wetting and biogeochemical processes over multiyear timescales. Unraveling the site-by-site characteristics that lead to melt and/or soil darkening through soil brine droplet growth can only be achieved through denser on-the-ground sampling of soil microclimate conditions, including surface temperature, relative humidity, ground temperature, and soil moisture content.
Finally, this work points toward future applications of machine learning to automatically identify darkening associated with water tracks in terrain corrected image data sets over longer time periods and across greater spatial extents. Geostatistical workflows have been used to identify albedo change in remote sensing image data on both Earth and Mars (e.g., Cooley and Pavelsky Citation2016; Stillman et al. Citation2020). This data set could provide vital manual mapping data for training neural network–based water track identification in image data or mask region-based convolutional neural networks used to automatically delineate the extent of the water track features (e.g., He et al. Citation2018).
Conclusions
We determined the onset, duration, and end date of water track and wetland soil darkening across a range of MDV soil sites using in situ (high temporal, no spatial resolution) and orbital sensors with moderate and high temporal resolution and moderate and high spatial resolution. Contrary to previous analyses that suggest a water track and wetland hydroperiod beginning with the onset of surface thaw in December and ending with freeze-up in late January, we find that water track and wetland darkening begins in November and runs at least as late as February in most years, potentially into March in others. Water track and wetland darkening occurs at temperatures below 0°C and persists after soil temperature drop back below 0°C at the end of summer. Though qualitative, these remote sensing classifications of soil darkening are more certain than prior satellite observations of Antarctic water track and wetland darkening because they are derived from our empirical terrain correction method, which removes false-positive identifications of dark wetted soil by removing the effects of differential illumination on rough topography as well as in-scene shadowing. This extended hydroperiod has intriguing implications for biogeochemical processes such as long-term soil development in the Antarctic, biological functioning in long-lived soil waters and droplets, and the thermal evolution of Antarctic permafrost. Our observations can serve as a baseline for detecting future change in the duration and extent of water track and wetland processes in the terrestrial Antarctic in response to future climate change.
Supplemental Material
Download Zip (115.2 MB)Acknowledgments
Thanks to the Colgate Martians undergraduate data analysis team, including Kyle Baun, Max Wang, MC Rapoza, Izzy King, and Gary Kuang.
Disclosure statement
No potential conflict of interest was reported by the authors.
Data availability statement
Weather station data used in this study are available for download from the MCM-LTER at mcmlter.org. Active layer temperature and soil moisture data used in this station are archived at the U.S. Antarctic Program Data Center and can be accessed at https://www.usap-dc.org/view/dataset/600139. Planet data were made available to this project under the Planet Federal Contract. WorldView data were provided via the Polar Geospatial Center.
Supplementary material
Supplemental data for this article can be accessed online at https://doi.org/10.1080/15230430.2022.2123858.
Additional information
Funding
Related Research Data
References
- Arp, C. D., M. S. Whitman, B. M. Jones, G. Grosse, B. V. Gaglioti, and K. C. Heim. 2015. Distribution and biophysical processes of beaded streams in Arctic permafrost landscapes. Biogeosciences 12 (1):29–47. doi:10.5194/bg-12-29-2015.
- Ball, B. A., and J. Levy. 2015. The role of water tracks in altering biotic and abiotic soil properties and processes in a polar desert in Antarctica. Journal of Geophysical Research Biogeosciences 120 (2):270–79. doi:10.1002/2014JG002856.
- Bindschadler, R., P. Vornberger, A. Fleming, A. Fox, J. Mullins, D. Binnie, S.J. Paulsen, B. Granneman, and D. Gorodetzky. 2008. The Landsat image mosaic of Antarctica. Remote Sensing of Environment 112 (12):4214–26. doi:10.1016/j.rse.2008.07.006.
- Bisson, K. M., K. A. Welch, S. A. Welch, J. M. Sheets, W. B. Lyons, J. S. Levy, and A. G. Fountain. 2015. Patterns and processes of salt efflorescences in the McMurdo region, Antarctica. Arctic, Antarctic, and Alpine Research 47 (3):407–25. doi:10.1657/AAAR0014-024.
- Brinson, M. M. (1993). A hydrogeomorphic classification for wetlands. U.S. Army Corps of Engineers Wetlands Research Program Technical Report, WRP-DE-4, 103 p. http://www.dtic.mil/docs/citations/ADA270053
- Campbell, I. B., and G. Claridge (1987). Antarctica: Soils, weathering processes and environment. Amsterdam & New York: Elsevier Science Publishers. http://journals.cambridge.org/production/action/cjoGetFulltext?fulltextid=223184
- Campbell, I. B., G. G. Claridge, D. I. Campbell, and M. R. Balks. 1998. The soil environment of the McMurdo Dry Valleys, Antarctica. In Ecosystem dynamics in a polar desert, ed. J. C. Priscu, 297–322. Washington, DC: American Geophsyical Union. http://onlinelibrary.wiley.com/doi/10.1029/AR072p0297/summary.
- Cartwright, K., H. J. Harris. 1982. Hydrogeology of the Dry Valley region, Antarctica. In Dry Valley Drilling Project, ed. L. D. McGinnis, 193–214. Washington, DC: American Geophysical Union.
- Cooley, S. W., and T. M. Pavelsky. 2016. Spatial and temporal patterns in Arctic river ice breakup revealed by automated ice detection from MODIS imagery. Remote Sensing of Environment 175:310–22. doi:10.1016/j.rse.2016.01.004.
- Cuozzo, N., R. S. Sletten, Y. Hu, L. Liu, F.-Z. Teng, and B. Hagedorn. 2020. Silicate weathering in Antarctic ice-rich permafrost: Insights using magnesium isotopes. Geochimica et Cosmochimica Acta 278:244–60. doi:10.1016/j.gca.2019.07.031.
- Doran, P., and A. Fountain. 2019. McMurdo Dry Valleys LTER - High frequency measurements from Lake Bonney Meteorological Station (BOYM) - Taylor Valley, Antarctica - 1993 to present ver. 17. Environmental Data Initiative. https://doi.org/10.6073/pasta/bee9b480f56ed8ea651b03648ee43c8d
- Doran, P. T., C. P. McKay, G. D. Clow, G. L. Dana, A. G. Fountain, T. Nylen, and W. B. Lyons. 2002. Valley floor climate observations from the McMurdo Dry Valleys, 1986–2000. Antarctica. 107(D24):ACL–13. doi:10.1029/2001JD002045.
- Fountain, A. G., J. Fernandez-Diaz, M. K. Obryk, J. Levy, and M. N. Gooseff. 2017. High-resolution elevation mapping of the McMurdo Dry Valleys, Antarctica, and surrounding regions. Earth System Science Data 9:435–43. doi:10.5194/essd-9-435-2017.
- Fountain, A. G., J. S. Levy, M. N. Gooseff, and D. Van Horn. 2014. The McMurdo Dry Valleys: A landscape on the threshold of change. Geomorphology 225:25–35. doi:10.1016/j.geomorph.2014.03.044.
- Gao, B.-C. 1996. NDWI—A normalized difference water index for remote sensing of vegetation liquid water from space. Remote Sensing of Environment 58 (3):257–66. doi:10.1016/S0034-4257(96)00067-3.
- Gardner, C. B., M. A. Diaz, D. F. Smith, A. G. Fountain, J. S. Levy, and W. B. Lyons. 2022. Isotopic signature of massive, buried ice in eastern Taylor Valley, Antarctica: Implications for its origin. Arctic, Antarctic, and Alpine Research 54 (1):335–45. doi:10.1080/15230430.2022.2102510.
- George, S. F., N. Fierer, J. S. Levy, and B. Adams. 2021. Antarctic water tracks: Microbial community responses to variation in soil moisture, pH, and salinity. Frontiers in Microbiology 12. doi:10.3389/fmicb.2021.616730.
- Gooseff, M. N., A. Balser, W. B. Bowden, and J. B. Jones. 2011. Effects of hillslope thermokarst in Northern Alaska. Eos, Transactions American Geophysical Union 90 (4):29–30. doi:10.1029/2009EO040001.
- Gooseff, M. N., D. M. McKnight, P. Doran, A. G. Fountain, and W. B. Lyons. 2011. Hydrological connectivity of the landscape of the McMurdo Dry Valleys, Antarctica. Geography Compass 5 (9):666–81. doi:10.1111/j.1749-8198.2011.00445.x.
- Gooseff, M. N., A. Wlostowski, D. M. McKnight, and C. Jaros. 2016. Hydrologic connectivity and implications for ecosystem processes - Lessons from naked watersheds. Geomorphology 1–9. doi:10.1016/j.geomorph.2016.04.024.
- Gough, R. V., J. Wong, J. L. Dickson, J. S. Levy, J. W. Head, D. R. Marchant, and M. A. Tolbert. 2017. Brine formation via deliquescence by salts found near Don Juan Pond, Antarctica: Laboratory experiments and field observational results. Earth and Planetary Science Letters 476:189–98. doi:10.1016/j.epsl.2017.08.003.
- Harris, K. J., A. E. Carey, W. B. Lyons, K. A. Welch, and A. G. Fountain. 2007. Solute and isotope geochemistry of subsurface ice melt seeps in Taylor Valley, Antarctica. Geological Society of America Bulletin 119 (5–6):548–55. doi:10.1130/B25913.1.
- Hastings, S. J., S. A. Luchessa, W. C. Oechel, and J. D. Tenhunen. 1989. Standing biomass and production in water drainages of the foothills of the Philip Smith Mountains, Alaska. Ecography 12 (3):304–11. doi:10.1111/j.1600-0587.1989.tb00850.x.
- He, K., G. Gkioxari, P. Dollár, and R. Girshick (2018). Mask R-CNN. ArXiv:1703.06870 [Cs]. http://arxiv.org/abs/1703.06870
- Heldmann, J. L., M. Marinova, K. E. Williams, D. Lacelle, C. P. Mckay, A. Davila, W. Pollard, and D.T. Andersen. 2012. Formation and evolution of buried snowpack deposits in Pearse Valley, Antarctica, and implications for Mars. Antarctic Science 24 (3):299–316. doi:10.1017/S0954102011000903.
- Jorgenson, M. T., Y. L. Shur, and E. R. Pullman. 2006. Abrupt increase in permafrost degradation in Arctic Alaska. Geophysical Research Letters 33 (2):180–84. doi:10.1029/2005GL024960.
- Kanevskiy, M., Y. Shur, J. Strauss, T. Jorgenson, D. Fortier, E. Stephani, and A. Vasiliev. 2016. Patterns and rates of riverbank erosion involving ice-rich permafrost (yedoma) in northern Alaska. Geomorphology 253 (C):370–84. doi:10.1016/j.geomorph.2015.10.023.
- Langford, Z. L., M. N. Gooseff, and D. Lampkin. 2015. Spatiotemporal dynamics of wetted soils across a polar desert landscape, McMurdo Dry Valleys Antarctica. Antarctic Science 27 (2):197–209. doi:10.1017/S0954102014000601.
- Lee, J. R., B. Raymond, T. J. Bracegirdle, I. Chadès, R. A. Fuller, J. D. Shaw, and A. Terauds. 2017. Climate change drives expansion of Antarctic ice-free habitat. Nature 547 (7661):49–54. doi:10.1038/nature22996.
- Levy, J. S. (2015). Cryptic hydrology of the McMurdo Dry Valleys: Water track contributions to water and geochemical budgets in Taylor Valley, Antarctica. USAP Data Center. Retrieved from https://doi.org/10.15784/600139
- Levy, J. S. 2021. Episodic basin-scale soil moisture anomalies associated with high relative humidity events in the McMurdo Dry Valleys, Antarctica. Antarctic Science 33 (5):533–47. doi:10.1017/S0954102021000341.
- Levy, J. S., C. S. Cary, K. Joy, and C. K. Lee. 2020. Detection and community-level identification of microbial mats in the McMurdo Dry Valleys using drone-based hyperspectral reflectance imaging. Antarctic Science 69:1–15. doi:10.1017/S0954102020000243.
- Levy, J. S., A. G. Fountain, J. L. Dickson, J. W. Head, M. Okal, D. R. Marchant, and J. Watters. 2013. Accelerated thermokarst formation in the McMurdo Dry Valleys, Antarctica. Scientific Reports 3. doi:10.1038/srep02269.
- Levy, J. S., A. G. Fountain, M. N. Gooseff, J. E. Barrett, R. VanTreese, K. A. Welch, et al. 2013. Water track modification of soil ecosystems in Taylor Valley, Antarctica. Antarctic Science. 26(2):153–62. doi:10.1017/S095410201300045X.
- Levy, J. S., A. G. Fountain, M. N. Gooseff, K. A. Welch, and W. B. Lyons. 2011. Water tracks and permafrost in Taylor Valley, Antarctica: Extensive and shallow groundwater connectivity in a cold desert ecosystem. Geological Society of America Bulletin 123 (11–12):2295–311. doi:10.1130/B30436.1.
- Levy, J. S., A. G. Fountain, M. Obryk, J. Telling, C. Glennie, R. Pettersson, M. Gooseff, and D.J. Van Horn. 2008. Decadal topographic change in the McMurdo Dry Valleys of Antarctica: Thermokarst subsidence, glacier thinning, and transfer of water storage from the cryosphere to the hydrosphere. Geomorphology 323:80–97. doi:10.1016/j.geomorph.2018.09.012.
- Levy, J. S., A. Nolin, A. Fountain, and J. Head. 2014. Hyperspectral measurements of wet, dry, and saline soils from the McMurdo Dry Valleys: Soil moisture properties from remote sensing. Antarctic Science 26 (5):565–72. doi:10.1017/S0954102013000977.
- Levy, J. S., and L. Schmidt. 2016. Thermal properties of Antarctic soils: Wetting controls subsurface thermal state. Antarctic Science 28 (5):361–70. doi:10.1017/S0954102016000201.
- Li, J., and Y. Sheng. 2012. An automated scheme for glacial lake dynamics mapping using Landsat imagery and digital elevation models: A case study in the Himalayas. International Journal of Remote Sensing 33 (16):5194–213. doi:10.1080/01431161.2012.657370.
- Linhardt, T., J. S. Levy, and C. K. Thomas. 2019. Water tracks intensify surface energy and mass exchange in the Antarctic McMurdo Dry Valleys. The Cryosphere 13 (8):2203–19. doi:10.5194/tc-13-2203-2019.
- Lyons, W. B., K. R. Dailey, K. A. Welch, K. M. Deuerling, S. A. Welch, and D. M. McKnight. 2015. Antarctic streams as a potential source of iron for the Southern Ocean. Geology 43 (11):1003–06. doi:10.1130/G36989.1.
- Lyons, W. B., K. A. Welch, A. E. Carey, P. T. Doran, D. H. Wall, R. A. Virginia, A.G. Fountain, B.M. Csathó, and C.M. Tremper. 2005. Groundwater seeps in Taylor Valley Antarctica: An example of a subsurface melt event. Annals of Glaciology. 40(1):200–06. doi:10.3189/172756405781813609.
- McKnight, D. M., D. K. Niyogi, A. S. Alger, A. Bomblies, P. A. Conovitz, and C. M. Tate. 1999. Dry valley streams in Antarctica: Ecosystems waiting for water. BioScience 49 (12):985–95. doi:10.2307/1313732.
- McNamara, J. P., D. L. Kane, and L. D. Hinzman. 1999. An analysis of an Arctic channel network using a digital elevation model. Geomorphology 29 (3):339–53. doi:10.1016/S0169-555X(99)00017-3.
- Mikucki, J. A., E. AUken, S. Tulaczyk, R. A. Virginia, C. Schamper, K. I. Sørensen, P.T. Doran, H. Dugan, and N. Foley. 2015. Deep groundwater and potential subsurface habitats beneath an Antarctic dry valley. Nature Communications 6(1). doi: 10.1038/ncomms7831.
- Munaretto, G., M. Pajola, A. Lucchetti, C. Re, G. Cremonese, E. Simioni, C. Re, S. Bertoli, L. Tornabene, A.S. McEwen, P. Becerra, et al. 2021. Topographic correction of HiRISE and CaSSIS images: Validation and application to color observations of Martian albedo features. Planetary and Space Science 200:105198. doi:10.1016/j.pss.2021.105198.
- Obryk, M. K., P. T. Doran, A. G. Fountain, M. Myers, and C. P. McKay. 2020. Climate from the McMurdo Dry Valleys, Antarctica, 1986–2017: Surface air temperature trends and redefined summer season. Journal of Geophysical Research: Atmospheres 125 (13):e2019JD032180. doi:10.1029/2019JD032180.
- Olund, S., W. B. Lyons, S. A. Welch, and K. A. Welch. 2018. Fe and nutrients in coastal Antarctic streams: Implications for primary production in the Ross Sea. Journal of Geophysical Research: Biogeosciences 123 (12):3507–22. doi:10.1029/2017JG004352.
- Planet Team. 2017. Planet application program interface: In space for life on Earth. San Francisco, CA. https://www.earthdata.nasa.gov/s3fs-public/2022-06/PlanetCSDA8-Band_Data_0.pdf
- Rob, R., B. Liane, T. Martyn, and T. Slawek. 2008. Bioavailable iron in the Southern Ocean: The significance of the iceberg conveyor belt. Geochemical Transactions 9 (1):7. doi:10.1186/1467-4866-9-7.
- Runkel, R. L., D. M. McKnight, and E. D. Andrews. 1998. Analysis of transient storage subject to unsteady flow: Diel flow variation in an Antarctic stream. Journal of the North American Benthological Society 17 (2):143–54. doi:10.2307/1467958.
- Salvatore, M. R. 2015. High resolution compositional remote sensing of the Transantarctic Mountains: Application to the WorldView-2 dataset. Antarctic Science 27 (5):473–91. doi:10.1017/S095410201500019X.
- Salvatore, M. R., S. R. Borges, J. E. Barrett, E. R. Sokol, L. F. Stanish, S. N. Power, and P. Morin. 2020. Remote characterization of photosynthetic communities in the Fryxell basin of Taylor Valley, Antarctica. Antarctic Science 32 (4):255–70. doi:10.1017/S0954102020000176.
- Salvatore, M. R., J. F. Mustard, J. W. Head, D. R. Marchant, and M. B. Wyatt. 2014. Characterization of spectral and geochemical variability within the Ferrar Dolerite of the McMurdo Dry Valleys, Antarctica: Weathering, alteration, and magmatic processes. Antarctic Science 26 (1):49–68. doi:10.1017/S0954102013000254.
- Salvatore, M. R., B. Szutu, H. Matul, J. Levy, E. R. Sokol, J. E. Barrett, L. Fackrell, L. Kuentz, and M. Gooseff (2021). Remotely investigating the spatial and temporal distribution of soil moisture in the McMurdo Dry Valleys of Antarctica: Hydrological and ecological implications. Presented at the AGU Fall Meeting, New Orleans, LA.
- Schmidt, L., and J. S. Levy. 2017. Hydraulic conductivity of active layer soils in the McMurdo Dry Valleys, Antarctica: Geological legacy controls modern hillslope connectivity. Geomorphology 283 (C):61–71. doi:10.1016/j.geomorph.2017.01.038.
- Stillman, D. E., B. D. Bue, K. L. Wagstaff, K. M. Primm, T. I. Michaels, and R. E. Grimm. 2020. Evaluation of wet and dry recurring slope lineae (RSL) formation mechanisms based on quantitative mapping of RSL in Garni Crater, Valles Marineris, Mars. Icarus 335:113420. doi:10.1016/j.icarus.2019.113420.
- Strauss, J., A. N. Fedorov, D. Fortier, D. Froese, M. Fuchs, G. Grosse, F. Günther, J. Harden, G. Hugelius, M. Kanevskiy, et al. (2016). Ice-rich yedoma permafrost: Circum-arctic distribution and thickness synthesis. EPIC3Annual Meeting of the “Working Group Permafrost,” German Society for Polar Research, Hamburg, Germany, 2016-01-22-2016-01-24. Retrieved from http://epic.awi.de/39678/
- Sudman, Z., M. N. Gooseff, A. G. Fountain, J. S. Levy, M. K. Obryk, and D. Van Horn. 2017. Impacts of permafrost degradation on a stream in Taylor Valley, Antarctica. Geomorphology 285 (C):205–13. doi:10.1016/j.geomorph.2017.02.009.
- Swanger, K. M., and D. R. Marchant. 2007. Sensitivity of ice-cemented Antarctic soils to greenhouse-induced thawing: Are terrestrial archives at risk? Earth and Planetary Science Letters 259 (3–4):347–59. doi:10.1016/j.epsl.2007.04.046.
- Toner, J. D., and R. S. Sletten. 2013. The formation of Ca-Cl-rich groundwaters in the Dry Valleys of Antarctica: Field measurements and modeling of reactive transport. Geochimica et Cosmochimica Acta 110 (C):84–105. doi:10.1016/j.gca.2013.02.013.
- Toner, J. D., R. S. Sletten, and M. L. Prentice. 2013. Soluble salt accumulations in Taylor Valley, Antarctica: Implications for paleolakes and Ross Sea Ice Sheet dynamics. Journal of Geophysical Research: Earth Surface 118 (1):198–215. doi:10.1029/2012JF002467.
- Wier, I. 2018. Phytoplankton silica uptake relating to leakage and carbon export. Presented at POLAR 2018, Davos, Switzerland. Abstract #693.