
 ?Mathematical formulae have been encoded as MathML and are displayed in this HTML version using MathJax in order to improve their display. Uncheck the box to turn MathJax off. This feature requires Javascript. Click on a formula to zoom.
ABSTRACT
A reconstruction of the last 2,000 years BP of environmental and oceanographic changes on the western margin of Spitsbergen was performed using a multidisciplinary approach including the fossil assemblages of diatoms, planktic and benthic foraminifera and calcareous nannofossils and the use of geochemistry (X-ray fluorescence spectroscopy, X-ray diffraction). We identified two warm periods (2,000–1,600 years BP and 1,300–700 years BP) that were associated with the Roman Warm Period and the Medieval Warm Period that alternate with colder oceanic conditions and sea ice coverage occurred during the Dark Ages (1,600–1,300 years BP) and the beginning of the Little Ice Age. During the Medieval Warm Period the occurrence of ice-rafted debris and Aulocoseira spp., a specific diatom genus commonly associated with continental freshwater, suggests significant runoff of meltwaters from local glaciers.
Introduction
The Arctic Ocean is the area most sensitive to global warming and oceanographic changes on our planet (Moritz, Bitz, and Steig Citation2002; Serreze and Francis Citation2006; Francis and Vavrus Citation2012; Stroeve et al. Citation2012; Cohen et al. Citation2014). Its sensitivity is demonstrated by the recent fast change of arctic permafrost stability, by the thinning and retreat of sea ice (Stroeve et al. Citation2008; Overland et al. Citation2019), and by the acceleration and thinning of the ice streams that drain the Greenland ice sheet (Howat, Joughin, and Scambos Citation2007; Howat et al. Citation2008). These environmental changes on the Arctic margin are caused either by natural factors, such as change of albedo, clouds, solar radiation, change in atmospheric and oceanic heat transport (Praetorius et al. Citation2018), or by human activities responsible for the increase of atmospheric greenhouse gases (e.g., Huntington et al. Citation2007; Solomon et al. Citation2007; Normand et al. Citation2017). To distinguish between anthropogenic contributions versus natural changes, it is necessary to study past natural climate and environmental changes.
Since the 2010s, the scientific community has been focusing on the study of the last 2,000 years BP (e.g., PAGES 2k Program Citation2013). This interval contains information about both natural climate variability and climate changes induced by human activities. Moreover, the information obtained from the last 2,000 years BP can be used for numerical modeling to predict future climate scenarios. In northwestern Europe and along the western Spitsbergen margin, the last 2,000 years BP is characterized by climatic fluctuations, including the Roman Warm Period (RWP; 250 BC to 400 AD = 2,200–1,550 years BP), the Dark Ages Cold Period (400–900 AD = 1,550–1,050 years BP), the Medieval Warm Period (MWP; 900–1250 AD = 1,050–700 years BP), the Little Ice Age (1250–1900 AD = 700–550 years BP), and the recent warming starting at the end of nineteenth century and last fifty years (e.g., Lamb Citation1977; Eiríksson et al. Citation2006; Cage and Austin Citation2010; Cunningham et al. Citation2013; Easterbrook Citation2016; Polodova Asteman, Filipsson, and Nordberg Citation2018). Recent studies (e.g., Jiang et al. Citation2002; Spielhagen et al. Citation2011; Matul et al. Citation2018; Zamelczyk et al. Citation2020) suggested that the warm periods are caused by a strengthening inflow of warm Atlantic Water (AW) that flows northward to the Arctic Ocean via the Fram Strait ().
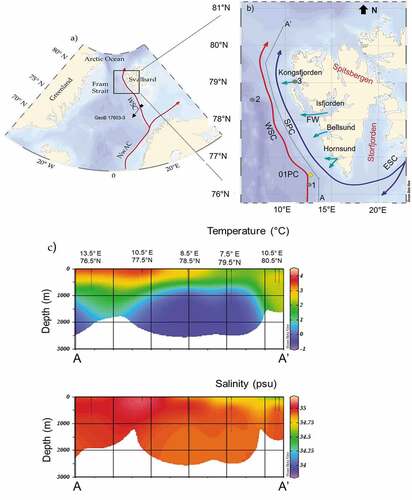
Figure 1. (a) Schematic map of the northern North Atlantic showing the location of the Fram Strait. The red arrow represents the path of the warm Atlantic Water: Norwegian Atlantic Current (NwAC), WSC. A black square indicates core GeoB 17603-3, used for the construction of the age model. (b) Western Spitsbergen Margin showing the main oceanographic currents. The red arrow represents the path of the warm AW, the blue arrows represent the cold and fresher East Spitsbergen Current and the Spitsbergen Polar Current. The green arrows indicate the continental freshwater (FW) input from the fjords to marine domains. Yellow diamond indicates the studied core GS191-01PC (01-PC in the figure). The full gray dots indicate other core sites discussed in the article: (1) core HH12-1206BC (Zamelczyk et al. Citation2020), (2) core MSM5/5-712 (Werner et al. Citation2011; Müller et al. Citation2012; Cabedo-Sanz and Belt Citation2016; Matul et al. Citation2018), and (3) core NP05-21 (Jernas et al. Citation2013). The gray dotted line A–A′ indicates the hydrographic section. (c) Hydrographic section along the Western Spitsbergen Margin that shows the variation of temperature and salinity. Oceanographic data from H. E. Garcia et al. (Citation2019).
Variations in the inflow of AW into the Arctic Ocean have been linked to the North Atlantic Oscillation (NAO) atmospheric forcing (e.g., Trouet et al. Citation2009; Trouet, Scourse, and Raible Citation2012). The NAO index quantifies the difference in pressure between the Icelandic atmospheric minimum and the related Azores maximum, and it is an indicator of the strength of westerly winds and thus the inflow of AW into the Greenland, Iceland, and Norwegian (GIN) Seas. A deep Icelandic minimum in the north is associated with a positive NAO phase (Andersen, Koç, and Moros Citation2004). During a positive NAO phase, there is an increase in westerly winds bringing moist air over Europe and Siberia, an increase in AW in the Fram Strait, and an increase in atmospheric temperature, which causes a reduction in sea ice formation (e.g., Trouet et al. Citation2009; Trouet, Scourse, and Raible Citation2012). The Atlantic Meridional Overturning Circulation (AMOC) consists of a northward flow of warm, salty water in the North Atlantic and a southward return flow of cooled water. In addition, several studies (e.g., Trouet et al. Citation2009; Olsen, Anderson, and Knudsen Citation2012; Trouet, Scourse, and Raible Citation2012; Faust et al. Citation2016) have demonstrated a link between environmental and oceanographic changes over the last millennium and the NAO and AMOC variations: the MWP was linked to a strong AMOC and a positive NAO, whereas during the Little Ice Age the weak AMOC and negative NAO were suggested to prevail. Different authors (T. L. Rasmussen et al. Citation2003; Ellingsen et al. Citation2008; Müller et al. Citation2012; Pathirana et al. Citation2015; Hoff et al. Citation2016; Berben et al. Citation2017) have focused on the environmental changes recorded in marine sediment cores spanning the Holocene along the western Svalbard margin and in particular during the last 2,000 years BP (Majewski, Szczuciński, and Zajączkowski Citation2009; Bonnet, De Vernal, and Hillaire-Marcel Citation2010; Spielhagen et al. Citation2011; Werner et al. Citation2011; Jernas et al. Citation2013; Rueda, Fietz, and Rosell-Melé Citation2013; Pawłowska et al. Citation2016; Matul et al. Citation2018; Zamelczyk et al. Citation2020). However, previous studies (e.g., Müller et al. Citation2012; Matul et al. Citation2018; Zamelczyk et al. Citation2020) considered the temporal variation of one or two environmental proxies (e.g., IP25 and other biomarkers, diatoms, planktic foraminifera) and thus lack information about the surface and/or bottom water masses. Because the Arctic Ocean is stratified, the multiproxy study offers the possibility to understand the full water column dynamic, allowing one to obtain information on stratification and the interaction between different water masses (e.g., Rueda, Fietz, and Rosell-Melé Citation2013). Because the state of water column stratification is important for the oceanic circulation pattern in our near future and its evolution is still uncertain, improving the understanding of the mixing/stratification of the water column over time will allow us to improve forecasts in this sensitive region (e.g., Rahmstorf et al. Citation2015).
Our study is mainly based on diatom assemblages, complemented by analyses on benthic and planktic foraminiferal and nannofossil assemblages, X-ray fluorescence spectroscopy (XRF) and X-ray diffraction (clay minerals) in core GS191-01 PC (), located at 1,647 m water depth on the western Spitsbergen margin, in an area characterized by a high sedimentation rate during the Holocene (e.g., Rebesco et al. Citation2013; Lucchi et al. Citation2014; Caricchi et al. Citation2019).
Study area
The Bellsund Drift is a contourite drift on the continental slope between 1,200 and 1,800 m water depth along the western margin of Spitsbergen. The mechanism responsible for sediment accumulation on the Bellsund contourite drift is transport operated by the Norwegian Sea Deep Water that is episodically fed by sediments transported to the deep environment by dense, cold, and saline (brine) water forming on the Barents continental shelf (Rebesco et al. Citation2013).
The western margin of Spitsbergen is characterized by the presence of the West Spitsbergen Current (WSC), which is a persistent along-slope current (). The WSC is the northernmost extension of the North Atlantic Current proceeding from the Gulf of Mexico (Aagaard, Foldvik, and Hillman Citation1987; Beszczynska-Möller et al. Citation2012). The WSC has a key role in the Arctic climate variability because it is the major conveyor of warm AW into the Arctic Ocean. WSC is responsible for sea ice–free conditions during winter in western Spitsbergen and exerts a control on deep water formation (Beszczynska-Möller et al. Citation2012; Walczowski et al. Citation2017).
Multiyear hydrographic sections conducted to measure the water column oceanographic properties outlined that the WSC vertical profile contains two main water layers: one located at ca. 400 m water depth with an average speed of 20 cm/s and a deeper one located at ca. 1,500 m water depth with an average speed of 9 cm/s. The latter represents the cold (< − 0.9°C) and saline (>34.91 PSU) Norwegian Sea Deep Water (e.g., Beszczynska-Möller et al. Citation2012; Von Appen et al. Citation2015). At the coring site, a seasonal and interannual thermohaline variability is associated with AW’s inflows and outflows of cold and fresh water from the fjords (; Bensi et al. Citation2019). Along the western Spitsbergen coast, there are four major fjords, Hornsund, Bellsund, Isfjorden, and Kongsfjorden (), that are characterized by the presence of tidewater glaciers in the inner part (e.g., Strzelecki et al. Citation2018; Halbach et al. Citation2019; Barzycka et al. Citation2020; Szeligowska et al. Citation2021). Also, Storfjorden, which is occupied by glacier systems, strongly impacts the oceanography of Svalbard (Skogseth et al. Citation2008). Meltwater discharge from fjord’s glacier impacts the adjacent marine area mainly through seasonal freshwater outflows (Bensi et al. Citation2019).
The Spitsbergen Polar Current is a coastal current that flows northward along the western Spitsbergen margin. The Spitsbergen Polar Current carries colder and less saline Arctic Water (ArW) originating from the Barents Sea area (Nilsen et al. Citation2016).
Geologically, the Spitsbergen’s bedrock ranges in age from Precambrian to Tertiary (Hjelle Citation1993; Elvevold, Dallmann, and Blomeier Citation2007). Along the coast of southern Spitsbergen, bedrock types include quartzite, phyllite, limestone, dolostone, conglomerate, and minor volcanic rocks (Elvevold, Dallmann, and Blomeier Citation2007). The Devonian succession related to very arid conditions is not well represented in the western side of Spitsbergen, except north of Isfjorden, where limestones and sandstone–shale successions can be found. The Carboniferous and Permian outcrops around the Isfjorden and Bellsund are represented by coal-seamed sandstones, and in the younger succession fossil-bearing limestones and dolostones, with gypsum and anhydrite beds. Mesozoic deposits outcrop on the Isfjorden and Bellsunds are mostly formed by shales, siltstones, sandstones, and rare limestones; at the beginning of the Cretaceous these rocks were intruded by magma that crystallized in dolerite (Elvevold, Dallmann, and Blomeier Citation2007). The Tertiary rocks are coal-rich sandstones and shales, locally containing plant fossils outcropping along the Bellsund and south Isfjorden (Hjelle Citation1993; Elvevold, Dallmann, and Blomeier Citation2007).
The spatial variation of clay minerals in the GIN Seas is strongly dependent on the lithologies of the adjacent lands. The illite clay mineral group is the major component of the marine surface sediments in the Barents Sea and along western Spitsbergen; this clay mineral group is typically a product of physical weathering (Chamley Citation1989; Vogt Citation1997; Vogt and Knies Citation2009). Vogt (Citation1997) indicated that the detrital input contributing to the high percentages of illites derives from high crystalline basement rocks (quartzite, phyllite, etc.). In the offshore study area, the main source can be associated with erosion and transport (Lucchi et al. Citation2013). The chlorite group is the second most abundant clay mineral in the western Spitsbergen margin surface sediments, also deriving from physical weathering of high crystalline rocks such as dolorite and metamorphic rocks (Wright Citation1974; Elverhøi et al. Citation1989). On Svalbard Mesozoic rocks are a potential source for chlorites; in fact, offshore southern Svalbard presents the highest chlorite percentages of the whole Barents Sea area (E. S. Rasmussen et al. Citation2008). The kaolinite group averages 17 percent in surface sediments from offshore Svalbard (Vogt and Knies Citation2009). Vogt and Knies (Citation2009) thus suggested that an enrichment in this clay mineral is principally due to local erosion of Mesozoic Svalbard outcrops. Smectite is the least represented clay mineral in the GIN Seas marine sediments. It is the result of hydrolysis and submarine weathering of basaltic rocks or diagenetic alteration (Chamley Citation1989). The presence of volcanogenic outcrops and smectite-bearing rocks is very limited on Svalbard. Moreover, smectite content decreases northward from the basaltic Greenland–Farøe oceanic ridge (e.g., Kuhlemann, Lange, and Paetsch Citation1993; Berner and Wefer Citation1994). This latitudinal trend has been associated with the sediment transport by the northward-flowing North Atlantic Current (Fagel et al. Citation2001; Vogt and Knies Citation2009; Junttila et al. Citation2010).
Materials and methods
The sediment core analyzed in this study, GS191-01PC, was collected from the crest of the Bellsund Drift at 76.52167°N; 12.73833°E and 1,647 m water depth () during a scientific cruise aboard the R/V G.O. Sars (June 2014), in the framework of the Eurofleets-2 Project PREPARED (Lucchi et al. Citation2014). The sediment core was X‐radiographed with computed axial tomography scanning technology at ENI Laboratories (Milan, Italy), and each core was split longitudinally into two halves. The archive section was visually described, digitally photographed, and analyzed with an Avaatech XRF core scan at the University of Barcelona (Spain) to determine the sediment chemical composition, and the working half was subsampled for the micropaleontological and sedimentological analyses (sampling details are discussed later).
Paleomagnetic and rock magnetic measurements were carried out at the Istituto Nazionale di Geofisica e Vulcanologia in Rome (Italy); for details, see Caricchi et al. (Citation2019).
Age model
The age model of the PREPARED core, GS191-01PC, was established by taking into account the variation in the relative paleointensity and paleomagnetic inclination curves, the lithological constraints, and the radiocarbon ages (Caricchi et al. Citation2019, Citation2022; ). Low-field magnetic susceptibility (k), natural remanent magnetization, and anhysteretic remanent magnetization (ARM) were measured at 1-cm spacing. The paleomagnetic and rock magnetic analyses and results were described in detail in Caricchi et al. (Citation2019).
Figure 2. Core correlation stratigraphy. The red arrows indicate the 14C ages, and the gray dashed lines indicate correlation between the tie points, lowfield magnetic susceptibility (k), and anhysteretic remanent magnetization (ARM) (modified from Caricchi et al. Citation2018, Citation2019).
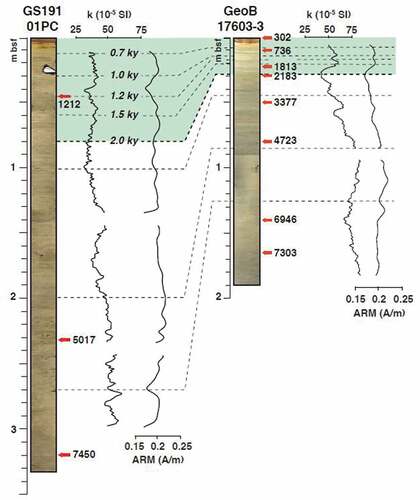
Taking advantage of the high-resolution and well-constrained Holocene record from nearby core GeoB17603-3, collected at Kveithola trough mouth fan (Caricchi et al. Citation2018), we carried out high-resolution core correlations between the cores using StratFit software (Sagnotti and Caricchi Citation2018), based on the linear regression between subsequent pairs of selected tie points. The tie points were chosen considering (1) the trend of multiple rock magnetic and paleomagnetic parameters (Caricchi et al. Citation2018, Citation2019), (2) the reconstructed age models (Caricchi et al. Citation2018, Citation2019, Citation2020), and (3) the lithofacies distribution (Caricchi et al. Citation2018, Citation2019). In , the correlation of k and ARM stratigraphic trends (see Caricchi et al. [Citation2018, Citation2019] for additional details about k and ARM parameters and their downcore variations) is shown as a representative example for the output of the high-resolution core correlation procedure. This procedure was used to validate and constrain the age model of the upper 78 cm of GS191-01PC corresponding to the last 2,000 years BP. Based on the age model the mean sedimentation rate is 0.039 cm/year.
Sedimentological analyses
The identification of the clay mineral assemblage was performed on eight samples through X-ray diffraction analyses. The samples were freeze-dried and sieved with distilled water using a 63-µm mesh. The <63 µm fine fraction was then treated with diluted hydrogen peroxide at 10 volume percent for 24 hours to remove the organic matter and centrifuged (1 minute at 1,050 rounds/min) to separate the silt fraction (>2 µm) from the clay fraction remaining in suspension. The suspension was then centrifuged for 10 minutes at 3,980 rounds/min to settle the clay fraction, which was smeared onto glass slides and analyzed with a Siemens D500 diffractometer with CuKα radiation and generator setting 20 mA, 40 kV.
Each sample was analyzed between 2° and 40° 2θ, with a step size of 0.02° 2θ in the air-dried state. The samples were then treated with ethylene glycol solvation, which permits the expansion of the smectite peak to a basal spacing of about 17 Å and the glycolated samples were scanned between 23° and 26° 2θ, with a step size of 0.01° 2θ to distinguish the chlorite-kaolinite twin peaks (Biscaye Citation1965). Semiquantitative estimation of the main clay mineral abundance (smectite, chlorite, and illite) was determined using MacDiff software (Petschick Citation2010). The relative percentages of each clay mineral were computed using weighting factors as described by Biscaye (Citation1965). The clay mineral percentage standard deviations were calculated using illite ±1 percent, smectite ±1 percent, kaolinite ±2.5 percent, and chlorite ±2.5 percent according to Damiani, Giorgetti, and Memmi Turbanti (Citation2006).
Illite, chlorite, and kaolinite are considered products of glacial erosion of the Spitsbergen and northwest Barents Sea area. Their presence in the sediments is associated with the glacial input (Wright Citation1974; Elverhøi et al. Citation1989; Vogt Citation2009; Lucchi et al. Citation2013). The smectite content is, instead, used as an indicator for AW inflow following Griffin, Windom, and Goldberg (Citation1968), Tucker (Citation1988), Vogt and Knies (Citation2009), and Junttila et al. (Citation2010).
Compositional XRF core scan analyses were performed at 1-cm resolution using the 10 and 30 kV settings. Selected elements were normalized versus titanium (Ti) following a standard procedure described in Croudace and Rothwell (Citation2015) and references therein. In this study, we consider the following ratios as paleoenvironmental proxies: Zr/Rb used as a grain size proxy (Wu et al. Citation2020) with positive peaks indicating higher percentages of coarse silt and sand, Si/Al used to determine the variation between the biogenic silica (Si) versus the detrital (Al) fraction (Dickson et al. Citation2010), Ca/Ti used to infer variations between the biogenic carbonate (Ca) and detrital (Ti) fractions (Olsen, Anderson, and Knudsen Citation2012; Lucchi et al. Citation2013), and Si/Ti and K/Ti used as proxies for the content of quartz and K-feldspars delivered to the area mainly by meltwaters and/or sea ice, therefore representing a detrital input (Marsh et al. Citation2007; Agnihotri et al. Citation2008; Diekmann et al. Citation2008; Piva et al. Citation2008; Lucchi et al. Citation2013, Citation2015; Shala et al. Citation2014). Additional information on the compositional proxies is reported in .
Table 1. Environmental meaning of the proxies used in this work.
Micropaleontological analyses
Diatoms
Diatom slides were prepared following the methodology described in Rathburn et al. (Citation1997). We used 0.5 g of dried sediment, and each sample was placed in a beaker with 60 mL of 35 percent hydrogen peroxide (H2O2), 40 mL of distilled water, and 0.5 g of anhydrous tetrasodium pyrophosphate (Na2H2P2O7). In addition, samples were also treated with 10 percent hydrochloric acid (HCl) solution to dissolve calcareous organisms and placed for 15 minutes on a hot plate (70°C). The sample was rinsed with distilled water every 8 hours to reach a pH of ca. 6. A known volume of solution (700 µL from 20 mL) was pipetted onto a coverslip placed inside a Petri dish together with distilled water to obtain a homogeneous distribution of diatoms on the coverslip. Excess water contained in the Petri dish was removed utilizing an immersion cotton thread in the Petri dish over a period of 10 to 20 hours. The use of a centrifuge was avoided to better preserve long and fragile diatoms such as the genus Thalassiothrix spp. A total of forty-five samples were analyzed for diatom analyses. After the preparation of the slides, diatoms were observed using a light microscope (Leica Leitz Dialux 20) at 1,000× magnification and a Zeiss (Immersol oil 518) immersion oil was used to allow the observation, following the counting rules proposed by Crosta and Koç (Citation2007). When possible, we counted at least 300 diatom valves per slide; in many cases the entire slide was analyzed without reaching this number. Nevertheless, we considered that the diatom assemblage could give a qualitative indication of the past environment change if adequately supported by other proxies. Sediment samples were considered barren if no valves were found along at least five transects. Taxonomic identification at the species level was based on Sancetta (Citation1982), Hasle and Syvertsen (Citation1997), and Pearce et al. (Citation2014).
The total absolute diatom abundance (ADA) in terms of the number of valves per gram of dry sediment (nv/gds) was calculated using the formula
where
| nv | = | is the number of total valves counted, |
| cA | = | is the counted area (mm2), |
| Ap | = | is the area of the Petri dish (mm2), |
| w | = | is the weight of dry sediments used (g), |
| Vs | = | is the quantity of initial solution (mL), |
| and Vp | = | is the pipetted solution (mL). |
The relative abundance of each species (expressed as a percentage) in each sample was calculated as the ratio of the number of valves of diatom species on the total diatom valves counted.
Additional information on the diatom ecology is reported in .
Calcareous nannofossils
Nine samples were analyzed for calcareous nannofossil content. All samples were prepared from unprocessed material as smear slides, following standard techniques (Bown and Young Citation1998), and examined using a Zeiss Axioskop light microscope at 1,250× magnification. Coccoliths were counted in 200 fields of view, corresponding to a smear slide area of 6.28 mm2, following the method described by Backman and Shackleton (Citation1983) and Rio, Raffi, and Villa (Citation1990). Relative abundance, expressed as a percentage, and absolute abundance, expressed as the number of specimens per 10 mm2 in the slides, were calculated. In this work, we considered the ecological index H/P, which is the ratio between Emiliania huxleyi and Coccolithus pelagicus. The H/P index is a useful proxy that gives an indication about the prevalence of warm Atlantic-derived water versus cold Polar and Arctic Water (Andruleit and Baumann Citation1998). Additional information on the calcareous nannofossil ecology is reported in .
Planktic and benthic foraminifera
For planktic and benthic foraminiferal analysis, the samples were dried at 40°C, weighed, and wet-sieved using a sieve of 63 µm, followed by dry sieving at 150 µm. A total of sixteen samples were analyzed for foraminiferal content. The samples were subdivided by dry splitting to obtain a subsample aliquot, where about 300 specimens were counted and identified at the species level in the sand fraction >150 µm. Specimen counting was performed on well-preserved tests and recorded as relative abundance (percentage). The planktic and benthic foraminiferal absolute abundances were reported as the number of specimens per gram of dry sediment. Planktic foraminifera were counted and identified at the species level following the taxonomy of Darling et al. (Citation2006) and El Bani Altuna et al. (Citation2018). The taxonomy of benthic foraminifera followed Ellis and Messina (Citation1940–1978), Loeblich and Tappan (Citation1953, Citation1987, Citation2015), Feyling-Hanssen et al. (Citation1971), Gabel (Citation1971), Knudsen (Citation1998), Wollenburg and Mackensen (Citation1998), Holbourn, Henderson, and MacLeod (Citation2013), and Setoyama and Kaminski (Citation2015). Additional information on the foraminifera ecology is reported in .
Results
Sedimentology
The sedimentary sequence consists of bioturbated mud with sparse and locally abundant clasts of ice-rafted debris (IRD fraction >1 mm; Grobe Citation1987; ). A 3-cm-diameter pebble was recovered at 26 to 27 cm below sea floor (bsf) corresponding to ~1,000 years BP according to the age model.
Figure 3. Photo and X-ray of the studied core GS191-01PC together with XRF ratios: Zr/Rb, Ca/Ti, Si/Al, Si/Ti, and K/Ti and clay mineral content against core depth. The age model is also reported. The yellow shades correspond to warm intervals and the gray shades correspond to cold intervals, as noted in the discussions. sm = smectite; kln = kaolinite; chl = chlorite; ill = illite.
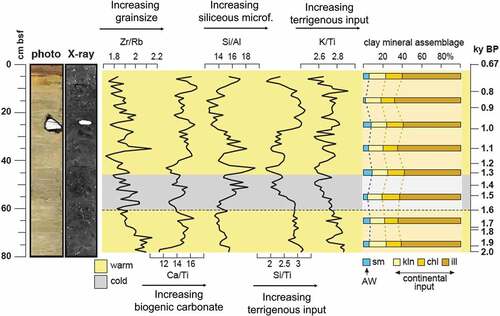
The grain size, and in particular the content of very coarse silt and sand indicated by the Zr/Rb ratio, generally decreases from the bottom to the top of the core, and two secondary decreasing trends can be distinguished between the bottom of the core and 37 cm bsf (~1,200 years BP) and the latter point to the top of the core. Relatively coarse-grained intervals are located between the bottom to 75 cm bsf (~2,000–1,940 years BP), between 60 and 51 cm bsf (~1,600–1,400 years BP), at 35 cm bsf (~1,100 years BP), and between 23 and 19 cm bsf (~950–900 years BP); the latter roughly corresponds to the presence of an IRD-rich interval also visible through X-ray images.
The Ca/Ti ratio generally increases up-core, with several fluctuations. One of the pronounced minimums of the Ca/Ti trend is located at the base of the interval between 60 and 42 cm bsf (~1,600–1,200 years BP).
The Si/Al ratio has maximum values between 55 and 27 cm bsf (~1,500–1,000 years BP) with an increasing trend in the upper part of the core from 11 cm bsf (~800 years BP) to the top.
Both Si/Ti and K/Ti decrease from the bottom to approximately 42 cm bsf (~1,200 years BP; ), with a minimum at 55 to 42 cm bsf (~1,500–1,200 years BP); after this interval the values increase to 11 cm bsf (~800 years BP) and decrease again in the uppermost part of the core.
The clay mineral assemblage is formed by illite (58–68 percent), kaolinite (15–17 percent), chlorite (13–18 percent), and smectite (2–12 percent; ). The illite relative abundance increases up to 68 cm bsf (~1,800 years BP) and then decreases between 68 and 48 cm bsf (~1,800–1,300 years BP), after which it increases until 18 cm bsf (~900 years BP) and decreases in the uppermost part of the core. The chlorite relative abundance decreases until 68 cm bsf (~1,800 years BP), after which it generally increases to the top of the core, with a minimum at 18 cm bsf (~900 years BP). The kaolinite content slightly decreases from the bottom to 70 cm bsf (~1,800 years BP) and then increases until 53 cm bsf (~1,400 years BP), after which it decreases toward the top of the core. The smectite content increases from the bottom until 48 cm bsf (~1,300 years BP) except at 58 cm bfs (~1,600 years BP) where the value drops, after which it remains almost constant from 38 to 28 cm bsf (~1,100–1,000 years BP) then decreases to its minimum value at 18 cm bsf (~900 years BP), and slightly increases toward the top of the core.
Micropaleontological proxies
Diatom assemblages
The ADAs vary from 0 to 530 × 104 v/gds (). Five barren intervals occur at 63 cm bsf (~1,700 years BP), 60 to 54 cm bsf (~1,600–1,500 years BP), 17 to 16 cm bsf (~900 years BP), 15 to 14 cm bsf (~850 years BP), and 10 cm bsf (~800 years BP). The higher absolute abundances of diatoms occur from 37 to 19 cm bsf (~1,100–900 years BP) and from 5 to 0 cm bsf (~700 years BP).
Figure 4. Absolute diatom abundance and down-core distribution of diatom species are expressed as relative abundance plots against the depth. The age model is also reported. The yellow shades correspond to warm intervals and the gray shades correspond to cold intervals. The white shade indicates a level barren in diatoms.
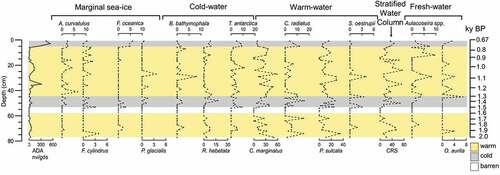
Actinocyclus curvatulus, Fragilariopsis cylindrus, and Fragilariopsis oceanica form the sea-ice margin group. Actinocyclus curvatulus has relative abundance ranging from 0 to 7 percent, F. cylindrus from 0 to 4 percent, and F. oceanica from 0 to 6 percent. Combined this diatom group varies from 0 to 10 percent and presents a relatively high value from the bottom to 69 cm bsf (~1,800 years BP), whereas from 67 to 5 cm bsf ~1,800–700 years BP) is rare except for some peaks at 53 cm bsf (~1,500 years BP) and at 41 cm bsf (~1,200 years BP). From 5 cm bsf (~700 years BP) this group reaches its maximum abundance.
Bacterosira bathyomphala, Rhizosolenia hebetata, Porosira glacialis, and Thalassiosira antarctica var. borealis (here after Thalassiosira antarctica) comprise the cold-water group. Bacterosira bathyomphala has a relative abundance ranging from 0 to 4 percent, R. hebetata from 0 to 17 percent, P. glacialis from 0 to 4 percent, and T. antarctica from 0 to 10 percent. Combined this diatom group has a relative abundance from 0 to 24 percent. From 72 to 69 cm bsf (~1,900–1,800 years BP) and between 50 and 37 cm bsf (~1,400–1,100 years BP) this group presents relative high percentage and then decreases until 5 cm bsf (~700 years BP); from 5 cm bsf to the top (~700–670 years BP) the cold-water group increases.
Chaetoceros resting spores (CRS) are the most abundant diatom taxon in the assemblage, with a relative abundance ranging from 0 to 80 percent, which decreases from the bottom to 51 cm bsf (~1,400 years BP) and increases from 48 to 15 cm bsf (~1,300–850 years BP), except for the interval 32 to 29 cm bsf (~1,100–1,000 years BP). From 15 cm bsf to the top (~850–670 years BP), CRS has an increasing trend but is less abundant than the previous interval. Coscinodiscus marginatus, Coscinodiscus radiatus, and Shionodiscus oestrupii comprise the warmwater group. Coscinodiscus marginatus has a relative abundance ranging from 0 to 60 percent, C. radiatus from 0 to 15 percent, and S. oestrupii from 0 to 6 percent. Combined these diatom species have relative percentages varying from 0 to 75 percent. From the bottom to 56 cm bsf (~2,000–1,500 years BP) the percentage of warmwater group decreases; from 56 to 5 cm bsf (~1,500–700 years BP) the warmwater group dominates the diatom assemblage but presents three decreases at 50 cm bsf (~1,400 years BP), 35 cm bsf (~1,100 years BP), and 24 cm bsf (~1,000 years BP), and it decreases from 5 cm bsf to the top core.
Paralia sulcata, also part of the warmwater group, has a relative abundance ranging from 0 to 34 percent. Paralia sulcata has an oscillating trend, with the major peaks at 74 cm bsf (~1900), from 53 to 46 cm bsf (~1,400–1,300 years BP), between 32 and 29 cm bsf (~1,000 years BP), and a last peak at 17 cm bsf (~900 years BP).
Aulacoseira spp. and Odontella aurita comprises the freshwater group. The relative abundance of this group varies from 0 to 12 percent. From the bottom to 46 cm bsf (~1,300 years BP), the freshwater group is less abundant, and then from 46 cm bsf (~1,300 years BP) to the top this group is present with maximum percentages of 10 percent.
Calcareous nannofossil assemblages
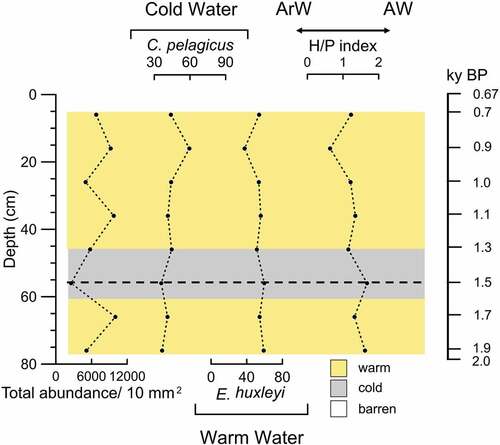
The calcareous nannofossil total abundance, calculated as the number of specimens per fixed area, ranges between 111 and 257 coccoliths/10 mm2 through the upper 78 cm bsf (). Emiliana huxleyi dominates the assemblage (38–59 percent) except for a drop at 16 cm bsf (~900 years BP) that corresponds to the peak of Coccolithus pelagicus. The latter form has relative abundance ranges between 36 and 60 percent. The H/P index spans from 0.63 to 1.67 through the studied interval. The H/P index is always greater than 1 except at 16 cm bsf (~900 years BP), where it reaches 0.63.
Figure 5. Down-core distribution of calcareous nannofossil species expressed as a percentage, total abundance, and H/P index plots against the depth. The age model is also reported. The yellow shades correspond to warm intervals and the gray shades correspond to cold intervals. The dotted line indicates the change in paleoenvironment at 1,500 years BP. ArW = Arctic Water. AW = Atlantic Water.
Planktic and benthic foraminiferal assemblages
The absolute planktic foraminiferal abundance ranges from 26 to about 160 planktic foramifera per gram of dry sediment (npf/gds) along the core ().
Figure 6. Down-core distribution of absolute planktic and benthic foraminifera abundance expressed as number of tests on grams of dry sediment and foraminifera species expressed as percentage plots against the depth. The age model is also reported. The yellow shades correspond to warm intervals and the gray shades correspond to cold intervals.
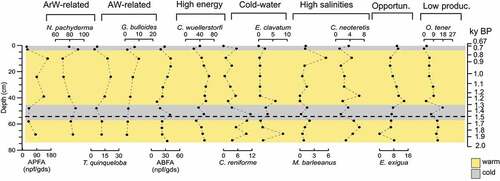
Neogloboquadrina pachyderma dominates the assemblage (60–100 percent); it is more abundant from the bottom to 48 cm bsf (~1,300 years BP) and then decreases toward until 10 cm bsf (~800 years BP) except for a peak of 90 percent at the top of the core.
Turborotalita quinqueloba has a relative abundance ranging from 0 to 20 percent; it has a low abundance from the bottom to 48 cm bsf (~1,300 years BP), subsequently increasing until 10 cm bsf (~800 years BP), and then decreases toward the top of the studied core. The relative abundances of Globigerina bulloides (1–10 percent) have a constant trend with a peak at 10 cm bsf (~800 years BP).
The absolute benthic foraminifera abundance spans from 11 to 40 (nbf/gds) along the core (). The absolute benthic foraminiferal abundance decreases from the bottom to 43 cm bsf (~1,200 years BP) except for a peak at 53 cm (~1,400 years BP), then increases until 10 cm (~800 years BP) and again decreases toward the top core. Cibicidoides wuellerstorfi dominates the assemblage (20–70 percent); it decreases from the bottom to 58 cm bsf (~1,600 years BP), increases until 10 cm bsf (~800 years BP), decreases until 3 cm bsf (~700 years BP), and then increases toward the top of the core. Cassidulina reniforme (0–12 percent) is more abundant from the bottom to 53 cm bsf (~1,500 years BP) and then decreases toward the top except for a peak at 3 cm bsf (~700 years BP). Elphidium clavatum (0–9 percent) is low abundant along the core except for two peaks at 68 cm bsf (~1,800 years BP) and 43 cm bsf (~1,200 years BP). Melonis barleeanus (0–6 percent) is present with very low relative abundance along the investigated sediment sequence except for a peak at 10 cm bsf (~800 years BP). Cassidulina neoteretis (0–8 percent) increases from the bottom to 63 cm bsf (~1,700 years BP) and then decreases toward the top except for peaks at 42 cm bsf (~1,200 years BP) and 10 cm bsf (~800 years BP). Oridorsalis tener (0–30 percent) decreases from the bottom toward the top of the core, except for a peak at 48 cm bsf (~1,300 years BP). Epistominella exigua (0–15 percent) in general increases toward the top with two peaks at 48 cm bsf (~1,300 years BP) and 3 cm bsf (~700 years BP).
Discussion
Paleoenvironmental changes during the last 2,000 years BP at Bellsund Drift
The studied time interval records an overall warming trend punctuated by minor climatic fluctuations that seem to be mainly associated with the variability of the AW inflow and its feedback on the marginal sea-ice formation. The progressive overall warming in the area can also be interpreted from a two-step decrease of the sediment grain size (Zr/Rb ratio) indicating a general progressive increasing distance of the glacial point source to the studied area.
We identified four main climatic phases that occurred during the last 2,000 years BP: 2,000–1,600, 1,600–1,300, 1,300–700, and 700–670 years BP (), mainly based on the micropaleontological assemblage (in particular, the occurence of diatom sea-ice species and cold-water species and sedimentological variations (in particular, the variation of the smectite clay mineral).
Figure 7. Age–depth plot for the studied sediments interval. The main climatic and paleoenvironmental events are illustrated, supported by sedimentological and micropaleontological evidence. The black line indicates the main climatic period recognized in the studied sedimentary sequence, the dotted lines limit the minor climatic event, black arrows indicate the increasing or decreasing of a proxy.
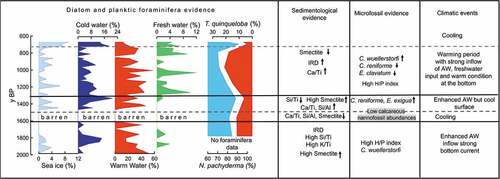
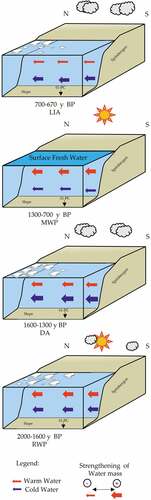
Figure 8. Sketch illustrating the oceanographic variations along the continental shelf margin of west Spitsbergen during the last 2,000 years BP.
Time interval: 2,000–1,600 years BP
During this time interval the abundance of Coscinodiscus marginatus and C. radiatus in the diatom assemblages and the presence of T. quinqueloba in the planktic foraminiferal assemblage suggest an inflow of warm AW. This interpretation is also supported by the high content of the calcareous nannofossils E. huxleyi and the high H/P index, as well as a relatively high input of smectite (). The contemporaneous dominance of the arctic foraminifera N. pachyderma and the planktic diatom R. hebetata suggests the co-existence of relatively cool and stratified water. We argue that the coexisting evidence of AW inflow input and the presence of cold surface waters may result from repeated advance and retreat of the sea ice in the surroundings. This interpretation is supported by the presence of the sea ice diatom F. cylindrus and F. oceanica occurring between 1,900 and 1,800 years BP and CRS that are usually associated with very high primary productivity. In polar regions CRS could also reflect sea-ice melting and surface water stratification if they account for more than 20 percent of the total assemblage (Leventer et al. Citation1996; Armand et al. Citation2005) as in our record. The relatively high values of Si/Ti and K/Ti ratios and the diffuse abundance of small-size gravel (IRD) visible through the X-ray images also support a consistent sediment input through sea-ice melting. According to Müller et al. (Citation2012), the western Spitsbergen area was characterized during the last 3,000 years BP by sequentially rapid advancing and retreat of the sea ice, which can be a vehicle for transporting IRD, normally of fine-grained material (Dowdeswell Citation2009). Although the surface conditions indicate warm AW inflow, the deep environment is still characterized by bottom cold-water masses, indicated by the presence of the benthic foraminifera E. clavatum, whereas the presence of C. wuellerstorfi indicates vigorous bottom currents (e.g., Wollenburg and Mackensen Citation1998; Polyak et al. Citation2002; Rebesco et al. Citation2013).
According to the reconstructed environmental conditions and the age model, this interval was related to the warm climatic phase called the Roman Warm Period (Lamb Citation1977), characterized by an enhanced input of the warm AW as observed on the Storfjorden trough mouth fan (Zamelczyk et al. Citation2020) and in the northern (Jernas et al. Citation2013) and northwestern (Bonnet, De Vernal, and Hillaire-Marcel Citation2010; Werner et al. Citation2011) areas of Spitsbergen. In the latter case, the abundance of fine-grained detritus, the increase of IP25, and other phytoplankton markers were interpreted by Müller et al. (Citation2012) as evidence of the intensification of the sea-ice coverage, whereas Bonnet, De Vernal, and Hillaire-Marcel (Citation2010), working in the same area on dinocyst assemblages, indicated warm sea surface temperatures (SSTs) with seasonal sea ice and low-salinity surface waters. Both statements, however, can fit our interpretation that envisages an enhanced sea-ice distribution as feedback to the intensification of the warm AW inflow promoting ice melting with generation of a surface layer of freshwater, in turn, forcing new sea-ice formation. It is furthermore argued that the strengthening of the AW inflow during this time may have caused a northward shift of the polar front, promoting the development of sea ice northward.
Time interval: 1,600–1,300 years BP
The older part of this period (1,600–1,500 years BP) is characterized by sediments that are almost diatom free, suggesting unfavorable conditions for their development or preservation. The presence of diatoms in the water column depends on several environmental characteristics, including (a) the availability of silicate in the water with a percentage greater than 2 μmol/L (Egge and Aksnes Citation1992), (b) the sea-ice conditions (Horner Citation1985), (c) the stability of water surface temperature (Leventer Citation1991), (d) the availability of nutrients (Fitzwater et al. Citation1996), (e) the variability of salinity associated with freshwater input from the mainland (Licursi, Sierra, and Gomez Citation2006), (f) the availability of sunlight needed for the photosynthesis, and (g) the biogenic silica dissolution/preservation during settling in the water column.
We think that a combination of the above processes may have been responsible for the absence of diatoms in the sediments. The relative increase of the continentally derived clay minerals (mainly chlorite but also illite and kaolinite) and the marked decrease of smectite suggest a reduced inflow of the warm AW pointing to a cold environment. Evidence of colder conditions between 1,600 and 1,500 years BP is reflected by the relatively low values of Ca/Ti and of Si/Al, which suggest low biogenic carbonate and biosiliceous productivity. The relatively high Si/Ti ratio until 1,500 years BP can be associated with continuous continental and/or sea-ice terrigenous supply to the environment that may have obscured the surface water masses, reducing the sunlight penetration, in turn impacting phytoplankton productivity. A change in the diatom productivity/preservation was observed starting from 1,500 years BP, with a progressive increase of warmwater diatom species C. marginatus and C. radiatus, suggesting a transition to warmer climate conditions with a renewed intensification of the warm AW advection (). Furthermore, the presence of sea-ice diatoms F. cylindrus and F. oceanica together with the cold-water affinity species T. antarctica, R. hebetata, and CRS can be associated with surface cold water and stratified ArW (Kemp et al. Citation2000; Oksman et al. Citation2019). The co-presence of arctic planktic foraminifera N. pachyderma supports the indication of cold and stratified surface water. Therefore, we argue that the intensification of AW promoted the melting of both sea ice and glaciers in the fjords. This interpretation is supported by the appearance of Aulacoseira spp. in the diatom assemblage, which typically live in continental freshwater basins (rivers and lakes, e.g., M. L. Garcia et al. Citation2019). The increase of the benthic foraminifera C. reniforme suggests the presence of cold water at the sea bottom. The increase of E. exigua together with the reduction of O. tener indicates an increase of organic flux to the sea floor, due to enhanced productivity, which is also supported by the increase of ADA. According to the discussed data, the time interval between 1,600 and 1,300 years BP appears as a transitional time that is initially characterized by relatively cold conditions (1,600–1,500 years BP) followed by a progressive intensification of the AW inflow. The renewed warm inflow since 1,500 years BP initially impacts on the environment through ice melting and formation of a surface cold-water layer. This time interval was associated with the Dark Ages Cold Period (Lamb Citation1977) observed also by other authors along the western Spitsbergen margin and Barents Sea (Werner et al. Citation2011; Müller et al. Citation2012; Jernas et al. Citation2013; Berben et al. Citation2014; Cabedo-Sanz and Belt Citation2016; Zamelczyk et al. Citation2020).
Similar to our observations made for the time interval 1,600 to 1,500 years BP, Werner et al. (Citation2011) recorded a cooling period characterized by a generally low productivity, a marked increase of the planktic foraminifera N. pachyderma, and associated cooling of SST estimated through the planktic foraminiferal assemblage. Jernas et al. (Citation2013) inferred from the benthic foraminifera association a cooling period starting at about 1,700 years BP in the Kongsfjorden and Hiplopen (northwewst Spitsbergen), which the authors related to both a reduced influence of AW inflow and increased of cold ArW input. In contrast, in northwest Spitsbergen, Bonnet, De Vernal, and Hillaire-Marcel (Citation2010) observed relatively warm SST and sea ice–free conditions related with a stronger AW inflow causing the northward shift of the Arctic front at about 1,450 years BP.
Time interval: 1,300–700 years BP
This interval is clearly marked by the increase of warm planktic and benthic species. Although the planktic foraminiferal assemblage is still dominated by the arctic species N. pachyderma, the consistent appearance of the subpolar species T. quinqueloba denotes the presence of warmer conditions with respect to the previous interval that were related to a stronger advection of warm AW (e.g., Volkmann Citation2000). Indeed, since ca. 1,200 years BP, the increase in the Ca/Ti ratio supports the evidence of a stronger warmwater inflow favorable for carbonate productivity and/or preservation. The dominance of the diatom warm water species C. marginatus, C. radiatus, and P. sulcata supports this interpretation. However, the co-presence of cryophilic forms such as A. curvatulus, F. cylindrus, and B. bathyomphala, together with the occurrence of the CRS, suggests a relative proximity to the sea-ice margin with the presence of surface-stratified water. The high percentage of the cold-water species T. antarctica in the diatom assemblage confirms such a hypothesis because it is commonly related to the presence of cold ArW. The decrease of the benthic foraminifera C. reniforme and E. clavatum and the increase of C. wuellerstorfi indicate warm deepwater masses, likely due to strong influx of AW, as also shown by the general increase of the smectite content.
The presented data indicate that warmer environmental conditions during this period occurred in both bottom and surface water masses. According to the age model (1,300–700 years BP), we related this warm interval to the MWP (Lamb Citation1977), commonly characterized by warm surface conditions along the western and northern margins of Spitsbergen (Werner et al. Citation2011; Jernas et al. Citation2013; Zamelczyk et al. Citation2020), with reduced sea-ice cover (Müller et al. Citation2012), or with the presence of seasonal sea ice (Bonnet, De Vernal, and Hillaire-Marcel Citation2010; Cabedo-Sanz and Belt Citation2016).
The sediment record of the MWP in the studied core contains sparse <1-cm clasts, indicating that diffuse glaciers and iceberg melting occurred as feedback to the increased inflow of the warm AW. In particular, the presence of a solitary 3-cm-diameter pebble at ca. 1,000 years BP indicates IRD input from melting iceberg rather than other transport mechanisms (e.g., Moran et al. Citation2006; St. John Citation2008; Stickley et al. Citation2009). The sediments enclosing the large clast do not record depositional disturbance or structures that could be associated with gravity flow processes. Instead, the sediments record a consistent presence of the diatom Aulacoseira spp., commonly blooming in continental freshwater such as rivers and lakes. The documented strong advection of warm AW could force the melting of Svalbard tidewater glaciers, causing a consistent meltwater runoff, promoting the spread of the Aulacoseira spp. in the marine environment.
Time interval: 700–670 years BP
In the upper part of our record, at ca. 700 years BP, we recorded an abrupt increase in cold-water indicators. The increase of the sea-ice diatom species F. oceanica and A. curvatulus together with cold-water indicators such as R. hebetata and T. antarctica suggest a pronounced decline in the AW inflow, which is also supported by the reduction of the warm water diatom species C. marginatus and C. radiatus. In addition, the planktic foraminifera record is characterized by an abrupt increase of the cold-water species N. pachyderma and a decrease of the warmwater species T. quinqueloba and G. bulloides, pointing to cooling surface and subsurface water. This youngest interval is also marked by the maximum value of ADA, indicating an increase in primary productivity that was related to the presence of seasonal sea ice with periodic release of nutrients promoting the diatom bloom. According to the age model, we relate this period with the beginning of the Little Ice Age.
Conclusion
The integrated micropaleontological (diatoms, nannofossils, planktic and benthic foraminifera) and sedimentological approach (X-ray, XRF, clay mineral) to the study of a sediment core from the Bellsund Drift provided new paleoenvironmental insights on the last two millennia.
We identified two warm periods (2,000–1,600 years BP and 1,300–600 years BP) corresponding to the RWP and the MWP, respectively, alternating with two cold periods (1,600–1,300 years BP; 700–670 years BP) corresponding to the Dark Ages and the beginning of the Little Ice Age, respectively.
During the RWP, the coexistence of warmwater planktic species together with cold and/or stratified water indicators was related to the enhanced sea-ice distribution as feedback to the intensification of the warm AW inflow. The warmwater promoted ice melting and contributed to creating a surface layer of freshwater, in turn forcing new sea-ice formation. RWP is followed by a transitional time (Dark Ages, 1,600–1,500 years BP) characterized by the absence of diatoms and high terrigenous supply. During the MWP, warmer surface conditions (with respect to the RWP) occurred and warmwater masses influenced the sea bottom. A large ice-rafted clast and the consistent presence of Aulacoseira spp. were interpreted as evidence for increased glacier decay. Since 700 years BP, the abrupt increase of diatom sea-ice species and cold-water species, together with the high abundance of N. pachyderma, was related to colder environmental conditions with the presence of sea ice.
Acknowledgments
The authors thank Eurofleets2 for ten days’ ship time on the R/V G.O. Sars, equipped with the Calypso piston corer. We thank Captain John Hugo Johnson, the officers, and crew of Expedition 191 and the technicians Martin Dahl, Ingve Fjelstad, Dag Inge Blindheim, and Åse Sudman for strong support during the acquisition activities. The authors thank Dr. I. Polovodova Asteman and an anonymous reviewer for advice. The authors also thank Editor Anne E. Jennings for the revision that improved the quality of this article.
Disclosure statement
No potential conflict of interest was reported by the authors.
Funding
The authors thank Eurofleets2 for giving to the project PREPARED (Grant Agreement No. 312762) ten days’ ship time on the R/V G.O. Sars, equipped with the Calypso piston corer. The sedimentological analyses were funded by the Italian projects PNRA‐CORIBARIT (PdR 2013/C2.01) and Premiale ARCA (grant n.25_11_2013_973); and by the Spanish project DEGLABAR (CTM2010‐17386) funded by the “Ministerio de Economia y Competitividad”. The authors also thank AAAR for the publication Grant No. UAAR-2022-C6073 for the present special issue.
References
- Aagaard, K., A. Foldvik, and S. R. Hillman. 1987. The west Spitsbergen current: Disposition and water mass transformation. Journal of Geophysical Research Oceans 92 (C4):3778–84. doi:10.1029/JC092iC04p03778.
- Agnihotri, R., M. A. Altabet, T. D. Herbert, and J. E. Tierney. 2008. Subdecadally resolved paleoceanography of the Peru margin during the last two millennia. Geochemistry Geophysics Geosystem 9 (5):Q05013. doi:10.1029/2007GC001744.
- Andersen, C., N. Koç, and M. Moros. 2004. A highly unstable Holocene climate in the subpolar North Atlantic: Evidence from diatoms. Quaternary Science Review 23 (20–22):2155–66. doi:10.1016/j.quascirev.2004.08.004.
- Andruleit, H. A., and K. H. Baumann. 1998. History of the Last Deglaciation and Holocene in the Nordic seas as revealed by coccolithophore assemblages. Marine Micropaleontology 35 (3–4):179–201. doi:10.1016/S0377-8398(98)00021-8.
- Armand, L. K., X. Crosta, O. Romero, and J. J. Pichard. 2005. The biogeography of major diatom taxa in Southern Ocean sediments: 1. Palaeogeography, Palaeoclimatology, Palaeoecology 223 (1–2):93–126. doi:10.1016/j.palaeo.2005.02.015.
- Backman, J., and N. J. Shackleton. 1983. Quantitative biochronology of Pliocene and early Pleistocene calcareous nannofossils from the Atlantic, Indian and Pacific Oceans. Marine Micropaleontology 8 (2):141–70. doi:10.1016/0377-8398(83)90009-9.
- Barron, J. A., D. Bukry, W. E. Dean, J. A. Addison, and B. Finney. 2009. Paleoceanography of the Gulf of Alaska during the past 14,000 years: Results from diatoms, silicoflagellates and geochemistry. Marine Micropaleontology 72 (3–4):176–95. doi:10.1016/j.marmicro.2009.04.006.
- Barzycka, B., M. Grabiec, M. Błaszczyk, D. Ignatiuk, M. Laska, J. O. Hagen, and J. Jania. 2020. Changes of glacier facies on Hornsund glaciers (Svalbard) during the decade 2007–2017. Remote Sensing of Environment 251:112060. doi:10.1016/j.rse.2020.112060.
- Bensi, M., V. Kovačević, L. Langone, S. Aliani, L. Ursella, I. Goszczko, T. Soltwedel, R. Skogseth, F. Nilsen, D. Deponte et al. 2019. Deep flow variability offshore South-West Svalbard (Fram Strait). Water 11 (4):683. doi:10.3390/w11040683.
- Berben, S. M. P., K. Husum, P. Cabedo-Sanz, and S. T. Belt. 2014. Holocene sub-centennial evolution of Atlantic water inflow and sea ice distribution in the western Barents Sea. Climate of Past 10 (1):181–98. doi:10.5194/cp-10-181-2014.
- Berben, S. M. P., K. Husum, A. Navarro-Rodriguez, S. T. Belt, and S. Aagard-Sørensen. 2017. Semi-quantitative reconstruction of early to late Holocene spring and summer sea ice conditions in the northern Barents Sea. Journal of Quaternary Science 32 (5):587–603. doi:10.1002/jqs.2953.
- Berner, H., and G. Wefer. 1994. Clay mineral flux in the Fram Strait and Norwegian Sea. Marine Geology 116 (3–4):327–45. doi:10.1016/0025-3227(94)90049-3.
- Beszczynska-Möller, A., E. Fahrbach, U. Schauer, and E. Hansen. 2012. Variability in Atlantic water temperature and transport at the entrance to the Arctic Ocean, 1997–2010. ICES Journal of Marine Science 69 (5):852–63. doi:10.1093/icesjms/fss056.
- Biscaye, P. E. 1965. Mineralogy and sedimentation of recent deep-sea clay in the Atlantic Ocean and Adjacent Seas and Oceans. Geological Society of America Bulletin 76 (7):803–32. doi:10.1130/0016-7606(1965)76[803:MASORD]2.0.CO;2.
- Bonnet, S., A. De Vernal, and C. Hillaire-Marcel. 2010. Variability of sea-surface temperature and sea-ice cover in the Fram Strait over the last two millennia. Marine Micropaleontology 74 (3–4):59–74. doi:10.1016/j.marmicro.2009.12.001.
- Bown, P. R., and J. R. Young. 1998. Techniques. In Calcareous Nannofossil Biostratigraphy (British Micropalaeontological society publications series), ed. P. R. Brown, 132–99. London: Chapman and Kluwer Academic.
- Cabedo-Sanz, P., and S. T. Belt. 2016. Seasonal sea ice variability in eastern Fram Strait over the last 2000 years. Arktos 2 (1):22. doi:10.1007/s41063-016-0023-2.
- Cage, A. G., and W. E. N. Austin. 2010. Marine climate variability during the last millennium: The Loch Sunart record, Scotland, UK. Quaternary Science Reviews 29 (13–14):1633–47. doi:10.1016/j.quascirev.2010.01.014.
- Cage, A. G., A. J. Pieńkowski, A. Jennings, K. L. Knudsen, and M. S. Seidenkrantz. 2021. Comparative analysis of six common foraminiferal species of the genera Cassidulina, Paracassidulina, and Islandiella from the Arctic–North Atlantic domain. Journal of Micropalaeontology 40 (1):37–60. doi:10.5194/jm-40-37-2021.
- Carbonara, K., K. Mezgec, G. Varagona, M. E. Musco, R. G. Lucchi, G. Villa, C. Morigi, R. Melis, and M. Caffau. 2016. Palaeoclimatic changes in Kveithola, Svalbard, during the Late Pleistocene deglaciation and Holocene: Evidences from microfossil and sedimentary records. Palaeogeography, Palaeoclimatology, Palaeoecology 463:136–49. doi:10.1016/j.palaeo.2016.10.003.
- Caricchi, C., S. A. Campuzano, L. Sagnotti, P. Macrì, and R. G. Lucchi. 2022. Reconstruction of the Virtual Geomagnetic Pole (VGP) path at high latitude for the last 22 kyr: The role of radial field flux patches as VGP attractor. Earth and Planetary Science Letters 595:117762. doi:10.1016/j.epsl.2022.117762.
- Caricchi, C., R. G. Lucchi, L. Sagnotti, P. Macrì, A. Di Roberto, P. Del Carlo, K. Husum, J. S. Laberg, and C. Morigi. 2019. A high-resolution geomagnetic relative paleointensity record from the Arctic Ocean deep-water gateway deposits during the last 60 kyr. Geochemistry Geophysical Geosystem 20:2355–77.
- Caricchi, C., R. G. Lucchi, L. Sagnotti, P. Macrì, C. Morigi, R. Melis, M. Caffau, M. Rebesco, and T. J. J. Hanebuth. 2018. Paleomagnetism and rock magnetism from sediments along a continental shelf-to-slope transect in the NW Barents Sea: Implications for geomagnetic and depositional changes during the past 15 thousand years. Global and Planetary Change 160:10–27. doi:10.1016/j.gloplacha.2017.11.007.
- Caricchi, C., L. Sagnotti, S. A. Campuzano, R. G. Lucchi, P. Macrì, M. Rebesco, and A. Camerlenghi. 2020. A refined age calibrated paleosecular variation and relative paleointensity stack for the NW Barents Sea: Implication for geomagnetic field behavior during the Holocene. Quaternary Science Review 229:106–33. doi:10.1016/j.quascirev.2019.106133.
- Carstens, J., D. Hebbeln, and G. Wefer. 1997. Distribution of planktic foraminifera at the ice margin in the Arctic (Fram Strait). Marine Micropaleontology 29 (3–4):257–69. doi:10.1016/S0377-8398(96)00014-X.
- Chamley, H. 1989. Clay sedimentology, 623. Berlin: Springer.
- Cohen, J., J. Screen, J. Furtado, M. Barlow, D. Whittleston, D. Coumou, J. Francis, K. Dethloff, D. Entekhabi, J. Overland et al. 2014. Recent Arctic amplification and extreme mid-latitude weather. Nature Geoscience 7 (9):627–37. doi:10.1038/ngeo2234.
- Colmenero-Hidalgo, E., J. A. Flores, and F. J. Sierro. 2002. Biometry of Emiliania huxleyi and its biostratigraphic significance in the Eastern North Atlantic Ocean and Western Mediterranean Sea in the last 20,000 years. Marine Micropaleontology 46 (3–4):247–63. doi:10.1016/S0377-8398(02)00065-8.
- Crosta, X., and N. Koç. 2007. Diatoms: From micropaleontology to isotope geochemistry. In Proxies in late Cenozoic paleoceanography developments in marine geology series 1, ed. B. C. Hilare-Marcel and A. de Vernal, 327–69. Amsterdam: Elsevier.
- Croudace, I. W., and R. G. Rothwell. eds. 2015. Micro-XRF studies of sediment cores: Application of a non-destructive tool for the environmental sciences, 656 p. Developments in Paleoenvironmental Research, 17, Springer.
- Cunningham, L. K., W. E. N. Austin, K. L. Knudsen, J. Eiríksson, J. D. Scourse, J. A. D. Wanamaker, P. G. Butler, A. G. Cage, T. Richter, K. Husum et al. 2013. Reconstructions of surface ocean conditions from the northeast Atlantic and Nordic seas during the last millennium. The Holocene 23 (7):921–35. doi:10.1177/0959683613479677.
- Damiani, D., G. Giorgetti, and I. Memmi Turbanti. 2006. Clay mineral fluctuations and surface textural analysis of quartz grain in Pliocene-Quaternary marine sediments from Wilkes Land continental rise (East-Antarctica): Paleoenvironmental significance. Marine Geology 226 (3–4):281–95. doi:10.1016/j.margeo.2005.11.002.
- Darling, K. F., M. Kucera, D. Kroon, and C. M. Wade. 2006. A resolution for the coiling direction paradox in Neogloboquadrina pachyderma. Paleoceanography 21 (2):2011. doi:10.1029/2005PA001189.
- Darling, K. F., M. Schweizer, K. L. Knudsen, K. M. Evans, C. Bird, A. Roberts, H. L. Filipsson, J. H. Kim, G. Gudmundsson, C. M. Wade et al. 2016. The genetic diversity, phylogeography and morphology of Elphidiidae (Foraminifera) in the Northeast Atlantic. Marine Micropaleontology 129:1–23. doi:10.1016/j.marmicro.2016.09.001.
- Dickson, A. J., M. J. Leng, M. A. Maslin, and U. Röhl. 2010. Oceanic, atmospheric and ice-sheet forcing of South East Atlantic Ocean productivity and South African monsoon intensity during MIS-12 to 10. Quaternary Science Review 29 (27–28):3936–47. doi:10.1016/j.quascirev.2010.09.014.
- Diekmann, B., J. Hofmann, R. Henrich, D. K. Fütterer, U. Röhl, and K. Y. Wei. 2008. Detrital sediment supply in the southern Okinawa Trough and its relation to sea level and Kuroshio dynamics during the late Quaternary. Marine Geology 255 (1–2):83–95. doi:10.1016/j.margeo.2008.08.001.
- Dowdeswell, J. A. 2009. Ice-Rafted Debris (IRD). In Encyclopedia of paleoclimatology and ancient environments. Encyclopedia of earth sciences series, ed. V. Gornitz, 471–73. Dordrecht: Springer.
- Easterbrook, D. J. ed. 2016. Temperature fluctuations in Greenland and the Arctic. In Evidence-based Climate Science, 137–60. 2nd ed. Elsevier.
- Egge, J. K., and D. L. Aksnes. 1992. Silicate as regulating nutrients in phytoplankton competition. Marine Ecology Progress Series 83:281–89. doi:10.3354/meps083281.
- Eiríksson, J., H. B. Bartels-Jónsdóttir, A. G. Cage, E. R. Gudmundsdóttir, D. Klitgaard-Kristensen, F. Marret, T. Rodrigues, F. Abrantes, W. E. N. Austin, H. Kiang et al. 2006. Variability of the North Atlantic Current during the last 2000 years based on shelf bottom water and sea surface temperatures along an open ocean/shallow marine transect in Western Europe. The Holocene 16 (7):1017–29. doi:10.1177/0959683606hl991rp.
- El Bani Altuna, N., A. J. Pieńkowski, F. Eynaud, and R. Thiessen. 2018. The morphotypes of Neogloboquadrina pachyderma: Isotopic signature and distribution patterns in the Canadian Arctic Archipelago and adjacent regions. Marine Micropaleontology 142:3–24. doi:10.1016/j.marmicro.2018.05.004.
- Ellingsen, I., P. Dalpadado, D. Slagstad, and H. Loeng. 2008. Impact of climatic change on the biological production in the Barents Sea. Climate Change 87 (1–2):155–75. doi:10.1007/s10584-007-9369-6.
- Ellis, B. E., and A. R. Messina. 1940–1978. Catalogue of foraminifera. Flushing, New York: Micropaleontology Press.
- Elverhøi, A., S. L. Pfirman, A. Solheim, and B. B. Larssen. 1989. Glaciomarine sedimentation in epicontinental seas exemplified by the Northern Barents Sea. Marine Geology 85 (2–4):255–250. doi:10.1016/0025-3227(89)90155-2.
- Elvevold, S., W. Dallmann, and D. Blomeier. 2007. Geology of Svalbard, vol. 35. Tromsø: Norske Institute.
- Fagel, N., C. Robert, M. Preda, and J. Thorez. 2001. Smectite composition as a tracer of deep circulation: The case of the Northern Atlantic. Marine Geology 172 (3–4):309–30. doi:10.1016/S0025-3227(00)00123-7.
- Faust, J. C., K. Fabian, G. Milzer, J. Giraudeau, and J. Knies. 2016. Norwegian fjord sediments reveal NAO related winter temperature and precipitation change of the past 2800 years. Earth and Planetary Science Letters 435:84–93. doi:10.1016/j.epsl.2015.12.003.
- Feyling-Hanssen, R. W., J. A. Jørgensen, K. L. Knudsen, and A. L. Lykke-Andersen. 1971. Late Quaternary foraminifera from Vendsyssel, Denmark and Sandnes. Norway Geological Society Denmark 21:67–317.
- Fitzwater, S. E., K. H. Coale, R. M. Gordon, K. H. Johnson, and M. E. Ondrusek. 1996. Iron deficiency and phytoplankton growth in the equatorial Pacific. Deep Sea Research II 43 (4–6):995–1015. doi:10.1016/0967-0645(96)00033-1.
- Francis, J. A., and S. J. Vavrus. 2012. Evidence linking Arctic amplification to extreme weathering mid-latitudes. Geophysical Research Letter 39 (6):L06801. doi:10.1029/2012GL051000.
- Gabel, B. 1971. Die Foraminiferen der Nord See. Helgoländer wissenschaftliche Meeresuntersuchungen 22 (1):1–65. doi:10.1007/BF01611364.
- Gamboa Sojo, V. M., K. Husum, F. Caridi, R. G. Lucchi, M. Bensi, V. Kovacevic, A. Sabbatini, L. Langone, A. Dominiczak, P. Povea et al. 2021. Living and dead foraminiferal assemblages of the last decades from Kveithola Trough: Taphonomic processes and ecological highlights. Marine Micropaleontology 166:102014. doi:10.1016/j.marmicro.2021.102014.
- Garcia, H. E., T. P. Boyer, O. K. Baranova, R. A. Locarnini, A. V. Mishonov, R. Grodsky, C. R. Paver, K. W. Weathers, I. V. Smolyar, J. R. Reagan et al. 2019. WorldOcean Atlas 2018: Product documentation. A. Mishonov, Technical Editor.
- Garcia, M. L., E. A. Morale, J. M. Guerrero, P. I. Tremarini, and N. I. Maidana. 2019. New Aulacoseira species (Bacillariophyta) from the Argentinean Patagonia and re-examination of type material of Melosira perpusilla Frequenlli. Phytotaxa 408 (3):161–77. doi:10.11646/phytotaxa.408.3.2.
- Gooday, A. J. 1993. Deep-sea benthic foraminiferal species which exploit phytodetritus: Characteristic features and controls on distribution. Marine Micropaleontology 22 (3):187–205. doi:10.1016/0377-8398(93)90043-W.
- Greco, M., L. Jonkers, K. Kretschmer, J. Bijma, and M. Kucera. 2019. Depth habitat of the planktonic foraminifera Neogloboquadrina pachyderma in the northern high latitudes explained by sea-ice and chlorophyll concentrations. Biogeosciences 16 (17):3425–37. doi:10.5194/bg-16-3425-2019.
- Griffin, J. J., H. Windom, and E. D. Goldberg. 1968. The distribution of clay minerals in the World Ocean. Deep-Sea Research 15 (4):433–59.
- Grobe, H. 1987. A simple method for the determination of ice-rafted debris in sediment cores. Polarforschung 57:123–26.
- Halbach, L., M. Vihtakari, P. Duarte, A. Everett, M. A. Granskog, H. Hop, H. M. Kauko, S. Kristiansen, P. I. Myhre, A. K. Pavlov et al. 2019. Tidewater glaciers and bedrock characteristics control the phytoplankton growth environment in a Fjord in the Arctic. Frontiers in Marine Science 6:00254. doi:10.3389/fmars.2019.00254.
- Hald, M., and S. Korsun. 1997. Distribution of modern benthic foraminifera from fjords of Svalbard, European Arctic. Journal of Foraminifera Research 27 (2):101–22. doi:10.2113/gsjfr.27.2.101.
- Hasle, G. R., and E. E. Syvertsen. 1997. Marine Diatoms. In Identifying Marine Phytoplankton, ed. C. R. Tomas, 5–386. San Diego: Academic Press.
- Hjelle, A. 1993. Geology of Svalbard. Polarhåndbook, vol. 7, 162. Oslo: Norsk Polarrinstitute.
- Hoff, U., T. L. Rasmussen, R. M. Stein, M. Ezat, and K. Fahl. 2016. Sea ice and millennial-scale climate variability in the Nordic seas 90 ka to present. Nature Communication 7 (1):12247. doi:10.1038/ncomms12247.
- Holbourn, A., A. S. Henderson, and N. MacLeod. 2013. Atlas of Benthic Foraminifera, 656. New York: John Wiley & Sons.
- Horner, R. A. 1985. Ecology of sea ice microalgae. In Sea ice biota, ed. R. H. Horner, 83–104. Boca Raton, FL: CRC Press.
- Howat, I. M., I. R. Joughin, M. Fahnestock, B. E. Smith, and T. A. Scambos. 2008. Synchronous retreat and acceleration of southeast Greenland outlet glaciers 2000e06: Ice dynamics and coupling to climate. Journal of Glaciology 54 (187):646–60. doi:10.3189/002214308786570908.
- Howat, I. M., I. R. Joughin, and T. A. Scambos. 2007. Rapid changes in ice discharge from Greenland outlet glaciers. Science 315 (5818):1559–61. doi:10.1126/science.1138478.
- Huntington, H. P., M. Boyle, G. E. Flowers, J. W. Weatherly, L. C. Hamilton, L. Hinzam, C. Gerlach, R. Zulueta, C. Nicolson, and J. Overpeck. 2007. The influence of human activity in the Arctic on climate and climate impacts. Climatic Change 82 (1–2):77–92. doi:10.1007/s10584-006-9162-y.
- Jennings, A. E., J. Andrews, B. Reilly, M. Walczak, M. Jakobsson, A. Mix, J. Stoner, K. W. Nicholls, and M. Cheseby. 2020. Modern foraminiferal assemblages in northern Nares Strait, Petermann Fjord, and beneath Petermann ice tongue, NW Greenland. Arctic, Antarctic, and Alpine Research 52 (1):491–511. doi:10.1080/15230430.2020.1806986.
- Jennings, A. E., N. J. Weiner, G. Helgadottir, and J. T. Andrews. 2004. Modern Foraminiferal faunas of the southwestern to northern Iceland shelf: Oceanographic and environmental controls. Journal of Foraminiferal Research 34 (3):180–207. doi:10.2113/34.3.180.
- Jernas, P., D. K. Kristensen, K. Husum, L. Wilson, and N. Koç. 2013. Palaeoenvironmental changes of the last two millennia on the western and northern Svalbard shelf. Boreas 42 (1):236–55. doi:10.1111/j.1502-3885.2012.00293.x.
- Jiang, H., M.-S. Seidenkrantz, K. L. Knudsen, and J. Eiriksson. 2002. Late‐Holocene summer sea‐surface temperatures based on a diatom record from the north Icelandic shelf. Holocene 12:137–47.
- Junttila, J., S. Aagaard-Sørensen, K. Husum, and M. Hald. 2010. Late Glacial-Holocene clay minerals elucidating glacial history in the SW Barents Sea. Marine Geology 276 (1–4):71–85. doi:10.1016/j.margeo.2010.07.009.
- Kemp, A. E. S., J. Pike, R. B. Pearce, and C. B. Lange. 2000. The “Fall dump”—A new perspective on the role of a “shade flora” in the annual cycle of diatom production and export flux. Deep Sea Research II 47 (9–11):181–98. doi:10.1016/S0967-0645(00)00019-9.
- Knudsen, K. L. 1998. Foraminifera in Quaternary stratigraphy: Laboratory and preparation techniques as well as selected examples. Geologisk Tidsskrift 3:1–25.
- Koç-Karpuz, N., and H. Schrader. 1990. Surface sediment diatom distribution and Holocene paleotemperature variations in the Greenland, Iceland and Norwegian Sea. Paleoceanography 5:557–80. doi:10.1029/PA005i004p00557.
- Korsun, S., and M. Hald. 1998. Modern benthic foraminifera off Novaya Zemlya tidewater glaciers, Russian Arctic. Arctic Alpine Research 30 (1):61–77. doi:10.2307/1551746.
- Korsun, S., and M. Hald. 2000. Seasonal dynamics of benthic foraminifera in a glacially fed fjord of Svalbard European Arctic. Journal of Foraminifera Research 30 (4):59–74. doi:10.2113/0300251.
- Kuhlemann, J., H. Lange, and H. Paetsch. 1993. Implication of a connection between clay mineral variations and coarse grain debris and lithology in the central Norwegian-Greenland Sea. Marine Geology 114 (1–2):1–11. doi:10.1016/0025-3227(93)90036-U.
- Lamb, H. H. 1977. Climate: Present, past and future. Vol. 2. Climatic history and the future, 835. Methuen, London: H. Lamb. Barnes and Noble, New York.
- Leventer, A. 1991. Sediment trap diatom assemblages from the northern Antarctic Peninsula region. Deep Sea Research 38 (8–9):1127–43. doi:10.1016/0198-0149(91)90099-2.
- Leventer, A., E. W. Domack, S. E. Ishman, S. Brachfeld, C. E. McClennen, and P. Manley. 1996. Productivity cycles of 200–300 years in the Antarctic Peninsula region: Understanding linkages among the sun, atmosphere, oceans, sea ice, and biota. Geological Society of America Bulletin 108 (12):1626–44. doi:10.1130/0016-7606(1996)108<1626:PCOYIT>2.3.CO;2.
- Licursi, M., M. V. Sierra, and N. Gomez. 2006. Diatom assemblages from a turbid coastal plain estuary: Rio de la Plata (South America). Journal of Marine Systems 62 (1–2):35–45. doi:10.1016/j.jmarsys.2006.03.002.
- Loeblich, A. R., and H. Tappan. 1953. Studies of Arctic foraminifera. Smithsonian Miscellaneous Collections 121:1–150.
- Loeblich, A. R., and H. Tappan. 1987. Foraminiferal genera and their classification, 970. New York: Van Nostrand Reinhold Company.
- Loeblich, A. R., and H. Tappan. 2015. Foraminiferal genera and their classification, 2031. Berlin: Springer.
- Lucchi, R. G., A. Camerlenghi, M. Rebesco, E. Colmenero-Hidalgo, F. J. Sierro, L. Sagnotti, U. Urgeles, R. Melis, C. Morigi, M. A. Barcena et al. 2013. Postglacial sedimentary processes on the Storfjorden and Kveithola trough mouth fans: Significance of extreme glacimarine sedimentation. Global and Planetary Change 111:309–26. doi:10.1016/j.gloplacha.2013.10.008.
- Lucchi, R. G., V. Kovacevic, S. Aliani, A. Caburlotto, M. Celussi, L. Corgnati, S. Cosoli, D. Deponte, E. A. Ersdal, S. Fredriksson et al. 2014. PREPARED: Present and past flow regime on contourite drifts west of Spitsbergen. EUROFLEETS-2 cruise summary report. R/V G.O. Sars Cruise No. 191, 05/06/2014 – 15/06/2014, Tromsø – Tromsø (Norway), 89.
- Lucchi, R. G., L. Sagnotti, A. Camerlenghi, P. Macrì, M. Rebesco, M. T. Pedrosa, and G. Giorgetti. 2015. Marine sedimentary record of meltwater Pulse 1a along the NW Barents Sea continental margin. Arktos 1:7.
- Mackensen, A., H. P. Sejrup, and E. Jansen. 1985. The distribution of living benthic foraminifera on the continental slope and rise off Southwest Norway. Marine Micropaleontology 9 (4):275–306. doi:10.1016/0377-8398(85)90001-5.
- Majewski, W., W. Szczuciński, and M. Zajączkowski. 2009. Interactions of Arctic and Atlantic water-masses and associated environmental changes during the last millennium, Hornsund (SW Svalbard). Boreas 38 (3):529–44. doi:10.1111/j.1502-3885.2009.00091.x.
- Marsh, R., R. A. Mills, D. R. H. Green, I. Salter, and S. Taylor. 2007. Controls on sediment geochemistry in the Crozet region. Deep Sea Research Part II 54 (18–20):2260–74. doi:10.1016/j.dsr2.2007.06.004.
- Matul, A., F. R. Spielhagen, G. Kazarina, S. Kruglikova, O. Dmitrenko, and R. Mohan. 2018. Warm-water events in the eastern Fram Strait during the last 2000 years as revealed by different microfossil groups. Polar Research 37 (1):1540243. doi:10.1080/17518369.2018.1540243.
- McIntyre, A., and A. W. H. Bé. 1967. Modern coccolithophoridae of the Atlantic Ocean—I. Placoliths and cyrtoliths. Deep Sea Research Oceanography 14 (5):225–50. doi:10.1016/0011-7471(67)90065-4.
- Melis, R., K. Carbonara, G. Villa, C. Morigi, M. A. Barcena, G. Giorgetti, A. Caburlotto, M. Rebesco, and R. G. Lucchi. 2018. A new multi-proxy investigation of Late Quaternary paleoenvironments along the north-western Barents Sea (Storfjorden Trough Mouth Fan). Journal of Quaternary Science 33 (6):662–76. doi:10.1002/jqs.3043.
- Moran, L., J. Backman, H. Brinkhuis, S. C. Clemens, T. Cronin, G. R. Dickens, F. Eynaud, J. Gattacceca, M. Jakobsson, R. W. Jordan et al. 2006. The Cenozoic paleoenvironment of the Arctic Ocean. Nature 441 (7093):601–05. doi:10.1038/nature04800.
- Moritz, R. E., C. M. Bitz, and E. J. Steig. 2002. Dynamics of recent climate change in the Arctic. Science 297 (5586):1497–502. doi:10.1126/science.1076522.
- Müller, J., K. Werner, R. Stein, K. Fahl, M. Moros, and E. Jansen. 2012. Holocene cooling culminates in sea-ice oscillations in Fram Strait. Quaternary Science Reviews 47:1–14. doi:10.1016/j.quascirev.2012.04.024.
- Nilsen, F., R. Skogseth, J. Vaardal-Lunde, and M. Inall. 2016. A simple shelf circulation model: Intrusion of Atlantic Water on the west Spitsbergen shelf. Journal of Physical Oceanography 46:1209–30. doi:10.1175/JPO-D-15-0058.1.
- Normand, S., T. T. Hoye, B. C. Forbes, J. J. Bowden, A. L. Davies, B. V. Odgaard, F. Riede, J. C. Svenning, U. A. Treier, R. Willerslev et al. 2017. Legacies of historical human activities in Arctic woody plant dynamics. Annual Review Environmental Resource 42 (1):541–67. doi:10.1146/annurev-environ-110615-085454.
- Obrewzkova, M. S., A. N. Kolesnik, and I. P. Semiletov. 2014. The diatom distribution in the surface sediments of the Eastern Arctic Seas of Russia. Paleoecology 40:465–72.
- Oksman, M., S. Junnin, A. Miettinen, A. Witkowski, and K. Weckström. 2019. The biogeography and ecology of common diatom species in the northern Nord Atlantic, and their implications for paleoceanographic reconstructions. Marine Geology 148:1–28.
- Olsen, J., N. J. Anderson, and M. F. Knudsen. 2012. Variability of the North Atlantic oscillation over the past 5,200 years. Nature Geoscience 5 (11):808–12. doi:10.1038/ngeo1589.
- Olsen, J., N. Anderson, and M. Leng. 2013. Limnological controls on stable isotope records of late-Holocene palaeoenvironmental change in SW Greenland: A paired lake study. Quaternary Science Review 66:85–95. doi:10.1016/j.quascirev.2012.10.043.
- Osterman, L. E., R. Z. Poore, and K. M. Foley. 1999. Distribution of benthic foraminifera (<125 microns) in the surface sediments of the Arctic Ocean. United States Geological Survey Bulletin 2164:1–28.
- Overland, J., E. Dunlea, J. E. Box, R. Corell, M. Forsius, V. Kattsov, M. S. Olsen, J. Pawlak, L.-O. Reiersen, and M. Wang. 2019. The urgency of Arctic change. Polar Science 21:6–13. doi:10.1016/j.polar.2018.11.008.
- PAGES 2k network Consortium. 2013. Continental-scale temperature variability during the past two millennia. Nature Geoscience 6 (5):339–46. doi:10.1038/ngeo1797.
- Pathirana, I., J. Knies, M. Felix, U. Mann, and I. Ellingsen. 2015. Middle to late Holocene paleoproductivity reconstructions for the western Barents Sea: A model-data comparison. Arktos 20:1–17.
- Pawłowska, J., M. Zajączkowski, M. Łącka, F. Lejzerowicz, P. Esling, and J. Pawłowski. 2016. Palaeoceanographic changes in Hornsund Fjord (Spitsbergen, Svalbard) over the last millennium: New insights from ancient DNA. Climate of the Past 12 (7):1459–72. doi:10.5194/cp-12-1459-2016.
- Pearce, C., K. Weckström, L. Sha, A. Miettinen, and M. S. Seidenkrantz. 2014. The Holocene marine diatom flora of Eastern Newfoundland bays. Diatom Research 29:441–54.
- Petschick, R. 2010. MacDiff version 4.2.6 user manual.
- Piva, A., A. Asioli, R. R. Schneider, F. Trincardi, N. Andersen, E. Colmenero-Hidalgo, B. Dennielou, J. A. Flores, and L. Vigliotti. 2008. Climatic cycles as expressed in sediments of the PROMESS1 borehole PRAD1-2, central Adriatic, for the last 370 ka: 1. Integrated Stratigraphy. Geochemistry, Geophysics, Geosystem 9:Q01R01.
- Polodova Asteman, I., H. L. Filipsson, and K. Nordberg. 2018. Tracing winter temperatures over the last two millennia using a north-east Atlantic Coastal record. Climate of Past 14 (7):2129–54. doi:10.5194/cp-14-1097-2018.
- Polyak, L., S. Korsun, L. A. Febo, V. Stanovoy, T. Khusid, M. Hald, B. E. Paulsen, and D. J. Lubinski. 2002. Benthic foraminiferal assemblages from the southern Kara Sea, a river influenced Arctic marine environment. Journal Foraminiferal Research 32 (3):252–73. doi:10.2113/32.3.252.
- Praetorius, S., M. Rugenstein, G. Persad, and K. Caldeira. 2018. Global and Arctic climate sensitivity enhanced by changes in North Pacific heat flux. Nature Communications 9 (1):3124. doi:10.1038/s41467-018-05337-8.
- Rahmstorf, S., J. Box, G. Feulner, G. Feulner, M. E. Mann, A. Robinson, S. Rutherford, and E. J. Schaffernicht. 2015. Exceptional twentieth-century slowdown in Atlantic Ocean overturning circulation. Nature Climate Change 5:475–80. doi:10.1038/nclimate2554.
- Rasmussen, E. S., C. Heilmann-Clausen, R. Waagstein, and T. Eidvin. 2008. The tertiary of the Norden. Episodes 31 (1):66–72. doi:10.18814/epiiugs/2008/v31i1/010.
- Rasmussen, T. L., E. Thomsen, S. R. Troelstra, A. Kuijpers, and M. Prins. 2003. Millennial scale glacial variability versus Holocene stability: Changes in planktic and benthic foraminiferal faunas and ocean circulation in the North Atlantic during the last 60,000 years. Marine Micropaleontology 47 (1–2):143–76. doi:10.1016/S0377-8398(02)00115-9.
- Rathburn, A. E., J. J. Pichon, M. A. Ayress, and P. De Deckker. 1997. Microfossil and stable-isotope evidence for changes in Late Holocene palaeoproductivity and palaeoceanographic conditions in the Prydz Bay region of Antarctica. Palaeogeography, Palaeoclimatology, Palaeoecology 131 (3–4):485–510. doi:10.1016/S0031-0182(97)00017-5.
- Rebesco, M., A. Wåhlin, J. S. Laberg, U. Schauer, A. Beszczynska-Möller, R. G. Lucchi, R. Noormets, D. Accettella, Y. Zarayskaya, and P. Diviacco. 2013. Quaternary contourite drifts of the western Spitsbergen margin. Deep Sea Research Part I 79:309–26. doi:10.1016/j.dsr.2013.05.013.
- Rio, D., I. Raffi, and G. Villa 1990. Pliocene-Pleistocene calcareous nannofossil distribution patterns in the western Mediterranean. Proceedings Science Results, ODP, Leg 107, Tyrrhenian Sea 107. 513–33.
- Roth, P. H., and W. T. Coulbourn. 1982. Floral and solution patterns of coccoliths in surface sediments of the North Pacific. Marine Micropaleontology 7 (1):1–52. doi:10.1016/0377-8398(82)90014-7.
- Rueda, G., S. Fietz, and A. Rosell-Melé. 2013. Coupling of air and sea surface temperatures in the eastern Fram Strait during the last 2000 years. The Holocene 23 (5):692–98. doi:10.1177/0959683612470177.
- Sagnotti, L., and C. Caricchi. 2018. StratFit: An Excel workbook for correlation of multiple stratigraphic trends. Annual of Geophysics 61:DA341.
- Samtleben, C., and T. Bickert. 1990. Coccoliths in sediment traps from the Norwegian Sea. Marine Micropaleontology 16 (1–2):39–64. doi:10.1016/0377-8398(90)90028-K.
- Sancetta, C. 1982. Distribution of diatom species in surface sediments of the Bering and Okhotsk Seas. Micropaleontology 28 (3):221–57. doi:10.2307/1485181.
- Schiebel, R., R. F. Spielhagen, J. Garnier, J. Hagemann, H. Howa, A. Jentzen, A. Martìnez-Gargia, J. Meilland, E. Michel, J. Repschläger et al. 2017. Modern planktic foraminifers in the high-latitude ocean. Marine Micropaleontology 136:1–13. doi:10.1016/j.marmicro.2017.08.004.
- Schiebel, R., J. Wanieck, M. Bork, and C. Hemleben. 2001. Planktic foraminifera production simulated by chlorophyll redistribution and entrainment of nutrients. Deep-sea Research Part I 48 (3):721–40. doi:10.1016/S0967-0637(00)00065-0.
- Sejrup, H. P., T. Fjæran, M. Hald, L. Beck, J. Hagen, I. Miljeteig, I. Morvik, and O. Norvik. 1981. Benthonic foraminifera in surface samples from the Norwegian Continental Margin between 62°N and 65°N. Journal of Foraminiferal Research 11 (4):277–95. doi:10.2113/gsjfr.11.4.277.
- Serreze, M. C., and J. A. Francis. 2006. The Arctic amplification debate. Climatic Change 76 (3–4):241–64. doi:10.1007/s10584-005-9017-y.
- Setoyama, M. C., and M. A. Kaminski. 2015. Neogene benthic foraminifera from the southern Bering Sea (IODP Expedition 323). Palaeontologia Electronica 18 (2.38A):1–30.
- Shala, S., K. Helmens, K. Jansson, M. Kylander, J. Risberg, and L. Löwemark. 2014. Palaeoenvironmental record of glacial lake evolution during the early Holocene at Sokli, NE Finland. Boreas 43 (2):362–76. doi:10.1111/bor.12043.
- Simstich, J., M. Sarntheim, and H. Erlenkauser. 2003. Paired δ18 O signals of Neogloboquadrina pachyderma (sin.) and Turborotalia quinqueloba show thermal stratification structure in Nordic Seas. Marine Micropaleontology 48 (1–2):107–25. doi:10.1016/S0377-8398(02)00165-2.
- Skogseth, R., L. H. Smedsrud, F. Nilsen, and I. Fer. 2008. Observations of hydrography and downflow of brine-enriched shelf water in the Storfjorden polynya, Svalbard. Journal of Geophysical Research Oceanography 113 (8):1–13.
- Solomon, S., D. Qin, M. Manning, Z. Chen, M. Marquis, K. B. Averyt, M. Tignor, and H. L. Miller, Eds. 2007. Contribution of Working group I to the Fourth Assessment Report of the Intergovernmental Panel on Climate Change, evidence-based climate science 2007, 996. Cambridge, United Kingdom and New York, NY, USA.
- Spielhagen, R. F., K. Werner, S. Aagaard-Sørensen, K. Zamelczyk, E. Kandiano, G. Budeus, K. Husum, T. M. Marchitto, and M. Hald. 2011. Enhanced modern heat transfer to the Arctic by warm Atlantic Water. Science 331 (6016):450–53. doi:10.1126/science.1197397.
- St. John, K. 2008. Cenozoic ice-rafting history of the central Arctic Ocean: Terrigenous sands on the Lomonosov Ridge. Paleogeography and Paleoclimatology 23:1S05.
- Stickley, C., K. St. John, N. Koç, R. W. Jordan, S. Passchier, R. B. Pearce, and L. E. Kearns. 2009. Evidence for middle Eocene Arctic sea ice from diatoms and ice-rafted debris. Nature 460 (7253):376–79. doi:10.1038/nature08163.
- Stroeve, J. C., A. Frei, J. McCreight, and D. Ghatak. 2008. Arctic sea-ice variability revisited. Annals of Glaciology 48:71–81. doi:10.3189/172756408784700699.
- Stroeve, J. C., M. C. Serreze, M. M. Holland, J. E. Kay, J. Maslanik, and A. P. Barrett. 2012. The Arctic’s rapidly shrinking sea ice cover: A research synthesis. Climate Change 110 (3–4):1005–27. doi:10.1007/s10584-011-0101-1.
- Strzelecki, M. C., A. J. Long, J. M. Lloyd, J. Malecki, P. Zagórski, L. Pawlowski, and J. M.w. 2018. The role of rapid glacier retreat and landscape transformation in controlling the post-Little Ice Age evolution of paraglacial coasts in central Spitsbergen (Billefjorden, Svalbard). Land Degradation Development 29 (6):1962–78. doi:10.1002/ldr.2923.
- Szeligowska, M., E. Trudnowska, R. Boehnke, A. M. Dąbrowska, K. Dragańska-Deja, K. Deja, M. Darecki, and K. Błachowiak-Samołyk. 2021. The interplay between plankton and particles in the Isfjorden waters influenced by marine- and land-terminating glaciers. Science of the Total Environment 780:146491. doi:10.1016/j.scitotenv.2021.146491.
- Thomas, E., L. Booth, M. Maslin, and N. J. Shackleton. 1995. Northeastern Atlantic benthic foraminifera during the last 45,000 years: Changes in productivity seen from the bottom up. Paleoceanography 10 (3):545–62. doi:10.1029/94PA03056.
- Tolderlund, D. S., and A. W. H. Bé. 1971. Seasonal distribution of planktonic foraminifera in the western North Atlantic. Micropaleontology 17 (3):297–329. doi:10.2307/1485143.
- Trouet, V., J. Esper, N. E. Graham, A. Baker, J. D. Scourse, and D. C. Frank. 2009. Persistent positive North Atlantic Oscillation mode dominated the Medieval climate anomaly. Science 324:78–80.
- Trouet, V., J. D. Scourse, and C. C. Raible. 2012. North Atlantic storminess and Atlantic meridional overturning circulation during the last millennium: Reconciling contradictory proxy records of NAO variability. Global and Planetary Change 84-85:48–55. doi:10.1016/j.gloplacha.2011.10.003.
- Tucker, M. 1988. Techniques in sedimentology, 394. Blackwell Scientific Publications, Oxford.
- Vandorpe, T., T. Collart, V. Cnudde, S. Lebreiro, F. Javier Hernández-Molina, B. Alonso, A. Mena, L. Antón, and D. Van Rooij. 2019. Quantitative characterisation of contourite deposits using medical CT. Marine Geology 417:1066003. doi:10.1016/j.margeo.2019.106003.
- Vogt, C. 1997. Regional and temporal variations of mineral assemblages in Arctic Ocean sediments as climatic indicator during glacial/interglacial changes. Reports on Polar Research 251:309.
- Vogt, C. 2009. Data report: Semiquantitative determination of detrital input to ACEX sites based on bulk sample X-ray diffraction data. In Proc. IODP, ed. J. Backman, K. Moran, D. B. McInroy, and L. A. Mayer the Expedition 302 Scientists, 302. Edinburgh: Integrated Ocean Drilling Program Management International, Inc.
- Vogt, C., and J. Knies. 2009. Sediment pathways in the western Barents Sea inferred from clay mineral assemblages in surface sediments. Norwegian Journal of Geology 89:41–55.
- Volkmann, R. 2000. Planktic foraminifers in the outer Laptev Sea and the Fram Strait – Modern distribution and ecology. Journal of Foraminifera Research 30 (3):57–176. doi:10.2113/0300157.
- von Appen, W.-J., U. Schauer, R. Somavilla, E. Bauerfeind, and A. Beszczynska-Möller. 2015. Exchange of warming deep waters across Fram Strait. Deep Sea Research 103:86–100. doi:10.1016/j.dsr.2015.06.003.
- von Quillfeldt, C. H., W. G. Ambrose Jr., and Clough. L. M. 2003. High number of diatom species in first‐year ice from the Chukchi Sea. Polar Biology 26 (12):806–18. doi:10.1007/s00300-003-0549-1.
- Walczowski, W., A. Beszczyńska-Möller, P. Wieczorek, M. Merchel, and A. Grynczel. 2017. Oceanographic observations in the Nordic Sea and Fram Strait in 2016 under the IOPAN long-term monitoring program AREX. Oceanologia 59 (2):187–94. doi:10.1016/j.oceano.2016.12.003.
- Weckström, K., B. Redmond Roche, A. Miettinen, D. Krawczyk, A. Limoges, S. Juggins, S. Ribeiro, and M. Heikkilä. 2020. Improving the paleoceanographic proxy tool kit – On the biogeography and ecology of the sea ice-associated species Fragilariopsis oceanica, Fragilariopsis reginae-jahniae and Fossula arctica in the northern North Atlantic. Marine Micropaleontology 157:101860. doi:10.1016/j.marmicro.2020.101860.
- Werner, K., R. F. Spielhagen, D. Bauch, H. C. Hass, E. Kandiano, and K. Zamelczyk. 2011. Atlantic water advection to the eastern Fram Strait—multiproxy evidence for late Holocene variability. Palaeogeography, Palaeoclimatology, Palaeoecology 308 (3–4):264–76. doi:10.1016/j.palaeo.2011.05.030.
- Wollenburg, J. E., J. Knies, and A. Mackensen. 2004. High-resolution paleoproductivity fluctuations during the past 24 Kyr as indicated by benthic foraminifera in the marginal Arctic Ocean. Palaeogeography, Palaeoclimatology, Palaeoecology 204 (3–4):209–38. doi:10.1016/S0031-0182(03)00726-0.
- Wollenburg, J. E., and A. Mackensen. 1998. Living benthic foraminifers from the central Arctic Ocean: Faunal composition, standing stock and diversity. Marine Micropaleontology 34 (3–4):153–85. doi:10.1016/S0377-8398(98)00007-3.
- Wright, P. L. 1974. The chemistry and mineralogy of the clay fraction of sediments from the southern Barents Sea. Chemical Geology 13 (3):197–216. doi:10.1016/0009-2541(74)90020-5.
- Wu, L., D. J. Wilson, R. Wang, X. Yin, Z. Chen, W. Xiao, and M. Huang. 2020. Evaluating Zr/Rb ratio from XRF Scanning as an indicator of grainsize variations of glaciomarine sediments in the Southern Ocean. Geochemistry, Geophysics, Geosystems 21 (11):e2020GC0099350. doi:10.1029/2020GC009350.
- Zamelczyk, K., T. L. Rasmussen, M. Raitzsch, and M. Chierici. 2020. The last two millennia: Climate, ocean circulation and paleoproductivity inferred from planktic foraminifera, south-western Svalbard margin. Polar Research 39:715. doi:10.33265/polar.v39.3715.