
ABSTRACT
Relating physiological stress to habitat quality could refine conservation efforts. Habitat quality, which is often inferred from patch occupancy or demographic rates, might be measured in a more timely and nuanced way using metrics of physiological stress. To understand whether stress-associated hormones vary with metrics of habitat quality, we measured fecal glucocorticoid metabolite (FGM) levels in the American pika (Ochotona princeps), a small mammal with well-defined habitat (talus), which can vary in quality depending on the presence of subsurface ice features. In spring and fall 2018, we collected feces noninvasively from pika territories in taluses “with” or “without” subsurface ice to capture seasonal variation in FGM between habitat types. We used linear mixed effects models to explore the interactions among season, habitat metrics (including subsurface ice status), and subsurface temperature as predictors of FGM. We found support for interacting effects on FGM levels, which covaried with season, elevation, putative ice presence, graminoid to forb ratio, graminoid cover, and measures of acute subsurface heat exposure. However, only one subsurface temperature metric differed according to putative presence of subsurface ice. Our results contribute to the growing evidence that FGMs might be developed as a tool to assess habitat quality.
Introduction
Climate change is predicted to influence range dynamics for many species over the coming decades, with general trends showing upslope and poleward shifts in species distributions (Chen et al. Citation2011). However, developing methods for evaluating these predictions in the short term, rather than waiting for range adjustments, would speed the refinement of conservation efforts. Wildlife management has long relied on monitoring techniques that measure population size and distribution to understand population health. However, these techniques can only detect population decline after it has already happened. For example, in a review of 950 papers on relationships of vertebrate and invertebrate animals to habitat fragmentation (Ellis, McWhorter, and Maron Citation2012), the majority of studies focused on distribution-related responses such as presence/absence or abundance. In contrast, only thirty-six studies (<4 percent) measured a physiological response, like stress, to habitat factors (Ellis, McWhorter, and Maron Citation2012).
Wildlife populations live in a patchwork of habitats across landscapes and constantly experience changes in localized environments. How animals cope with these changing conditions can affect their fitness (Sheriff et al. Citation2011). Animals in low-quality habitats may not have access to the energy required for allostasis (physiological stability in the presence of actual or perceived stressors), resulting in allostatic overload (a cumulative effect of chronic stress) that reduces individual fitness (McEwen and Wingfield Citation2003). Thus, stress in individuals can be influenced by habitat quality. By evaluating patterns of the individual stress response among populations, we can gain insights into drivers of population-level health (Homyack Citation2010; Ellis, McWhorter, and Maron Citation2012; Madliger and Love Citation2014; Lea et al. Citation2018).
When an unpredictable event (e.g., predator–prey interaction, extreme weather, food shortage) challenges an animal’s physiological and behavioral stability (homeostasis), a cascade of physiological processes is activated to regain equilibrium (McEwen and Wingfield Citation2003; Reeder and Kramer Citation2005). One part of this process is the release of glucocorticoid hormones, which aid in modulating the animal’s response to the current stressor (Sapolsky, Romero, and Munck Citation2000; MacDougall-Shackleton et al. Citation2019). A rapid glucocorticoid response is often beneficial, because it stimulates a rapid physical and/or behavioral response (like running from a predator, seeking shelter from inclement weather, or moving to find better resources) and thus speeds the subsequent process of replenishing energy and restoring homeostasis (McEwen and Wingfield Citation2003). However, if the stressor remains persistent, prolonged elevation of glucocorticoid levels can lead to decreased body mass, reduced reproduction, and increased mortality (Romero, Dickens, and Cyr Citation2009; Dantzer et al. Citation2014). Metrics of physiological stress therefore have the potential to help conservationists understand habitat-mediated effects on populations (Homyack Citation2010). For example, in red-legged kittiwakes (Rissa brevirostris), juveniles who were fed poor-quality diets grew more slowly and exhibited higher levels of plasma corticosterone hormones (Kitaysky et al. Citation2006). Likewise, fecal corticosterone metabolite levels were higher and body mass was lower in wild wood mice (Apodemus sylvaticus) living in poor quality pine forest habitats that provided fewer resources, compared to those in higher quality holm oak wood habitats (Navarro-Castilla and Barja Citation2019).
Understanding the habitat features that result in higher average stress at the population level could help managers prioritize conservation efforts. For example, studies on the influence of traffic noise on stress hormone levels in spotted owls (Strix occidentalis caurina and Strix occidentalis occidentalis) helped inform conservation strategies for the species and highlighted both potential costs and benefits of roads on population dynamics (USDA Forest Service Citation2019). Here, we investigate whether habitat quality can influence stress in American pikas (Ochotona princeps). Specifically, we ask whether individual fecal glucocorticoid metabolites (FGMs) vary with metrics of habitat quality that are understood to limit the species’ range. We focus on this species because pikas have been long studied as a model for biogeographic response to climate. They also have strong habitat associations and a recent history of population declines attributed to climate change.
The American pika, hereafter “pika,” depends on the relatively cool and mesic habitats created by fractured rock habitats, such as talus, boulder fields, and lava beds (Hafner Citation1994; Henry, Henry, and Russello Citation2012; A. T. Smith, Nagy, and Millar Citation2016; ). Such habitats are typically produced at higher elevations by freeze–thaw processes, and pikas are generally associated with permafrost and periglacial features (Hafner Citation1994; C. I. Millar and Westfall Citation2010). Range retractions (Beever et al. Citation2016; Jeffress, van Gunst, and Millar Citation2017) and local extirpations (Nichols, Klingler, and Peacock Citation2016; Jeffress, van Gunst, and Millar Citation2017; Stewart, Wright, and Heckman Citation2017) have been documented for pikas, with climate implicated as a driver of most losses (Hafner Citation1994; Beever, Brussard, and Berger Citation2003; Grayson Citation2005; Beever et al. Citation2010, Citation2011; Wilkening et al. Citation2011; Stewart et al. Citation2015; Wilkening, Ray, and Varner Citation2015; Stewart, Wright, and Heckman Citation2017; Rodhouse et al. Citation2018). Several range projections suggest dramatic losses in response to climate change during this century (Galbreath, Hafner, and Zamudio Citation2009; Calkins et al. Citation2012; Stewart et al. Citation2015). However, climate vulnerability predictions for pikas in eight national parks suggest a more complex future in which some populations might persist into the next century, whereas others are likely to be extirpated (Schwalm et al. Citation2016). Likewise, other analyses have shown that “ecoregion” is the most important predictor of pika range associations with climate (A. B. Smith et al. Citation2019), supporting predictions that pika response to climate change may be regionally variable and idiosyncratic (Jeffress et al. Citation2013). Furthermore, subsurface microclimates can extend the range and facilitate local persistence of this species in otherwise hostile environments (Varner and Dearing Citation2016; Ray, Beever, and Rodhouse Citation2016; Camp et al. Citation2020), which compounds regional variability between population responses and complicates vulnerability assessments based on surface climate projections.
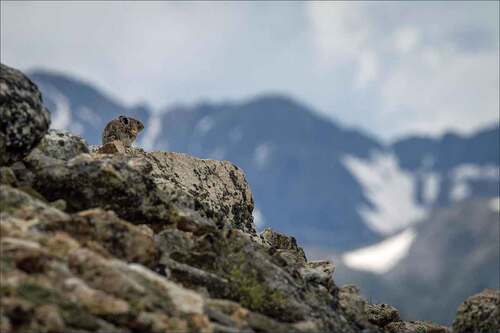
Figure 1. An American pika (Ochotona princeps) in the Rocky Mountains. Photograph courtesy of Kristi Odom.
A growing body of work has demonstrated a close relationship between rock-ice features (RIFs) and pika distribution (Hafner Citation1994; C. I. Millar and Westfall Citation2010; C. I. Millar, Westfall, and Delany Citation2014; Wilkening, Ray, and Varner Citation2015), suggesting that active RIFs may indicate better habitat quality for pikas. This association is supported by evidence that pikas cannot tolerate temperatures above 25°C without access to cooler temperatures (MacArthur and Wang Citation1974; A. T. Smith Citation1974; Hafner Citation1993, Citation1994; Henry, Henry, and Russello Citation2012; A. T. Smith, Nagy, and Millar Citation2016). Biogeographic patterns also support the association of pikas and RIFs: a survey of pika sign (current or old) at 420 sites in the Southwestern United States found that the majority of current occurrences were on RIFs (C. I. Millar and Westfall Citation2010). As recently as 1994, all pika populations in the southern Rocky Mountains were estimated to be within 5 km of current permafrost (Hafner Citation1994). RIFs are also associated with subsurface microclimates that are both more moderate than ambient temperatures (cooler in the summer and warmer in the winter) and less variable year-round (C. I. Millar and Westfall Citation2010; C. I. Millar, Westfall, and Delany Citation2013; Wilkening, Ray, and Varner Citation2015). In the first study to measure pika FGM levels as a function of habitat type, pikas inhabiting rockslides associated with RIFs exhibited lower FGM levels than those in an adjacent area without RIFs (Wilkening, Ray, and Varner Citation2015). Therefore, we consider sites with subsurface ice to be of higher habitat quality than sites lacking RIFs.
FGMs are metabolized stress-associated hormones present in feces that can be used as a measure of glucocorticoids in the body (Keay et al. Citation2006; Homyack Citation2010; Dantzer et al. Citation2014). FGMs represent a time-averaged metric of circulating glucocorticoids (Sheriff et al. Citation2011; Dantzer et al. Citation2014), which is dependent on gut passage time and varies by species (Palme et al. Citation1996). For pikas, the gut passage time over which FGMs are averaged is about 12.5 hours (Wilkening, Ray, and Sweazea Citation2013). FGMs are therefore used as a metric of relatively “chronic” stress (Keay et al. Citation2006; Dantzer et al. Citation2014), as opposed to metrics of “acute” stress like corticosterone in blood, which can vary within minutes of exposure to a stressor (Romero and Reed Citation2005; Sheriff et al. Citation2011; Ellis, McWhorter, and Maron Citation2012). Previous studies have confirmed that FGM measurements provide a biologically relevant measure of physiological stress in pikas (Wilkening, Ray, and Sweazea Citation2013; Wilkening, Ray, and Varner Citation2015; Wilkening and Ray Citation2016). Furthermore, pikas that exhibited higher FGM levels were less likely to survive the following year in the wild (Wilkening and Ray Citation2016), pointing to the utility of FGMs as an indicator of individual fitness. After appropriate validation, Wilkening, Ray, and Varner (Citation2015) found that FGM levels varied between two sites, one with and one without subsurface ice. As such, we expect that FGM levels will vary with habitat quality across our study sites. The use of FGMs as a potential indicator of habitat quality could therefore provide timely information about environmental changes that may be missed by studies of range retraction and/or population declines that have already occurred.
Here, we focus on FGM levels to address questions about habitat quality for pikas occupying RIF and non-RIF habitats in Boulder and Larimer Counties, Colorado. Specifically, we investigated whether pikas living in close association with RIFs (presumably higher quality habitat) appear to experience lower levels of FGM compared to those living in habitats without RIFs (lower quality habitat). Expanding on Wilkening, Ray, and Varner (Citation2015), we sampled pika scat from two types of RIFs: “active” rock glaciers thought to harbor subsurface ice recently and “fossil” rock glaciers considered long devoid of subsurface ice (as classified by Janke Citation2005, Citation2007). To understand other influences of habitat quality on FGMs, we also measured fine-scale habitat differences between active and fossil rock glaciers, including potential metrics of thermal stress (microclimate) and available resources (talus depth, clast size, and land cover metrics related to forage). To account for possible seasonal variation in pika FGMs (Whipple et al. Citation2021), scat samples were collected in the alpine spring and fall. We then modeled FGM as a function of habitat-driven differences (rock glacier status or fine-scale habitat metrics) and season after accounting for effects of individual sex, or as a function of temperature-driven differences between habitat types. We predicted that pikas living within recently active rock glaciers would exhibit lower FGM levels than pikas living within fossil rock glaciers. Developing FGM measurements as an assay of habitat quality would help pinpoint important habitat features on the landscape that are otherwise difficult to identify, which could ultimately help refine conservation efforts and inform predictions of future pika distributions.
Materials and methods
Study system
The American pika is a small (~150 g) mammal that lives in rock piles (talus slopes, boulder fields, and lava beds) in Western North America (A. T. Smith and Weston Citation1990). Pikas defend relatively small territories (14–34 m in diameter; A. T. Smith and Weston Citation1990) and typically do not relocate after establishing a territory. Furthermore, pikas do not migrate or hibernate, so each individual is exposed year-round to the quality of habitat contained within its territory. Each territory owner usually builds a winter food cache or “haypile” consisting largely of graminoids (such as grasses and sedges) and forbs (herbaceous flowering plants). Haypiles are amassed during the growing season and consumed over winter (Dearing Citation1997). Because pikas are central-place foragers, haypiles are typically located near the centroid of a pika’s territory (Huntly, Smith, and Ivins Citation1986; Roach, Huntly, and Inouye Citation2001). We determined territory locations by the presence of fresh haypiles in fall or by the presence of fresh defecations at old haypile sites in spring. Although an individual sometimes constructs multiple distinct caches within its territory, each haypile sampled in this study was separated by at least 50 m from other haypiles, which exceeds the typical distance between territory centers (A. T. Smith and Weston Citation1990). Thus, our samples likely derive from distinct individuals.
Fecal pellets were collected in 2018 from pika territories located in rock glaciers within eight sites along the Front Range of Colorado: four in Rocky Mountain National Park (ROMO; 40°19′N, 105°39′W) and four adjacent to the Niwot Ridge Long-Term Ecological Research site (NWT; 40°3′N, 105°36′W). To identify the status of the rock glaciers at each site, we used geographic data layers created by Janke (Citation2005, Citation2007). Janke (Citation2005, Citation2007) used a combination of photographs, field investigations, and previous studies of terminus (leading-edge) motion to classify rock glaciers along the Front Range of Colorado as “active,” “inactive,” or “fossil.” Active rock glaciers were classified as moving, exhibiting steep frontal (leading-edge) slopes and pronounced ridges and furrows due to the presence of internal ice (Janke Citation2005, Citation2007). Both inactive and fossil rock glaciers were classified by the absence of movement, indicated by gentler frontal slopes. However, inactive rock glaciers may still contain ice, whereas fossil rock glaciers are thought to contain no ice (Whalley and Martin Citation1992; Barsch Citation1996). Fossil rock glaciers were further indicated by increasing cover of vegetation within the boundaries of a formerly active rock glacier (Janke Citation2005, Citation2007). We chose to study only active and fossil rock glaciers (omitting those that were inactive) because these represented the most extreme differences in recent conditions. Active and fossil rock glaciers were paired in the same drainage, when possible, to help control for spatially varying environments and conditions. Within each geographic area (ROMO or NWT), we selected two active and two fossil rock glaciers (). Collectively, these study sites occurred at a range of elevations and aspects ().
Figure 2. Study site locations within Rocky Mountain National Park (Larimer County) and adjacent to Niwot Ridge (Boulder County), Colorado, USA. Blue triangles = active rock glaciers, red triangles = fossil rock glaciers. Black boundary delimits the southeastern portion of Rocky Mountain National Park.
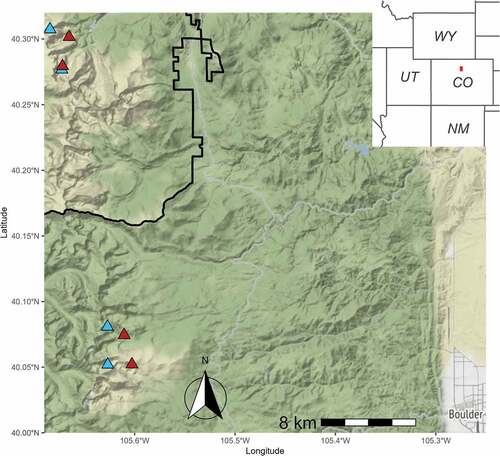
Table 1. Paired active (A) and fossil (F) rock glaciers studied in Rocky Mountain National Park (ROMO) and adjacent to the Niwot Ridge long-term ecological research site (NWT), Boulder County, Colorado, USA.
At each of the eight sites, we collected fresh (perched, sensu Stewart and Wright Citation2012) fecal pellets from at least ten unique territories, sampling each territory in both spring and fall. Fecal pellet sampling stations (hereafter, “stations”) were established by searching systematically for haypiles in the talus, starting at the terminus/toe (lower margin) and working toward the head (upper margin) of the talus slope. When a conspicuous haypile was found, we searched within a 5-m radius for a scat station where the territory owner appeared to deposit pellets regularly. The station location was recorded with a handheld Global Positioning System, and the search for new haypiles would continue after moving 50 m laterally or 50 m up the fall line (steepest slope) of near the edge of the talus.
Sample collection
FGM levels were assayed from fecal pellets collected noninvasively from free-ranging individuals in natural habitats. Pikas, like all lagomorphs, create two types of feces. Cecal feces are the soft portion of waste that has passed through the gut only once. After re-ingestion and further digestion, cecal material is re-excreted as firm fecal pellets (A. T. Smith and Weston Citation1990; Nichols Citation2010). Fecal pellets change color and texture as they age, and fresh pellets (less than one week since deposition) are greenish in color and fibrous inside (Nichols Citation2010). We collected only fresh (greenish, fibrous) fecal pellets from adult pikas (>2.75 mm in diameter) because FGM levels can vary between adults and juveniles (Wilkening, Ray, and Sweazea Citation2013). We targeted green pellets that were “perched” precariously (freshly) on rocks rather than pellets of less determinate age that had collected in depressions or on soil (Stewart and Wright Citation2012). Pellets start to lose their green color after one week (Nichols Citation2010) and remain perched (glued to the rock by urine) only until wind, rain, or a passing animal dislodges them. These points give us confidence that the pellets we collected were less than a week old (Nichols Citation2010). We note that samples could be a collection of multiple defecation events.
Postdeposition effects of climate should be considered when collecting feces from the field (Sheriff et al. Citation2011; Dantzer et al. Citation2014). In a study where Snowshoe hare (Lepus americanus) fecal pellets were experimentally exposed to environmental conditions for six days (all combinations of warm or cool and wet or dry), FGM levels varied under all treatments when compared to the control; however, FGM levels varied the least when exposed to cool and dry conditions (Lafferty et al. Citation2019). Similarly, a study that exposed American pika pellets to ambient conditions in pika latrine sites in several different ecoregions across the species range found that FGM levels varied inversely with precipitation and directly with temperature during the month prior to sample collection (Wilkening, Ray, and Varner Citation2016). However, these effects were only evident when FGM levels were compared across different ecoregions (e.g., between the Rocky Mountains and the Oregon Cascades or lava bed habitats) and not when samples were compared within the southern Rocky Mountain ecoregion (Wilkening, Ray, and Varner Citation2016). The southern Rocky Mountain ecoregion, where our study sites are located, has a relatively cool and dry climate, and because our sites are located within 23 km of each other in the same ecoregion, we do not expect postdepositional climate to have an effect on FGM levels in our study.
At each site (n = 8), the coordinates of multiple collection stations were established in the spring and revisited in the fall. We collected pellets in 2018 from 12 June through 16 July (“spring” in the alpine) and 9 September through 29 October (“fall”). After the collection of fresh pellets in the spring, any remaining pellets were cleared from each station to facilitate identification of fresh pellets in the fall. Samples were stored in paper coin envelopes labeled with sampling date and coordinates. To avoid contamination between samples, we scooped up pellets using the envelope flap or pushed pellets into the envelope using a stick or rock. We collected ten to fifteen pellets (0.1 g dry mass total) per sample to facilitate FGM analyses (Wilkening, Ray, and Sweazea Citation2013) and sex determination assays (described below). Samples were stored at −20°C within 24 hours of sampling, where they remained until analysis.
Sex determination
Because FGM levels can vary between sexes (Wilkening, Ray, and Sweazea Citation2013), we attempted to use a portion of each sample for pika sex determination through genetic analysis. When samples contained surplus pellets following the FGM assay, these surplus pellets were used to provide data on pika sex by season at most sampling stations.
Genetic samples from ROMO and NWT were analyzed in two different laboratories using slightly different assays for sex identification; however, both protocols relied on established, validated methods and included appropriate controls (Castillo et al. Citation2014; Lamb, Robson, and Russello Citation2014). Detailed polymerase chain reaction (PCR) recipes and conditions can be found in Supplement S1. In both analyses, sex was determined based on consensus across all PCR replicates to account for allelic dropout and PCR errors resulting from low-quality and low-quantity DNA template. Samples were identified as male, female, or unknown according to the following criteria: male = SRY fragments visible in two of three replicates or microsatellite and SRY fragments present in the same replicate; female = microsatellite fragments were present in at least one of the three replicates and SRY fragments were never present; unknown = only SRY fragments were present in one replicate, target genes never amplified, or samples were too small to subset for genetic analyses.
Habitat surveys
In 2019, we recorded pika-associated habitat metrics within a 12-m radius of each station to understand local habitat characteristics and fine-scale land cover types. Surveys were conducted between 11 July and 2 September, to coincide with the timing of highest vegetation cover in the alpine. We modeled our survey protocols after methods developed in previous studies (Rodhouse et al. Citation2010; Erb, Ray, and Guralnick Citation2011; Jeffress et al. Citation2013; Ray, Beever, and Rodhouse Citation2016). Recorded habitat metrics were described in Whipple et al. (Citation2021) and included talus depth (visual estimate of the depth, in increments of 0.5 m, of the deepest crevice observed within 12 m of scat station), rock size (longest axis of largest rock; LR1), tenth-largest rock (LR10; within the 12-m radius) and Daubenmire’s (Citation1959) estimates of percentage land cover for six cover types (rock, bare ground, graminoid, forb, shrub, and tree) within the 12-m radius. Specifically, the forb category included all herbaceous plants; graminoids included all grasses, rushes, and sedges; and shrub included all woody plants. We then used these data to calculate additional metrics of habitat, including mean rock size (0.5[LR1 + LR10]), rock size variation ([LR1 − LR10]/[0.5(LR1 + LR10)]), and several vegetation metrics that could affect diet estimated from percentage cover types: graminoid-to-forb ratio, forb cover, grass cover, and total available forage (sum of graminoid, forb, and shrub cover).
Temperature data collection
At each of the eight sites (), one HOBO temperature-sensing data logger (hereafter, “sensor”) was placed under the surface of the talus to record subsurface temperatures. All eight sensors (models H08 pro, H08, or H02; Onset Computer Corporation, Bourne, MA) recorded temperature (±0.2°C) every 1 or 2 hours for one year, starting in September 2018. Sensors were placed at similar depths (~0.75 m) near the center of each rock glacier. Sensor location and elevation were recorded with a handheld Global Positioning System unit and photos were taken to aid in sensor retrieval. A generalized additive model was used to estimate mean, maximum, and minimum daily temperatures from the interval data recorded by each sensor. Generalized additive models were fitted using the mgcv package (Wood Citation2011) in R 3.5.1 (R Core Team Citation2018).
Hormone analysis
To measure FGM level (concentration) in fecal pellet samples, we used a commercially available Corticosterone Enzyme Immunoassay kit (cat. No. K014-H5; Arbor Assay Design, Inc., Ann Arbor, MI) that has been previously validated for O. princeps (Wilkening, Ray, and Sweazea Citation2013). We followed the manufacturer’s protocols to extract FGMs from dry scat as described in Whipple et al. (Citation2021). For each sample, a random subset of pellets was dried using a DNA SpeedVac for 30 minutes and then weighed to 0.1 ± 0.02 g. Next, 200-proof ethanol was added in proportion to sample mass and pellets were smashed using a small metal spatula in a vial. These smashed pellets in ethanol were shaken for 30 minutes and then centrifuged to extract the supernatant, which was transferred to a new vial and concentrated using a DNA SpeedVac. Concentrated supernatant was stored at −20°C until all samples were prepared for the corticosterone assay. Then, a mix of assay buffer and ethanol was used to reconstitute the supernatant to its original volume (<5 percent ethanol content by volume) before loading onto enzyme immunoassay plates according to the manufacturer’s instructions. The commercial kit antibody is a sheep polyclonal antibody specific for corticosterone with a cross-reactivity of 100 percent. The cross-reactivity of the antibody with other steroids is very low—0.24 percent, 0.03 percent, and <0.08 percent for progesterone, testosterone, and estradiol, respectively—so we do not expect reproductive events to have affected our results. We assayed samples, standards (5,000, 2,500, 1,250, 625, 312.50, 156.25, and 78.125 pg/mL), and controls (maximum binding and nonspecific binding) in triplicate according to the kit instructions. Final fecal FGM concentrations were calculated from a standard curve and reported as pg FGM/g dried feces. Interassay coefficients of variation (%CV = CV × 100) were 3.6 percent and 13.9 percent for the nonspecific and maximum binding controls, respectively, and 8.9 percent for pooled fecal extracts. Intra-assay coefficients of variation were between 5.0 percent and 11.6 percent for nine plates (n = two controls, seven standards, two pooled extracts, and 21 samples per plate).
Linear mixed-effects models
FGM concentration was log-transformed and used as the response variable in linear mixed-effects models to characterize variation in FGM levels among and within rock glacier habitats. We evaluated two sets of candidate models, each based on up to five fixed effects (model sets A and B, ), plus random effects of territory nested within site to account for repeated measures and location effects using our full data set (n = 184).
Table 2. Fixed effects and associated hypotheses used to construct three sets of linear mixed-effects models of glucocorticoid metabolite concentrations measured from fecal sampling in individual territories of the American pika.
In the first set of models (model set A), we explored qualitative effects of broad-scale habitat metrics and season on FGMs, because stress-associated hormones like FGMs are known to vary seasonally in many animals (Baker, Gobush, and Vynne Citation2013), including pikas (Whipple et al. Citation2021). FGM level was modeled using fixed and interacting effects of season and rock glacier status (active or fossil) or using fixed and interacting effects of season and elevation in meters (mean centered and divided by standard deviation). We expected FGM levels to be higher in pikas living in fossil rock glacier habitats. Alternatively, elevation was used as a proxy for the many factors that vary with altitude, including rock glacier status. To account for effects of latitude and land management, we also included a fixed effect of location (ROMO or NWT; ) and its interaction with season. Finally, we included a fixed effect of sex along with all broad-scale habitat metrics, to account for the expected variation in FGM levels between sexes (Wilkening, Ray, and Sweazea Citation2013).
In the second set of candidate models (model set B), we modeled FGM level as a linear response to fine-scale habitat differences. To account for potential differences in fine-scale habitat differences between active and fossil rock glaciers, FGM level was modeled in response to either (1) a single fixed effect of one of our fine-scale habitat metrics plus fixed effects of season and/or sex or (2) fixed and interacting effects of one fine-scale habitat metric and rock glacier status plus fixed effects of season and/or sex. Fine-scale habitat metrics represented differences among territories, such as talus characteristics (talus depth, largest rock size, tenth-largest rock size, mean rock size, rock size variation) and vegetation metrics (graminoid-to-forb ratio, forb cover, graminoid cover, and the total available forage). Talus depth (coded as a categorical variable in 0.5-m increments) was explored because talus may act as an insulator from surface conditions (Wilkening et al. Citation2011; Henry, Henry, and Russello Citation2012; C. I. Millar, Westfall, and Delany Citation2014, Citation2016; Varner and Dearing Citation2016; Wilkening, Ray, and Varner Citation2015), and deeper talus may provide a better refuge during extreme heat (Moyer-Horner et al. Citation2015). Rock characteristics were explored because we lack prior knowledge of how structural complexity of the habitat might affect habitat quality. Vegetation metrics were explored because vegetation could affect pika diet and because these metrics have been predictive of pika occupancy in other studies (e.g., Wilkening et al. Citation2011; Wilkening, Cole, and Beever Citation2019).
We also conducted an exploratory analysis to investigate the effects of subsurface temperature on FGM levels. In this analysis, we evaluated three sets of candidate models (broad- and fine-scale habitat metrics along with subsurface temperature metrics) using a subset of our data (n = 170). Again, each model set was based on up to five fixed effects () plus random effects of territory nested within rock glacier. Covariates remained the same for broad- and fine-scale habitat model sets as above. For the set of subsurface temperature models (model set C), we modeled FGM level as a linear response to each of eight potential fixed effects, each a metric of thermal stress in pikas, based on previous studies (Beever et al. Citation2011; Wilkening et al. Citation2011; Varner et al. Citation2015; Wilkening, Ray, and Varner Citation2015). These metrics were intended to represent acute exposure to cold temperatures (number of days below −5°C or −10°C, 23 October 2018 to 19 July 2019), acute exposure to hot temperatures (number of days above 10°C or 15°C, 23 October 2018 to 19 July 2019), and chronic exposure to cold temperatures (mean and variation of temperatures during the two months in early and late winter, 23 October 2018 to 23 December 2018 and 1 April 2019 to 1 June 2019, respectively; ). Our metric of chronic cold exposure represents a period of time when snowpack is variable in our study area, which could expose subsurface habitats to acutely cold temperatures. Once a thick blanket of snow covers the talus, subsurface temperatures stabilize near 0°C, providing a stable refuge for pikas during subfreezing surface temperatures. Temperature variation (%CV) was calculated from the standard deviation of subsurface temperatures recorded during the specified period divided by the mean of those same temperature measurements. To account for potential differences in subsurface temperatures between active and fossil rock glaciers, FGM level was modeled in response to either (1) a single fixed effect of one of our temperature metrics plus fixed effects of season and/or sex or (2) fixed and interacting effects of one temperature metric and rock glacier status plus fixed effects of season and/or sex. The sample size was reduced in this model set because the single temperature logger in one of the active rock glaciers malfunctioned and failed to record subsurface temperature. We also used Student’s t-test to determine whether the means of each temperature metric differed between active and fossil rock glaciers. Because we performed eight t-tests (for eight temperature metrics), we used a Bonferroni correction to reduce the chance of obtaining false-positive results, adjusting our alpha value to .00625 (0.05/8) to determine whether means were significantly different.
Collinearity among predictor variables was calculated using Pearson’s rho (continuous variables), Spearman’s rank correlation coefficient, or Kendall’s tau, and pairs with a high correlation (>0.7) were not included in the same model. Models were fitted using the lme4 package (Bates et al. Citation2015) in R 3.5.1 (R Core Team Citation2018). We ranked models using Akaike’s information criterion adjusted for a small sample size (AICc) (Burnham and Anderson Citation2002). Relative support for each model was calculated using ΔAICc for each model i within a set of candidate models (set A, B, or C), defined as AICci − AICcmin, where AICcmin was the lowest AICc in the model set. Following convention, we considered models with ΔAICc > 2 to have lower support than the “top” model (ΔAICc = 0). We evaluated the relative likelihood of each model using Akaike weights, w[i] = exp(0.5*dAICc[i])/sum[j](dAICc[i = j]) (Burnham and Anderson Citation2002). Additionally, we evaluated pseudo-R2 to estimate the variance explained by the fixed effects only (marginal R2) and the variance explained by both the fixed effects and random effects (conditional R2) compared to the null model with only random effects using the r.squaredGLMM function in R package MuMIn (Barton Citation2022). In each model set, we included a null model of FGM as a function of random effects (territory nested within site) and no fixed effects, as well as models based on the fixed and interacting effects described above and listed in . Model set A included fixed and interacting effects of season and broad-scale habitat metrics (rock glacier status, elevation, location) plus a fixed effect of sex. Model set B included fixed and interacting effects of rock glacier status and fine-scale habitat metrics (graminoid-to-forb ratio, percentage forb cover, percentage graminoid cover, graminoid + forb + shrub cover, rock size [LR1, LR10], mean rock size, rock size variation, deepest crevice) plus fixed effects of season and/or sex. Model set C included fixed and interacting effects of rock glacier status and a measure of thermal stress in pikas (acute exposure to cold temperature, acute exposure to hot temperature, and chronic exposure to cold temperature) plus fixed effects of season and/or sex.
Results
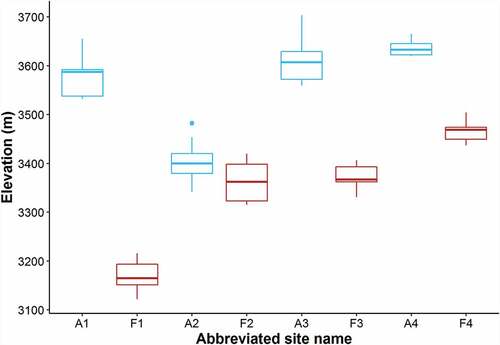
During the spring and fall of 2018, 190 fecal samples were collected from 100 sampling stations in eight rock glacier sites along the Front Range of Colorado. However, our model sample size was reduced to 184 fecal samples from 95 sampling stations due to persistent snow hindering our ability to conduct habitat surveys when we returned to stations in 2019. Of the 184 useful samples, 77 were collected from the four active rock glaciers (39 in the spring, 38 in the fall) and 107 were collected from the four fossil rock glaciers (55 in the spring, 52 in the fall). The elevation of sampled territories ranged from 3,122 m to 3,703 m ().
Figure 3. Elevation range of sampled territories grouped by site (n = 8). Abbreviated site names distinguish active (“A”) from fossil (“F”) rock glacier sites ().
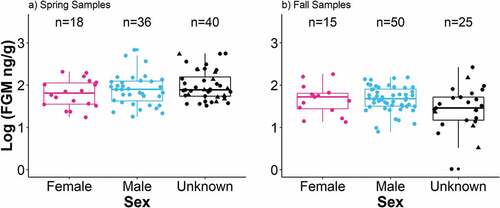
Fecal pellet mass was sufficient to allow genetic analysis for 168 of 184 samples to determine the sex of the putative territory owner. Of the samples collected in the spring (n = 94), 36 were deposited by males, 18 were deposited by females, and 40 were deposited by pikas of unknown sex due to autosomal DNA amplification failure (n = 29) or insufficient sample mass (n = 11). Of the samples collected in the fall (n = 90), 50 were deposited by males, 15 were deposited by females, and 25 were deposited by pikas of unknown sex due to DNA amplification failure (n = 20) or insufficient sample mass (n = 5). In model comparisons, we categorized sex either as a three-class variable (n(sex) = 86 male, 33 female, 65 unknown; ) or a four-class variable (n(sex) = 86 male, 33 female, 49 PCR failure, 16 insufficient sample mass). In both cases, there was no significant difference in log(FGM) levels among the sex categories (analysis of variance, F(2,181) = 0.118, p = .889; ).
Figure 4. Pika fecal glucocorticoid metabolite (FGM) concentration, log-scaled by sex and season. (a) In the spring, eighteen samples were classified as female (pink circles) and thirty-six were classified as male (blue circles); the remaining forty samples were classified as unknown due to DNA amplification failure (black circles) or insufficient size (black triangles). (b) In the fall, fifteen samples were classified as female, fifty as male, and the remaining twenty-five as unknown.
Because we determined sex from samples collected at a number of territories both in the spring and fall, we were also able to estimate turnover in the sex of putative territory owners. We found that of the eighteen territories occupied by females in the spring, nine were occupied by males in the fall and six were occupied by pikas of unknown sex. Of the thirty-six territories occupied by males in the spring, six were occupied by females in the fall and fourteen were occupied by pikas of unknown sex.
When we compared models in sets A and B using the full data set (n = 184), the best-supported model included a positive interaction of elevation and season (). Two other models were also well supported (ΔAICc < 2), one containing a positive interaction of graminoid-to-forb ratio and rock glacier status plus a negative effect of season, followed by a model containing a positive interaction of percentage graminoid cover and rock glacier status, plus a negative effect of season (). A model with a negative interaction of rock glacier status and season () and a model with similar terms to those of the top model with the addition of a sex covariate were moderately supported (∆AICc = 2.65 and 3.69, respectively; ). Location (ROMO or NWT) garnered less support (∆AICc = 4.74, ). A model containing a negative effect of season alone had very weak support (ΔAICc > 10). Including sex as a covariate did not improve model rank, regardles of whether “sex” was categorized using three or four categories, as described above. Akaike weights indicated that the interaction between standardized elevation and season was the strongest predictor of FGM levels (w[i] = 0.30), followed by the interaction of graminoid to forb ratio and rock glacier status plus season (w[i] = 0.26). Additionally, one of the highest conditional R2 values was associated with model 1A, indicating that its fixed and random effects estimated the most variance in FGM compared to other models. Generally, marginal and conditional R2 values were similar across models and the addition of our random effects always increased model fit.
Figure 5. Fecal glucocorticoid metabolite (FGM) concentration by elevation and season. Each point represents a unique fecal sample colored by the season in which it was collected (green = spring, orange = fall). Lines show mean FGM concentration by season with 95 percent confidence intervals.
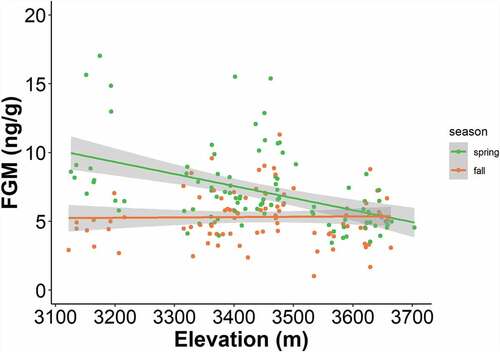
Figure 6. Fecal glucocorticoid metabolite (FGM) concentration by percentage graminoid cover (left) or graminoid-to-forb ratio (right) colored by rock glacier status (blue = active, red = fossil). Lines show mean FGM concentration with 95 percent confidence intervals.
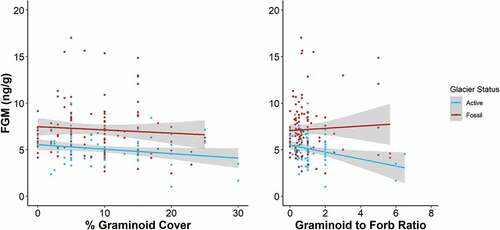
Figure 7. Fecal glucocorticoid metabolite (FGM) concentration for all sampled territories grouped by rock glacier status and season. When available, fecal samples were collected from each territory in the spring and in the fall of 2018 from locations along the Front Range of Colorado. These box-and-whisker plots depict median (heavy horizontal line), interquartile range (box), range (whiskers), and outliers (dots).
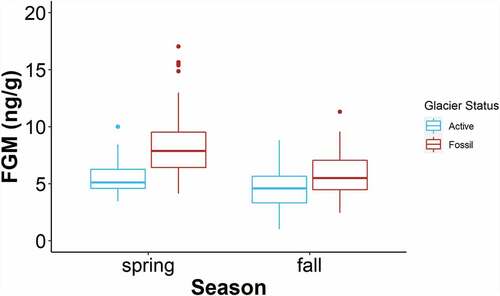
Table 3. Relative support for models of fecal glucocorticoid metabolite (FGM) concentration (log-FGM) in pika territories sampled within Rocky Mountain National Park and adjacent to the Niwot Ridge long-term ecological research site (n = 184).
As an exploratory analysis, we compared models in sets A and B with models in set C. In this exploratory analysis, sample size was reduced from 184 (in results presented above) to 170 due to temperature sensor failure in one of the active rock glaciers. Top model rankings were similar to those in for broad-scale habitat metrics (model set A); however, fine-scale habitat metrics (model set B) were outcompeted by several subsurface temperature models (model set C). The best-supported model included a positive interaction of elevation and season, followed by a model including a positive interaction of the number of days where subsurface temperature reached above 10°C and rock glacier status and a negative interaction of the number of days where subsurface temperature reached above 15°C and rock glacier status (). Both fixed effects of the number of days that subsurface temperature reached above 10°C or above 15°C were positively associated with FGM levels. However, only the mean of one temperature metric was significantly different between rock glacier status (Student’s t-tests; ). Specifically, in late winter (April–June), average temperature was warmer in fossil rock glaciers than in active rock glaciers (t = −6.73, p = .00623). Akaike weights indicated that the interaction between standardized elevation and season was the strongest predictor of FGM levels (model rank 1A; w[i] = 0.14). Additionally, the highest conditional R2 value was associated with model 1A, indicating that its fixed and random effects estimated the most variance in FGM compared to all other models. Marginal and conditional R2 values were similar across all other models and the addition of our random effects always increased model fit.
Figure 8. Subsurface temperature metrics grouped by rock glacier status (blue = active, red = fossil). Metrics were estimated from one subsurface temperature logger placed in the center of each rock glacier site. Standard box-and-whisker plots depict median (heavy horizontal line), interquartile range (box), range (whiskers), and outliers (dots). P-values are reported for each Student’s t-test comparing means of subsurface temperature metrics between rock glacier status. Using Bonferroni correction, significance is determined by an alpha level of .00625.
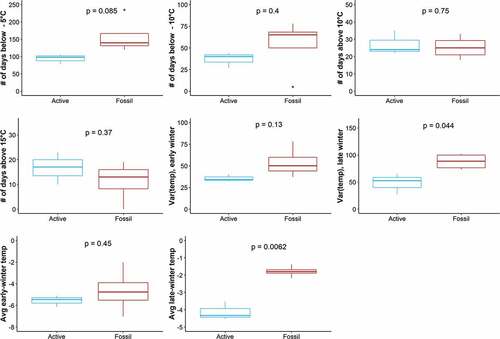
Table 4. Relative support for models of fecal glucocorticoid metabolite (FGM) concentration (log-FGM) from an exploratory comparison of all model sets () using data from all samples with corresponding subsurface temperature data (n =170).
Discussion
We found that several broad- and fine-scale habitat metrics could explain variation in the FGM levels of wild American pikas, suggesting an association between habitat quality and individual stress levels. This study corroborates a previous investigation of FGM response to putative habitat quality (Wilkening, Ray, and Varner Citation2015) and extends those results by providing data from two seasons and from a much larger and well-replicated spatial extent. Further, our results add to a growing body of work that illustrates the relationship between broad-scale habitat quality, season, and glucocorticoid (GC) measurements. For example, capercaillie (Tetrao urogallus), wood mice (Apodemus sylvaticus), and arctic ground squirrels (Urocitellus parryii) have been shown to exhibit higher GC levels in poorer quality habitats (Coppes et al. Citation2018; Navarro-Castilla and Barja Citation2019; Sheriff et al. Citation2017, respectively). Additionally, the seasonal trend in FGM levels found in this study has been mirrored in studies of arctic ground squirrels and snowshoe hares where GC levels were elevated at the end of winter and lowered through the active season (Sheriff et al. Citation2012; Lavergne et al. Citation2020, respectively).
Although our noninvasive study was not designed to measure physiological indices (e.g., body weight, immune response, glucose response) that could help shed light on the relationship between fitness and FGM level (Breuner, Delehanty, and Boonstra Citation2013; Dantzer et al. Citation2014), a previous study found that pikas exhibiting higher FGM levels were less likely to survive the following year after capture (Wilkening, Ray, and Varner Citation2016), suggesting a direct link between elevated FGM levels and reduced fitness. We recommend further studies to evaluate the relationship between FGM levels and physiological indices to suggest mechanisms governing pika response to habitat quality.
Broad-scale habitat metrics (model set A)
Variation in FGM level was best explained by the interaction of elevation and season. These results indicate that pikas living at higher elevations have lower average FGM levels and that FGM levels are higher in the spring than in the fall (). Pika occupancy surveys have documented population losses at lower elevations in several parts of the species range (Beever et al. Citation2016; Jeffress, van Gunst, and Millar Citation2017; Stewart, Wright, and Heckman Citation2017), and our study suggests that these range retractions might be due to processes that cause higher FGM levels. Furthermore, our results suggest that FGM levels might be useful for predicting populations at risk, given that we detected higher FGM levels in populations at lower elevations. However, it is important to note that elevation is confounded with rock glacier status: active rock glaciers are commonly found at higher elevations and fossil rock glaciers are more likely to occur at lower elevations in our study area (Janke Citation2007; ). We used elevation as a proxy for broad spatial trends in the environment that are generally shared among several territories within a site. We propose that abiotic and biotic factors could be driving seasonal trends across elevations, such as the timing of snowmelt or plant green-up. For example, a thick blanket of snow at higher elevations can buffer subsurface talus temperatures from extremely cold above-surface temperatures. In the spring, when cold snaps are common in the mountains, lower (subalpine) elevations may not have adequate snow cover to shield pikas from acute cold stress. Likewise, the timing of plant green-up occurs sooner at lower elevations, which could influence the timing of plant senescence later in the summer, when pikas are most actively harvesting food for the winter (Dearing Citation1997). Thus, the timing of the period during which pikas can acquire highly nutritious food might be important in determining haypile quality, with implications for pika FGM levels in the following spring.
The interaction of rock glacier status and season was also supported as a predictor of pika FGM levels. This model supports our hypothesis that FGM levels are higher in fossil rock glaciers than in active rock glaciers and refines our understanding by showing that this effect on FGMs is more pronounced in the spring (). The coherent difference in FGM levels between active and fossil rock glaciers indicates that habitat quality correlates with a stress metric in our system. Results from this study are consistent with previous research at NWT showing that pikas exhibit lower FGM levels in one area dominated by RIFs compared to habitat not associated with a RIF (Wilkening, Ray, and Varner Citation2015). This result held in our study when replicated several years later and across several RIF sites, indicating that RIFs may constitute higher quality habitats for pikas.
Further, all of the top models in our study indicate that season is an important driver of FGM levels. Specifically, FGM levels were highest in spring, suggesting that the previous winter might have been stressful for the pikas in our study and that overwinter stress might generally be a limiting factor for pikas. Temperature-based metrics of cold stress have been shown to affect pika FGM levels, occupancy, and persistence in other studies (Beever, Brussard, and Berger Citation2003; Beever et al. Citation2010, Citation2011; Wilkening et al. Citation2011; Jeffress et al. Citation2013; Wilkening, Ray, and Varner Citation2015; Rodhouse, Hovland, and Jeffress Citation2017). We hypothesize that the reduction in snow cover in North America’s Mountain West (Mote et al. Citation2005) along with the loss of subsurface ice in our research area (Leopold et al. Citation2015) might indicate changes in the microhabitats that pikas depend on for thermally buffered refugia. Without these refugia, pikas may be faced with a more stressful and unpredictable thermal environment. Our results are also consistent with previous findings that snow cover and winter cold stress are important determinants of pika distribution and extinction risk (Beever et al. Citation2010; Erb, Ray, and Guralnick Citation2011; Guralnick, Erb, and Ray Citation2012; Schwalm et al. Citation2016; Rodhouse, Hovland, and Jeffress Citation2017) and add increasing evidence that pikas experience more stress in the cold season than in the warm season. These results were mirrored in a similar study on a nearby population of pikas at NWT, where FGM levels were highest in the spring when measured every two weeks throughout the growing season (Whipple et al. Citation2021).
If our methods were replicated and elevated FGM levels in the spring stayed consistant across years and in different regions, it might suggest that localized pika losses are due to sustained stressors related to habitat quality, rather than stochastic events like epizootics or extreme weather events. Elevated FGM levels in the spring may be a product of the cumulative effects of winter cold stress combined with the lack of forage availability at a time when pika haypiles are depleted and decayed (Dearing Citation1997). However, it is important to note that high FGM levels in the spring could also be attributed to the timing of reproduction. Reproduction likely elevates FGM levels in females (Dantzer et al. Citation2014) and possibly also in males due to increased reproductive competition as evidenced in arctic ground squirrels (Urocitellus parryii; Delehanty and Boonstra Citation2011) and yellow-bellied marmots (Marmota flaviventris; J. E. Smith et al. Citation2012). Parturition usually coincides with snowmelt (J. S. Millar Citation1972; A. T. Smith Citation1978), which is when our spring sampling effort occurred.
Fine-scale habitat metrics (model set B)
Our results provide evidence that fine-scale (territory-level) habitat metrics also influence FGM levels in pikas. Other well-supported models include an interaction of rock glacier status and either graminoid-to-forb ratio or percentage graminoid cover. These models suggest that higher graminoid cover is correlated with reduced FGM levels in pikas, at least in active rock glacier habitats (). In contrast, studies in the warmer and drier Great Basin have demonstrated that pika occupancy is correlated with higher forb cover and reduced graminoid cover (Wilkening et al. Citation2011). Although these results may seem contradictory (forb cover being associated with higher occupancy in one region but higher stress in another), we suggest that this difference may be due to regional differences in pika water balance between the hotter and drier Great Basin and the cooler and moister Rocky Mountains. Studies in both the Great Basin (Elliot & Flinders Citation1984; Beck and Peek Citation2005) and our study region (Bhattacharyya and Ray Citation2015; J. Varner, unpublished data) demonstrate that forbs are consistently higher in water content, protein content, and micronutrient content than graminoids in both ecoregions. In the Great Basin, higher graminoid cover occurred at more xeric sites (Wilkening et al. Citation2011). If pikas get nearly all of their water from the vegetation they eat (Krear Citation1965; J. A. Smith and Erb Citation2013), then pikas living in the warmer and drier portions of the Great Basin ecoregion—where graminoid cover is higher and pikas likely lose more water to evaporation—may experience higher water stress. In contrast, the graminoids in our study (including primarily Carex spp., Deschampsia cespitosa, and Juncus spp.) are not necessarily indicative of more xeric sites or reduced water availability in the Rocky Mountain ecoregion, and pikas may be less water-limited on a diet of graminoids at these sites. Pikas in this region tend to eat graminoids immediately, whereas forbs are often stored in haypiles for later consumption during winter (Dearing Citation1996). As a result, pikas living in territories with higher graminoid cover may have more access to immediate energy needed to carry out daily activities, especially in the spring when energy reserves are low and haypiles are depleted. Finally, it is important to note that higher graminoid cover was an important determinant of FGM levels only at active rock glaciers (), where vegetation was concentrated along the talus periphery, as were most of our sampling stations. We propose that because pikas appeared to be nearer to meadow interfaces at active rock glaciers sites, compared to fossil rock glaciers sites where pikas could be found further away from meadow interfaces (more insular territories), the easy access to forage that is apparently adequately nutritious could be driving lower FGM levels at active rock glacier sites.
Inter-individual metrics
The addition of a sex covariate to our top models did not further explain the variation in FGM levels, nor was sex well supported as the sole fixed effect in a model (ΔAICc > 10). Additionally, we found no significant difference in FGM levels among the sex categories.
By determining the sex of the samples collected from the same territory in both seasons, our results suggest turnover in the sex of territory owners, in contrast to previous studies that suggest that pika territories are likely to retain an owner of the same sex through time (Krear Citation1965; Sharp Citation1973; Tapper Citation1973; A. T. Smith and Ivins Citation1983, Citation1984). Of the fifty-four territories in which sex could be determined from spring samples, sex determined from fall samples differed in fifteen cases. Turnover rates in site occupancy are highly dependent on local influences but can be as high as 50 percent in some populations (Rodhouse et al. Citation2018). The changes in sex we observed between samples collected at the same territory could be a result of a change in latrine use or territory intrusion by neighbors and not necessarily a change in the owner of the territory. Additionally, it is possible that multiple pikas contribute pellets at a single latrine and therefore that we could have collected pellets from two different individuals. This is a particularly important consideration, given that our genetic analysis does not distinguish individuals within a sample but rather the presence or absence of the male-specific SRY locus. Thus, if any pellets in a sample came from a male, the whole sample could be definitively considered male, which could also explain why territories more frequently turned from female to male than vice versa. To improve our understanding of pika latrine use and the role of latrines in territorial behaviors, behavioral studies of marked individuals combined with genotyping of marked and unmarked individuals could be conducted at known stations to confirm the sex of pikas who deposit pellets.
Temperature metrics (model set C)
We used our preliminary temperature measurements to explore differences in subsurface habitat between rock glacier status, which we hypothesized could drive habitat quality for pikas. The top models from our exploratory analysis revealed that measures of acute exposure to hot temperature (the number of days in which subsurface temperature reached above 10°C or the number of days in which subsurface temperature reached above 15°C) were associated with higher FGM levels. These results are consistent with previous pika occupancy studies that observed population declines in warmer habitats (Wilkening et al. Citation2011; Stewart, Wright, and Heckman Citation2017). However, it is important to note that only one of our metrics differed between rock glacier status (active versus fossil; ). Specifically, fossil rock glaciers experienced warmer temperatures in late winter compared to active rock glaciers (). Active rock glaciers may have been colder because they tended to be higher in elevation than fossil rock glaciers and could have been experiencing colder ambient temperatures during late winter. We acknowledge that our limited sampling may not have fully characterized the subsurface temperature within these rock glacier habitats, especially because we are reporting data from only one sensor per rock glacier and for only nine months of one year (October–July). Due to the timing of our fieldwork, we were unable to collect subsurface temperature data during late summer, which is the warmest time in the alpine and a possible driver of chronic heat stress in pikas. Our temperature sensors were also placed no more than 0.75 m below the rock surface; thus, it is also likely that such shallow temperature readings did not capture the full range of temperatures that a pika could sample in this habitat. Previous geophysical studies on rock glacier A4 from our study detected ice 4 to 5 m below the surface (Leopold et al. Citation2011), depths that are likely accessible to pikas but often too difficult to outfit with sensors (Ray, Beever, and Rodhouse Citation2016).
Broader implications
Results from this study showed that FGM levels in populations of a small mammal were correlated not only with season but also with habitat metrics (elevation, vegetation, and rock glacier status). The pattern in FGM levels that we observed across landscapes indicates that stress-associated hormones could be used to evaluate seasonal variation in habitat quality for pikas. In particular, seasonal variation in FGM levels suggests that spring may be more physically demanding for pikas, a trend also found in another small population of pikas on NWT (Whipple et al. Citation2021). Further, poor quality habitats seemed to amplify the effects of seasonal events, especially in spring. Climate change is expected to cause more extreme events, such as increased wildfires, more extreme temperatures, and shifts in precipitation. For species living in extreme environments that experience regular perturbations, adding new stressors to the mix may overtax the individual to the point that they can no longer cope (Wingfield, Kelley, and Angelier Citation2011). This could have huge conservation implications for climatically sensitive species that live in extreme environments. Female arctic ground squirrels (Urocitellus parryii) living in habitats with short growing seasons exhibited higher fecal corticosterone metabolite (FCM) levels and produced offspring with higher FCM levels than females living in habitats with longer growing seasons (Sheriff et al. Citation2017). However, females living in habitats with short growing seasons were larger and in better body condition, probably driven by selection of robust phenotypes that could better cope with the poor habitat conditions (Sheriff et al. Citation2017). Similarly, alpine chipmunks (Tamias alpinus) living in less climatically suitable habitats, as indicated by ecological niche models, and in areas that experience higher daily maximum temperatures exhibited higher FGM levels, indicating that their environment may be challenging their physiological limits (Hammond, Palme, and Lacey Citation2018).
Given the effects of season we observed, management actions, such as habitat modifications, that consider season may provide the most benefit for pika conservation. Likewise, management plans for other climate-sensitive species like caribou (Rangifer tarandus granti) and polar bears (Ursus maritimus) have recommended protection of seasonal habitats as a critical component for conservation (Western Arctic Caribou Herd Working Group Citation2019; U.S. Fish and Wildlife Service Citation2016, respectively). As conservationists and managers begin to take actions for the 30×30 initiative (preserving 30 percent of the planet’s land and water by 2030), we suggest that alpine habitats containing active rock glaciers be considered for future conservation areas. Not only are active rock glaciers important microhabitats for pikas but they could also similarly provide key climate refugia for other mountain-dwelling animals and plants (C. I. Millar et al. Citation2015). Further research is needed to characterize current rock glacier status and distribution, as well as recent changes to this distribution, across Western North America. This would also be an invaluable resource for future conservation of mountain ecosystems.
During the summer, the ice within rock glaciers can continue to provide water to surrounding vegetation, creating dense and nutritious plant communities (C. I. Millar and Westfall Citation2010; C. I. Millar, Westfall, and Delany Citation2013). In the Sierra Nevada range and Great Basin, this dense vegetation contains a higher diversity of shrubs and herbaceous plants, compared to surrounding alpine and subalpine habitats not associated with a rock glacier (C. I. Millar and Westfall Citation2010; C. I. Millar, Westfall, and Delany Citation2013). Additionally, the prolonged water resource can help surrounding plants survive during drought conditions and could provide biotic refugia for arthropods during warmer and drier climates (C. I. Millar and Westfall Citation2010; C. I. Millar et al. Citation2015).
Despite their importance to the broader ecosystem, ice features such as rock glaciers and permafrost are declining as a result of warmer temperatures in summer and fall (Leopold et al. Citation2015). Estimates suggest that if current average temperatures were to increase by 2°C, ~94 percent of permafrost would be lost along the Front Range of Colorado (Janke Citation2005). However, decline in ice will likely respond slowly to warming temperatures and possibly even slower in rock glacier habitats where the ice is protected by a rocky carapace (Janke Citation2005; C. I. Millar and Westfall Citation2008; but see Monk and Ray Citation2022). For pikas, which some estimates predict could be extirpated from some of our study sites by 2100 (Schwalm et al. Citation2016), active rock glaciers may contain overlooked microrefugia that could help the species persist and should be considered in future species distribution modeling research.
Supplemental Material
Download Zip (19.9 KB)Acknowledgments
We thank the following individuals for aiding in field and/or lab efforts: Elliot Martin, Nadiv Edelstein, Micaela Seaver, Claire Atkins, Ryan Agabani, Airy Adriana Peralta, Angie Rodriguez, Troy Tanner, and Brad Schrom. We also thank Andrew Martin, Steven Schmidt, and Christopher Lowry for the use of their lab space and equipment. The findings and conclusions in this article are those of the authors and do not necessarily represent the views of the U.S. Fish and Wildlife Service.
Disclosure statement
No potential conflict of interest was reported by the authors.
Data availability statement
The data that support the findings of this study are openly available in the Environmental Data Initiative repository at https://doi.org/10.6073/pasta/929e2f61cb0926cf58ebac09d187148f, and https://doi.org/10.6073/pasta/b15009b35926522f75e43e1e9a861d64.
Supplementary material
Supplemental data for this article can be accessed online at https://doi.org/10.1080/15230430.2022.2146633
Additional information
Funding
References
- Baker, M. R., K. S. Gobush, and C. H. Vynne. 2013. Review of factors influencing stress hormones in fish and wildlife. Journal for Nature Conservation 21 (5):309–18. doi:10.1016/j.jnc.2013.03.003.
- Barsch, D. 1996. Rockglaciers indicators for the present and former geoecology in high mountain environments. Berlin Heidelberg: Springer.
- Barton, K. 2022. MuMIn: Multi-model inference. R package version 1.46.0. https://CRAN.R-project.org/package=MuMIn
- Bates, D., M. Mächler, B. Bolker, and S. Walker. 2015. Fitting linear mixed-effects models using lme4. Journal of Statistical Software 67 (1). doi: 10.18637/jss.v067.i01.
- Beck, J. L., and J. M. Peek. 2005. Great Basin summer range forage quality: Do plant nutrients meet elk requirements? Western North American Naturalist 65 (4):516–27.
- Beever, E. A., P. F. Brussard, and J. Berger. 2003. Patterns of apparent extirpation among isolated populations of pikas (Ochotona princeps) in the Great Basin. Journal of Mammalogy 84 (1):37–54. doi:10.1644/1545-1542(2003)084<0037:POAEAI>2.0.CO;2.
- Beever, E. A., J. D. Perrine, T. Rickman, M. Flores, J. P. Clark, C. Waters, S. S. Weber, B. Yardley, D. Thoma, T. Chesley-Preston, et al. 2016. Pika (Ochotona princeps) losses from two isolated regions reflect temperature and water balance, but reflect habitat area in a mainland region. Journal of Mammalogy 97 (6):1495–511. doi:10.1093/jmammal/gyw128.
- Beever, E. A., C. Ray, P. W. Mote, and J. L. Wilkening. 2010. Testing alternative models of climate-mediated extirpations. Ecological Applications 20 (1):164–78. doi:10.1890/08-1011.1.
- Beever, E. A., C. Ray, J. L. Wilkening, P. F. Brussard, and P. W. Mote. 2011. Contemporary climate change alters the pace and drivers of extinction. Global Change Biology 17 (6):2054–70. doi:10.1111/j.1365-2486.2010.02389.x.
- Bhattacharyya, S., and C. Ray. 2015. Of plants and pikas: Evidence for a climate-mediated decline in forage and cache quality. Plant Ecology & Diversity 8:5–6, 781–794. doi:10.1080/17550874.2015.1121520.
- Breuner, C. W., B. Delehanty, and R. Boonstra. 2013. Evaluating stress in natural populations of vertebrates: Total CORT is not good enough. Functional Ecology 27:24–36. doi:10.1111/1365-2435.12016.
- Burnham, K. P., and D. R. Anderson. 2002. Model selection and multi-model inference: A practical information - theoretical approach. New York: Springer. doi:10.1007/B97636.
- Calkins, M. T., E. A. Beever, K. G. Boykin, J. K. Frey, and M. C. Andersen. 2012. Not-so-splendid isolation: Modeling climate-mediated range collapse of a montane mammal Ochotona princeps across numerous ecoregions. Ecography 35:1–12. doi:10.1111/j.1600-0587.2011.07227.x.
- Camp, M. J., L. Shipley, J. Varner, and B. D. Waterhouse. 2020. Activity patterns and foraging behavior of American pikas (Ochotona princeps) differ between Craters of the Moon and alpine talus in Idaho. Western North American Naturalist 80 (1):49–69. doi:10.3398/064.080.0106.
- Castillo, J. A., C. W. Epps, A. R. Davis, and S. A. Cushman. 2014. Landscape effects on gene flow for a climate-sensitive montane species. Molecular Ecology 23:843–56. doi:10.1111/mec.12650.
- Chen, I., J. K. Hill, R. Ohlemüller, D. B. Roy, and C. D. Thomas. 2011. Rapid range shifts of species of associated with high levels of climate warming. Science 333 (August):1024–26. doi:10.1126/science.1206432.
- Coppes, J., J. L. Kämmerle, M. Willert, A. Kohnen, R. Palme, and V. Braunisch. 2018. The importance of individual heterogeneity for interpreting faecal glucocorticoid metabolite levels in wildlife studies. Journal of Applied Ecology 55 (4):2043–54. doi:10.1111/1365-2664.13140.
- Dantzer, B., Q. E. Fletcher, R. Boonstra, and M. J. Sheriff. 2014. Measures of physiological stress: A transparent or opaque window into the status, management and conservation of species? Conservation Physiology 2 (1):1–18. doi:10.1093/conphys/cou023.
- Daubenmire, R. F. 1959. A canopy-coverage method of vegetation analysis. Northwest Scientific 33:43–64.
- Dearing, M. D. 1996. Disparate determinants of summer and winter diet selection of a generalist herbivore, Ochotona princeps. Oecologia 108 (3):467–78. doi:10.1007/BF00333723.
- Dearing, M. D. 1997. The function of haypiles of pikas (Ochotona princeps). Journal of Mammalogy 78 (4):1156–63. doi:10.2307/1383058.
- Delehanty, B., and R. Boonstra. 2011. Coping with intense reproductive aggression in male arctic ground squirrels: The stress axis and its signature tell divergent stories. Physiological and Biochemical Zoology: Ecological and Evolutionary Approaches 84 (4):417–28. doi:10.1086/660809.
- Elliott, C. L., and J. T. Flinders. 1984. Plant nutrient levels on two summer ranges in the River of No Return Wilderness Area, Idaho. The Great Basin Naturalist 44 (4):621–26.
- Ellis, R. D., T. J. McWhorter, and M. Maron. 2012. Integrating landscape ecology and conservation physiology. Landscape Ecology 27 (1):1–12. doi:10.1007/s10980-011-9671-6.
- Erb, L. P., C. Ray, and R. Guralnick. 2011. On the generality of a climate-mediated shift in the distribution of the American pika (Ochotona princeps). Ecology 92:1730–35. https://about.jstor.org/terms.
- Galbreath, K. E., D. J. Hafner, and K. R. Zamudio. 2009. When cold is better: Climate-driven elevation shifts yield complex patterns of diversification and demography in an alpine specialist (American Pika, Ochotona Princeps). Evolution 63 (11):2848–63. doi:10.1111/j.l558-5646.2009.00803.x.
- Grayson, D. K. 2005. A brief history of Great Basin pikas. Journal of Biogeography 32 (12):2103–11. doi:10.1111/j.1365-2699.2005.01341.x.
- Guralnick, R., L. Erb, C. Ray. 2012. Mammalian distributional responses to climatic changes: A review and research prospectus. In Ecological consequences of climate change: Mechanisms, conservation, and management, ed. J. Balant and E. Beever, 85–104. New York: CRC Press. doi:10.1201/b11179-8 .
- Hafner, D. J. 1993. North American Pika (Ochotona princeps) as a Late Quaternary biogeographic indicator species. Quaternary Research 39:373–80. doi:10.1006/qres.1993.1044.
- Hafner, D. J. 1994. Pikas and permafrost: Post-Wisconsin historical zoogeography of Ochotona in the Southern Rocky Mountains, U.S.A. Arctic and Alpine Research 26 (4):375–82. doi:10.2307/1551799.
- Hammond, T. T., R. Palme, and E. A. Lacey. 2018. Glucocorticoid–environment relationships align with responses to environmental change in two co-occurring congeners. Ecological Applications: a Publication of the Ecological Society of America 28:1683–93. doi:10.1002/eap.1781.
- Henry, P., A. Henry, and M. A. Russello. 2012. Variation in habitat characteristics of American pikas along an elevation gradient at their northern range margin. Northwest Science 86 (4):346–50. doi:10.3955/046.086.0410.
- Homyack, J. A. 2010. Evaluating habitat quality of vertebrates using conservation physiology tools. Wildlife Research 37 (4):332–42. doi:10.1071/wr08093.
- Huntly, N. J., A. T. Smith, and B. L. Ivins. 1986. Foraging behavior of the pika (Ochotona princeps), with comparisons of grazing versus haying. Journal of Mammalogy 67 (1):139–48. doi:10.1644/870.1.Key.
- Janke, J. R. 2005. Modeling past and future alpine permafrost distribution in the Colorado Front Range. Earth Surface Processes and Landforms 30 (12):1495–508. doi:10.1002/esp.1205.
- Janke, J. R. 2007. Colorado Front Range rock glaciers: Distribution and topographic characteristics. Arctic, Antarctic, and Alpine Research 39 (1):74–83. doi:10.1657/1523-0430(2007)39[74:CFRRGD]2.0.CO;2.
- Jeffress, M. R., T. J. Rodhouse, C. Ray, S. Wolff, and C. W. Epps. 2013. The idiosyncrasies of place: Geographic variation in the climate – Distribution relationships of the American pika. Ecological Applications 23 (4):864–78. doi:10.1890/12-0979.1.
- Jeffress, M. R., K. J. van Gunst, and C. I. Millar. 2017. A surprising discovery of American pika sites in the Northwestern Great Basin. Western North American Naturalist 77 (2):252–68. doi:10.3398/064.077.0213.
- Keay, J. M., J. Singh, M. C. Gaunt, and T. Kaur. 2006. Fecal glucocorticoids and their metabolites as indicators of stress in various mammalian species: A literature review. Journal of Zoo and Wildlife Medicine 37 (3):234–44. doi:10.1638/05-050.1.
- Kitaysky, A. S., E. V. Kitaiskaia, J. F. Piatt, and J. C. Wingfield. 2006. A mechanistic link between chick diet and decline in seabirds? Proceedings of the Royal Society B: Biological Sciences 273 (1585):445–50. doi:10.1098/rspb.2005.3351.
- Krear, H. R. 1965. An ecological and ethological study of the pika (Ochotona princeps saxatilis Bang) in the Front Range of Colorado. Dissertation. University of Colorado, Boulder, Colorado, USA.
- Lafferty, D. J. R., M. Zimova, L. Clontz, K. Hackländer, and L. S. Mills. 2019. Noninvasive measures of physiological stress are confounded by exposure. Scientific Reports 9 (1):19170. December. PMID: 31844125; PMCID: PMC6915565. doi:10.1038/s41598-019-55715-5.
- Lamb, C. T., K. M. Robson, and M. A. Russello. 2014. Development and application of a molecular sexing protocol in the climate change-sensitive American pika. Conservation Genetics Resources 6 (1):17–19. doi:10.1007/s12686-013-0034-2.
- Lavergne, S. G., M. J. L. Peers, G. Mastromonaco, Y. N. Majchrzak, A. Nair, S. Boutin, and R. Boonstra. 2020. Hair cortisol as a reliable indicator of stress physiology in the snowshoe hare: Influence of body region, sex, season, and predator–prey population dynamics. General and Comparative Endocrinology 294:113471. 0016-6480. doi:10.1016/j.ygcen.2020.113471.
- Lea, J. M. D., S. L. Walker, G. I. H. Kerley, J. Jackson, S. C. Matevich, and S. Shultz. 2018. Non-invasive physiological markers demonstrate link between habitat quality, adult sex ratio and poor population growth rate in a vulnerable species, the Cape mountain zebra. Functional Ecology 32 (2):300–12. doi:10.1111/1365-2435.13000.
- Leopold, M., G. Lewis, D. Dethier, N. Caine, and M. W. Williams. 2015. Cryosphere: Ice on Niwot Ridge and in the Green Lakes Valley, Colorado Front Range. Plant Ecology & Diversity 8 (5–6):625–38. doi:10.1080/17550874.2014.992489.
- Leopold, M., M. W. Williams, N. Caine, J. Völkel, and D. Dethier. 2011. Internal structure of the Green Lake 5 Rock Glacier, Colorado Front Range, USA. Permafrost and Periglacial Processes 22 (2):107–19. doi:10.1002/ppp.706.
- MacArthur, R. A., and L. C. H. Wang. 1974. Behavioral thermoregulation in the pika Ochotona princeps: A field study using radiotelemetry. Canadian Journal of Zoology 52 (3):353–58. doi:10.1139/z74-042.
- MacDougall-Shackleton, S. A., F. Bonier, L. M. Romero, and I. T. Moore. 2019. Glucocorticoids and “stress” are not synonymous. Integrative Organismal Biology 1 (1): PMID: 33791532; PMCID: PMC7671118. doi:10.1093/iob/obz017.
- Madliger, C. L., and O. P. Love. 2014. The need for a predictive, context-dependent approach to the application of stress hormones in conservation. Conservation Biology 28 (1):283–87. doi:10.1111/cobi.12185.
- McEwen, B. S., and J. C. Wingfield. 2003. The concept of allostasis in biology and biomedicine. Hormones and Behavior 43 (1):2–15. doi:10.1016/S0018-506X(02)00024-7.
- Millar, J. S. 1972. Timing of breeding of pikas in southwestern Alberta. Canadian Journal of Zoology 50 (5):665–69. doi:10.1139/z72-091.
- Millar, C. I., and R. D. Westfall. 2008. Rock glaciers and related periglacial landforms in the Sierra Nevada, CA, USA; inventory, distribution and climatic relationships. Quaternary International 188 (1):90–104. doi:10.1016/j.quaint.2007.06.004.
- Millar, C. I., and R. D. Westfall. 2010. Distribution and climatic relationships of the American pika (Ochotona princeps) in the Sierra Nevada and Western Great Basin, U.S.A.; periglacial landforms as refugia in warming climates. Arctic, Antarctic, and Alpine Research 42 (1):76–88. doi:10.1657/1938-4246-42.1.76.
- Millar, C. I., R. D. Westfall, and D. L. Delany. 2013. Thermal and hydrologic attributes of rock glaciers and periglacial talus landforms: Sierra Nevada, California, USA. Quaternary International 310:169–80. doi:10.1016/j.quaint.2012.07.019.
- Millar, C. I., R. D. Westfall, and D. L. Delany. 2014. Thermal regimes and snowpack relations of periglacial Talus Slopes, Sierra Nevada, California, U.S.A. Arctic, Antarctic, and Alpine Research 46 (2):483–504. doi:10.1657/1938-4246-46.2.483.
- Millar, C. I., R. D. Westfall, and D. L. Delany. 2016. Thermal components of American pika habitat — How does a small lagomorph encounter climate? Arctic, Antarctic, and Alpine Research 48 (2):327–43. doi:10.1657/AAAR0015-046.
- Millar, C. I., R. D. Westfall, A. Evenden, J. G. Holmquist, J. Schmidt-Gengenbach, R. S. Franklin, J. Nachlinger, and D. L. Delany. 2015. Potential climatic refugia in semi-arid, temperate mountains: Plant and arthropod assemblages associated with rock glaciers, talus slopes, and their forefield wetlands, Sierra Nevada, California, USA. Quaternary International 387:106–21. doi:10.1016/j.quaint.2013.11.003.
- Monk, E. M., and C. Ray. 2022. Revisiting talus and free-air temperatures after 50 years of change at an American pika (Ochotona princeps) study site in the Southern Rockies. PLOS Climate 1 (7):e0000049. doi:10.1371/journal.pclm.0000049.
- Mote, P. W., A. F. Hamlet, M. P. Clark, and D. P. Lettenmaier. 2005. Declining mountain snowpack in Western North America. Bulletin of the American Meteorological Society 86 (1):38–49. doi:10.1130/2008.2435(05).
- Moyer-Horner, L., P. D. Mathewson, G. M. Jones, M. R. Kearney, and W. P. Porter. 2015. Modeling behavioral thermoregulation in a climate change sentinel. Ecology and Evolution 5 (24):5810–22. doi:10.1002/ece3.1848.
- Navarro-Castilla, Á., and I. Barja. 2019. Stressful living in lower-quality habitats? Body mass, feeding behavior and physiological stress levels in wild wood mouse populations. Integrative Zoology 14:114–26. PMID: 30019837. doi:10.1111/1749-4877.12351.
- Nichols, L. B. 2010. Fecal pellets of American pikas (Ochotona princeps) a crude chronometer for dating patch occupancy. Western North American Naturalist 70 (4):500–07. doi:10.3398/064.070.0410.
- Nichols, L. B., K. B. Klingler, and M. M. Peacock. 2016. American pikas (Ochotona princeps) extirpated from the historic Masonic Mining District of Eastern California Western North American Naturalist 76 (2):163–71. doi:10.3398/064.076.0203.
- Palme, R., P. Fischer, H. Schildorfer, and M. N. Ismail. 1996. Excretion of infused 14C-steroid hormones via faeces and urine in domestic livestock. Animal Reproduction Science 43:43–63. doi:10.1016/0378-4320(95)01458-6.
- Ray, C., E. A. Beever, and T. J. Rodhouse. 2016. Distribution of a climate-sensitive species at an interior range margin. Ecosphere 7 (6):1–23. doi:10.1002/ecs2.1379.
- R Core Team. (2018). R: A language and environment for statistical computing. https://www.r-project.org/
- Reeder, D. M., and K. M. Kramer. 2005. Stress in free-ranging mammals: Integrating physiology, ecology, and natural history. Journal of Mammalogy 86 (2):225–35. doi:10.1644/bhe-003.1.
- Roach, W. J., N. Huntly, and R. Inouye. 2001. Talus fragmentation mitigates the effects of pikas, Ochotona princeps, on high alpine meadows. Oikos 92 (2):315–24. doi:10.1034/j.1600-0706.2001.920214.x.
- Rodhouse, T. J., E. A. Beever, L. K. Garrett, K. M. Irvine, M. R. Jeffress, M. Munts, and C. Ray. 2010. Distribution of American pikas in a low-elevation lava landscape: Conservation implications from the range periphery. Journal of Mammalogy 91 (5):1287–99. doi:10.1644/09-MAMM-A-334.1.Key.
- Rodhouse, T. J., M. Hovland, and M. R. Jeffress. 2017. Variation in subsurface thermal characteristics of microrefuges used by range core and peripheral populations of the American pika (Ochotona princeps). Ecology and Evolution 7 (5):1514–26. doi:10.1002/ece3.2763.
- Rodhouse, T. J., M. R. Jeffress, K. R. Sherrill, S. R. Mohren, N. J. Nordensten, M. L. Magnuson, D. Schwalm, J. A. Castillo, M. Shinderman, and C. W. Epps. 2018. Geographical variation in the influence of habitat and climate on site occupancy turnover in American pika (Ochotona princeps). Diversity & Distributions 24 (11):1506–20. doi:10.1111/ddi.12791.
- Romero, L. M., M. J. Dickens, and N. E. Cyr. 2009. The reactive scope model - A new model integrating homeostasis, allostasis, and stress. Hormones and Behavior 55 (3):375–89. doi:10.1016/j.yhbeh.2008.12.009.
- Romero, L. M., and J. M. Reed. 2005. Collecting baseline corticosterone samples in the field: Is under 3 min good enough? Comparative Biochemistry and Physiology 140 (1):73–79. doi:10.1016/j.cbpb.2004.11.004.
- Sapolsky, R. M., L. M. Romero, and A. U. Munck. 2000. How do glucocorticoids influence stress responses? Integrating permissive, suppressive, stimulatory, and preparative actions. Endocrine Reviews 21 (1):55–89. doi:10.1210/edrv.21.1.0389.
- Schwalm, D., C. W. Epps, T. J. Rodhouse, W. B. Monahan, J. A. Castillo, C. Ray, and M. R. Jeffress. 2016. Habitat availability and gene flow influence diverging local population trajectories under scenarios of climate change: A place-based approach. Global Change Biology 22 (4):1572–84. doi:10.1111/gcb.13189.
- Sharp, P. L. 1973. Behavior of the pika (Ochotona princeps) in the Kananaskis region of Alberta. Unpublished M.S. Thesis, University of Alberta, Edmonton, 107 pp.
- Sheriff, M. J., R. Boonstra, R. Palme, C. L. Buck, and B. M. Barnes. 2017. Coping with differences in snow cover: The impact on the condition, physiology and fitness of an Arctic hibernator. Conservation Physiology 5 (1). doi: 10.1093/conphys/cox065.
- Sheriff, M. J., B. Dantzer, B. Delehanty, R. Palme, and R. Boonstra. 2011. Measuring stress in wildlife: Techniques for quantifying glucocorticoids. Oecologia 166 (4):869–87. doi:10.1007/s00442-011-1943-y.
- Sheriff, M. J., H. Wheeler, S. A. Donker, C. J. Krebs, R. Palme, D. S. Hik, and R. Boonstra. 2012. Life on a mountainside: Coping with environmental variation. Journal of Zoology 287:65–75. doi:10.1111/j.1469-7998.2011.00888.x.
- Smith, A. T. 1974. The distribution and dispersal of pikas: Influences of behavior and climate. Ecology 55:1368–76. doi:10.2307/1935464.
- Smith, A. T. 1978. Comparative demography of pikas (Ochotona): Effect of spatial and temporal age-specific mortality. Ecology 59 (1):133–39. doi:10.2307/1936639.
- Smith, A. B., E. A. Beever, A. E. Kessler, A. N. Johnston, C. Ray, C. W. Epps, H. C. Lanier, R. C. Klinger, T. J. Rodhouse, J. Varner, et al. 2019. Alternatives to genetic affinity as a context for within-species response to climate. Nature Climate Change 9 (10):787–94. doi:10.1038/s41558-019-0584-8.
- Smith, J. A., and L. P. Erb. 2013. Patterns of selective caching behavior of a generalist herbivore, the American pika (Ochotona princeps). Arctic, Antarctic, and Alpine Research 45 (3):396–403. http://www.jstor.org/stable/24551630.
- Smith, A. T., and B. L. Ivins. 1983. Colonization in a pika population: Dispersal vs Philopatry. Behavioral Ecology and Sociobiology 13:37–47. doi:10.1007/BF00295074.
- Smith, A. T., and B. L. Ivins. 1984. Spatial relationships and social organization in adult pikas: A facultatively monogamous mammal. Zeitschrift Für Tierpsychologie 66 (4):289–308. doi:10.1111/j.1439-0310.1984.tb01370.x.
- Smith, J. E., R. Monclús, D. Wantuck, G. L. Florant, and D. T. Blumstein. 2012. Fecal glucocorticoid metabolites in wild yellow-bellied marmots: Experimental validation, individual differences and ecological correlates. General and Comparative Endocrinology 178 (2):417–26. doi:10.1016/j.ygcen.2012.06.015.
- Smith, A. T., J. D. Nagy, and C. I. Millar. 2016. Behavioral ecology of American pikas (Ochotona princeps) at Mono Craters, California: Living on the edge. Western North American Naturalist 76 (4):459. doi:10.3398/064.076.0408.
- Smith, A. T., and M. L. Weston. 1990. Ochotona princeps. Mammalian Species 352:1–8. doi:10.2307/3504319/2600639.
- Stewart, J. A. E., J. D. Perrine, L. B. Nichols, J. H. Thorne, C. I. Millar, K. E. Goehring, C. P. Massing, and D. H. Wright. 2015. Revisiting the past to foretell the future: Summer temperature and habitat area predict pika extirpations in California. Journal of Biogeography 42 (5):880–90. doi:10.1111/jbi.12466.
- Stewart, J. A. E., and D. H. Wright. 2012. Assessing persistence of the American pika at historic localities in California’s northern Sierra Nevada. Wildlife Society Bulletin 36 (4):759–64. doi:10.1002/wsb.220.
- Stewart, J. A. E., D. H. Wright, and K. A. Heckman. 2017. Apparent climate-mediated loss and fragmentation of core habitat of the American pika in the Northern Sierra Nevada, California, USA. PLoS ONE 12 (8):1–17. doi:10.1371/journal.pone.0181834.
- Tapper, S. 1973. The spatial oranization of pikas (Ochotona),and its effect on population recruitment. Unpublished Ph.D. Dissertation, University of Alberta, Edmonton, 154 pp.
- USDA Forest Service. 2019. Conservation Strategy for the California Spotted Owl (Strix occidentalis occidentalis) in the Sierra Nevada. Publication R5-TP-043.
- U.S. Fish and Wildlife Service. 2016. Polar bear (Ursus maritimus) conservation management plan, final. In U.S. Fish and Wildlife, Region 7, Anchorage: Alaska. 104.
- Varner, J., and M. D. Dearing. 2014. The importance of biologically relevant microclimates in habitat suitability assessments. PLoS ONE 9 (8):e104648. doi:10.1371/journal.pone.0104648.
- Varner, J., M. S. Lambert, J. J. Horns, S. Laverty, L. Dizney, E. A. Beever, and M. D. Dearing. 2015. Too hot to trot? Evaluating the effects of wildfire on patterns of occupancy and abundance for a climate-sensitive habitat specialist. International Journal of Wildland Fire 24 (7):921–32. doi:10.1071/WF15038.
- Western Arctic Caribou Herd Working Group. (2019). Western Arctic caribou herd cooperative management plan - December 2019. 54 pp.
- Whalley, W. B., and H. E. Martin. 1992. Rock glaciers: II models and mechanisms. Progress in Physical Geography: Earth and Environment 16 (2):127–86. doi:10.1177/030913339201600201.
- Whipple, A. L., C. Ray, M. Wasser, J. N. Kitchens, A. A. Hove, J. Varner, and J. L. Wilkening. 2021. Temporal vs. spatial variation in stress-associated metabolites within a population of climate-sensitive small mammals. Conservation Physiology 9 (1):1–15. doi:10.1093/conphys/coab024.
- Wilkening, J. L., E. J. Cole, and E. A. Beever. 2019. Evaluating mechanisms of plant-mediated effects on herbivore persistence and occupancy across an ecoregion. Ecosphere 10 (6). doi: 10.1002/ecs2.2764.
- Wilkening, J. L., and C. Ray. 2016. Characterizing predictors of survival in the American pika (Ochotona princeps). Journal of Mammalogy 97 (5):1366–75. doi:10.1093/jmammal/gyw097.
- Wilkening, J. L., C. Ray, E. A. Beever, and P. F. Brussard. 2011. Modeling contemporary range retraction in Great Basin pikas (Ochotona princeps) using data on microclimate and microhabitat. Quaternary International 235:77–88. doi:10.1016/j.quaint.2010.05.004.
- Wilkening, J. L., C. Ray, and K. L. Sweazea. 2013. Stress hormone concentration in Rocky Mountain populations of the American pika (Ochotona princeps). Conservation Physiology 1:1–13. doi:10.1093/conphys/cot027.Introduction.
- Wilkening, J. L., C. Ray, and J. Varner. 2015. Relating sub-surface ice features to physiological stress in a climate sensitive mammal, the American pika (Ochotona princeps). PLoS ONE 10 (3):1–17. doi:10.1371/journal.pone.0119327.
- Wilkening, J. L., C. Ray, and J. Varner. 2016. When can we measure stress noninvasively? Postdeposition effects on a fecal stress metric confound a multiregional assessment. Ecology and Evolution 6 (2):502–13. doi:10.1002/ece3.1857.
- Wingfield, J., J. P. Kelley, and F. Angelier. 2011. What are extreme environmental conditions and how do organisms cope with them? Current Zoology 57. doi:10.1093/czoolo/57.3.363.
- Wood, S. N. 2011. Fast stable restricted maximum likelihood and marginal likelihood estimation of semiparametric generalized linear models. Journal of the Royal Statistical Society: Series B, Statistical Methodology 73 (1):3–36. doi:10.1111/j.1467-9868.2010.00749.x.