
 ?Mathematical formulae have been encoded as MathML and are displayed in this HTML version using MathJax in order to improve their display. Uncheck the box to turn MathJax off. This feature requires Javascript. Click on a formula to zoom.
ABSTRACT
Arctic warming and changing precipitation patterns are altering soil nutrient availability and other processes that control the greenhouse gas balance of high-latitude ecosystems. Changes to these biogeochemical processes will ultimately determine whether the Arctic will enhance or dampen future climate change. At the Cape Bounty Arctic Watershed Observatory, a full-factorial International Tundra Experiment site was established in 2008, allowing for the investigation of ten years of experimental warming and increased snow depth on nutrient availability and trace gas exchange in a mesic heath tundra across two growing seasons (2017 and 2018). Plots with open-top chambers (OTCs) had drier soils (p < .1) that released 1.5 times more carbon dioxide (p < .05), and this effect was enhanced in the drier growing season. Increased snow depth delayed the onset of thaw and active layer development (p < .1) and corresponded with greater nitrous oxide release (p < .05). Our results suggest that decreases to soil moisture will lead to an increase in nitrate availability, soil respiration, and nitrous oxide fluxes. Ultimately, these effects may be moderated by the magnitude of future shifts and interactions between climate variability and ecological responses to permafrost thaw.
Introduction
Since 1979, the Arctic has warmed nearly four times faster than the global mean (Rantanen et al. Citation2022) and this warming is expected to have profound impacts on arctic terrestrial ecosystems. Climate warming at high latitudes is expected to increase precipitation inputs (Bintanja and Andry Citation2017) and lengthen the growing season (Park et al. Citation2016), both of which can alter biogeochemical processes and the net carbon (C) balance (Shaver et al. Citation1992). The seasonal thaw of the active layer releases plant-limiting nutrients like nitrogen (N), which can create positive or negative feedbacks on the climate system through enhanced greenhouse gas (GHG) uptake or release via plant and soil microbial activity. It is important to understand the interactions between changes in temperature, precipitation, and nutrient availability and their impacts on net GHG fluxes in high latitude ecosystems to predict potential feedbacks to climate change.
Plant growth in arctic regions is typically limited by low temperatures, short growing seasons, and low available nutrients (Shaver et al. Citation1998). Results from experimental warming studies have shown that temperature increases can stimulate belowground microbial activity and N mineralization in a typically N-limited environment (Rustad et al. Citation2001; Schimel, Bilbrough, and Welker Citation2004; Biasi et al. Citation2008). However, this does not always result in increased plant-available N (Sistla et al. Citation2013). Though some incubation and in situ studies have found increases in inorganic N availability as a result of natural and experimental warming (Binkley et al. Citation1994; Salmon et al. Citation2016), other studies have found no significant changes to soil inorganic N in subarctic (Lavoie, Mack, and Schuur Citation2011; Voigt et al. Citation2017) or high Arctic (Schmidt, Jonasson, and Michelsen Citation1999) ecosystems exposed to warming. Schmidt, Jonasson, and Michelsen (Citation1999) attributed this lack of change to the concurrent increase in N immobilization, resulting in low net N mineralization rates. Changes in soil N availability also have implications for GHG release; for example, methane (CH4) uptake can be impeded by ammonium (NH4+) due to their similar molecular size (Bodelier and Laanbroek Citation2004), and changes in N cycling processes could alter nitrous oxide (N2O) production via nitrification or denitrification. Due to the close coupling of the N and C cycles, it is important to understand how changes to both temperature and precipitation will alter N dynamics in the high Arctic to better predict changes to C cycling processes.
Climate warming and subsequent soil temperature increases can also impact sources and sinks of greenhouse gases depending on moisture and vegetation characteristics. In subarctic upland tundra, Voigt et al. (Citation2017) found that experimental warming increased the emissions of carbon dioxide (CO2), CH4, and N2O, shifting from a sink to a source for all three gases. However, experimental warming observations from a mesic tundra site in the Canadian high Arctic found a 30 percent increase in gross ecosystem productivity but no change in ecosystem respiration, reducing the source potential of this environment (Welker et al. Citation2004). Similarly, a long-term experimental warming experiment from the same Canadian high Arctic site found a limited response of greenhouse gas fluxes to increased temperature (Lamb et al. Citation2011). A comparative analysis across various high-latitude environments found the respiration response of arctic tundra environments to be the determining driver of annual source or sink potential (Grogan and Chapin Citation2000; Oberbauer et al. Citation2007). Much of the aforementioned research investigated temperature effects on GHG fluxes, but few studies have explored the interactions between changes in temperature and enhanced winter precipitation (snow cover) and their influence on nutrient availability and GHG fluxes in Northern environments.
A large proportion of precipitation in the Arctic currently comes as snowfall, although models are projecting future shifts from a snowfall-dominated to rainfall-dominated arctic region by 2100 (Bintanja and Andry Citation2017). This potential precipitation shift has implications for subnivean soil thermal regimes, because snow has insulating properties to warm soils in areas of accumulation and regulate thermal diffusivity (Romanovsky and Osterkamp Citation2000). Enhanced snow depth has been found to correspond with increased microbial activity (Buckeridge and Grogan Citation2008), increased N mineralization (Schimel, Bilbrough, and Welker Citation2004), increased leaf N, and higher photosynthetic rates (Leffler and Welker Citation2013). This increased nutrient availability could also influence the release of other important GHGs (e.g., CH4 and N2O), although this has yet to be examined. Release of GHGs from microbial activity can be mitigated in part through uptake by vegetation; however, results from in situ studies and models demonstrate that changes to vegetation composition as a result of warming and changing precipitation are unique to plant communities and dependent on underlying environmental conditions (Edwards and Henry Citation2016; van der Kolk et al. Citation2016). This is particularly important when considering the local impacts of different species: increased shrub growth can increase underlying ground temperature (Wilcox et al. Citation2019), and wetland plants can act as conduits for GHG release (Andresen et al. Citation2017; Wagner et al. Citation2019). Using long-term in situ experimental studies, we can explore the interactions between enhanced snow accumulation, the soil environment, soil nutrient availability, vegetation cover, and net GHG release and how these interactions might change with climate warming.
In this study, we investigated the impact of ten years of experimental warming and increased snow deposition on N availability and CO2, CH4, and N2O fluxes across two growing seasons in the high Arctic. Experimental warming studies have existed for almost three decades (Marion et al. Citation1997), with several examining changes in plant phenology (Henry and Molau Citation1997; Aerts, Cornelissen, and Dorrepaal Citation2006; Bjorkman et al. Citation2020), GHG production (Welker, Fahnestock, and Jones Citation2000; Oberbauer et al. Citation2007; Natali et al. Citation2011), and changes in available nutrient pools (Salmon et al. Citation2016). Experimental warming studies have also been coupled to snow manipulation studies to examine the effects on net GHG fluxes (Welker, Fahnestock, and Jones Citation2000; Ravn, Elberling, and Michelsen Citation2020). However, few have examined how changes in soil nutrient availability could influence net GHG fluxes under warming and enhanced snow depth treatments and the interactions between these factors.
Data and methods
Study area
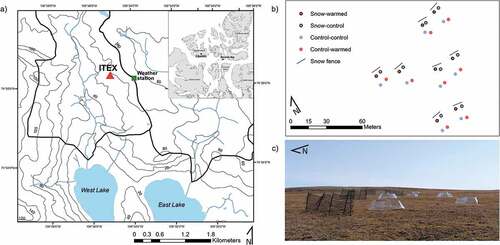
This research was conducted in mesic heath tundra at the Cape Bounty Arctic Watershed Observatory (CBAWO), Melville Island, Nunavut (74°54′ N, 109°35′ W) in July 2017 and 2018. The CBAWO is an ~30 km2 research area in the continuous permafrost zone with a 0.5- to 1-m-thick active layer (). Two adjacent watersheds drain into the West and East Lakes (unofficial names), which feed into Viscount Melville Sound. The growing season occurs from June to August, peaking in late July, with the exact duration of plant growth depending on interannual variability in weather conditions. Soils have developed from a foundation of glacial activity and early Holocene marine sediment (Hodgson, Vincent, and Fyles Citation1984). Vegetation cover within the CBAWO is quite heterogeneous, with vegetation communities distributed along a soil moisture gradient determined by topographic variability (Hung and Treitz Citation2020). Mean summer temperatures (JJA) from 2003 to 2017 were 2.7°C ± 1.4°C with annual average precipitation limited to <150 mm (Beel et al. Citation2020).
Figure 1. (a) Location of CBAWO within the Canadian high Arctic (inset) and the ITEX site within the CBAWO. (b) Close-up of the eight replicate sites with four plots (SW, SC, CW, and CC) within each site within ITEX. Each of these sites has two plots with OTCs deployed for enhanced warming and a snow fence for increased snow deposition. (c) Photo of snow fences and OTCs deployed in the field.
Experimental design
The study area is a mesic heath tundra with a long-term experimental warming design initiated in 2008 as part of the International Tundra Experiment (ITEX; Henry and Molau Citation1997). This mesic heath tundra is characterized by a mix of bare ground, moss cover, and patches of graminoids (i.e., Eriophorum spp.), forbs (i.e., Ranunculus nivalis and Potentilla vahliana), and prostrate shrubs (i.e., Salix arctica). Moss cover is typically <1 cm thick, overlaying an ~5-cm organic layer. Warming is accomplished using open-top chambers (OTCs) made of translucent plexiglass panes angled slightly inwards to trap heat without impeding precipitation (Molau and Molgaard Citation1996). This increases near-surface temperatures within the OTCs by 1°C to 3°C (Henry and Molau Citation1997), which simulates predicted temperature increases for the region (Arctic Monitoring and Assessment Programme Citation2021). Snow fences (1 m tall, 7 m wide) were placed perpendicular to the prevailing winter wind direction (northwest) and upwind of the OTCs, allowing snow to build up near the fence on the leeward side (). This experimental design is one of the few ITEX sites in the Canadian high Arctic that examines experimental warming and enhanced snow deposition in a full-factorial design and has been used to explore the main effects and interactions among these treatments on plant phenology and net CO2 exchange (Arruda Citation2016). Each treatment was replicated eight times for a total of thirty-two plots (). OTCs were left in place for the entire year.
Within each replicate, two plots were within the snow accumulation zone (roughly 2 m) of the fence (enhanced snow). In this accumulation zone, one plot was equipped with an OTC to test for the effect of increased temperature and snow cover (snow-warmed, SW), whereas the other was not equipped with an OTC (snow control, SC). Outside of the snow accumulation zone, two plots were established, one equipped with an OTC (control-warmed, CW) and one without (control-control, CC).
Environmental measurements
Soil moisture, soil temperature, and active layer depth were measured weekly at sampling sites adjacent to the locations of the ion exchange resins (IERs) and gas flux measurements. Soil moisture was measured at 0- to 5-cm depth using a ML-3 Theta probe with data captured on a HH2 Soil Moisture Meter. Soil temperature was measured at 5-cm depth using a standard soil temperature probe. Active layer depth was measured using a steel rod inserted into the ground until reaching frozen ground. A local meteorological station provided hourly temperature and precipitation data. To compare growing seasons, growing degree days (GDD) were identified using Equation (1):
where Tmax and Tmin are the daily temperature maximum and minimum, respectively, and Tbase is the base temperature of 5°C, which was used to represent the threshold temperature above which plants are productive (Weijers et al. Citation2013).
Soil nitrogen availability
IER membranes were used to determine soil N availability for each experimental treatment and were prepared using protocols developed by Qian and Schoenau (Citation2005). These resin membranes work in cation and anion pairs to adsorb ions to their surface, which can then be extracted and analyzed through lab techniques. Cation and anion exchange resins (2.5 cm × 10 cm) were cut from membrane sheets obtained from Membranes International Incorporated. Cation and anion strips were first stripped clean using 0.5 M hydrochloric acid for 24 hours with agitation. Strips were then soaked in 0.5 M sodium bicarbonate for 5 hours with gentle agitation to saturate sites with sodium and bicarbonate ions. The anion strips were also soaked in a 0.01 M ethylenediaminetetraacetic acid solution for 1 hour with agitation to enhance phosphorus adsorption. The resins were deployed in the field using a knife to make a slit in the soil and then placing the strip into the slit. Resin strips sampled NH4+ and nitrate (NO3−) availability in the top 10 cm of soil and remained in the field for two weeks at a time with a total of two deployments across the 2017 growing season (early: 1–16 July; late: 16–26 July) and two deployments in 2018 (early: 11–21 July; late: 21 July–4 August). Timing discrepancies between the study years were due to logistical challenges in accessing the field site. When removed from the soil, the resins were cleaned and rinsed with deionized water, bagged, refrigerated, kept in the dark, and returned to Queen’s University for analysis.
IER membranes were extracted in groups of ten strips (five cation and five anion) creating an integrated result for each plot; consequently, single values for each ion of interest were generated for each of the thirty-two plots. Combining the five strips helped to keep solution concentrations above the instrument detection limit, beause arctic environments tend to have low levels of available N. The strips were extracted by soaking in 400 mL of 0.5 M hydrochloric acid for 1 hour with 40 rpm agitation. Eluants were analyzed using the Astoria2 Analyzer automated colorimetric system calibrated between 0 and 2 ppm to measure NH4+-N and NO3−-N. The phenolate method was used to determine NH4+-N concentrations and the cadmium reduction method was employed for determining NO3−-N concentrations (Pansu and Gautheyrou Citation2006). Quality control steps included processing one duplicate every ten samples, one blank every thirty samples, and one drift standard every forty-five samples to correct for instrumentation drift. All samples were processed twice and averaged. No samples exhibited levels below the detection limit.
Trace gas sampling
Trace gas fluxes were measured using opaque, static, non-steady-state chambers attached to collars using methods from Wagner et al. (Citation2019). The chambers were made of 20-cm-diameter PVC pipe with a height of 4.7 cm; one side was sealed with a plexiglass plate containing holes for Swagelok fittings. The entire chamber was covered with reflective insulation to keep the inside dark and to reflect the sun and minimize heating inside the chamber. A short vent tube sized according to Hutchinson and Moisier (Citation1981) and a gas sampling line fitted with a three-way stopcock were attached to the Swagelok fittings. Prior to flux measurements, chambers were vented with atmospheric air by holding them into the wind to ensure ambient gas concentrations prior to sampling. The chamber was sealed to a collar (same material, ~15 cm in height, with at least 5 cm inserted into the ground) using a rubber gasket. Headspace samples were collected after 0, 5, 15 and 45 minutes from sealing the chamber to the collar. At each sample time, the air inside the chamber was mixed by manually pumping a 30-mL syringe three times. After the last pumping, a 25-mL headspace sample was collected and injected into a 12-mL preevacuated glass vial, double-sealed with a silicone and rubber septum to prevent leakage; each vial contained 2 mL of magnesium perchlorate as a desiccant. Vials were pressurized to ensure that any leakage occurred from inside to out (i.e., no change in the gas concentrations in the vial). Trace gas samples were collected once a week from the beginning of July 2017 (mid-July in 2018) until late July in both 2017 and 2018, for a total of three measurements per collar in both study years. Samples for all thirty-two collars were made on the same day between 10:00 a.m. and 5:00 p.m., and the order of sampling was the same across dates.
Concentrations of CH4, CO2, and N2O were determined by gas chromatography at Carleton University (Wilson and Humphreys Citation2010). The gas chromatograph (CP 3800) was equipped with a flame ionization detector (run at 300°C) and a methanizer (run at 350°C) and used a helium carrier gas at 30 mL min−1. Gas separation was obtained using a Haysep N 80/100 precolumn (0.32 cm diameter and 50 cm length) as well as Poropak QS 80/100 mesh analytical columns (0.32 cm diameter and 200 cm length) in a column oven kept at 50°C. To maintain quality control and establish a calibration between the chromatogram area and gas concentration, three replicates of five standards (ranging from 0.88 to 20 ppm for CH4, from 360 to 15,346 ppm for CO2, and from 0.3 to 1.33 ppm for N2O) as well as helium blanks were included in every 100 samples (Wilson and Humphreys Citation2010).
Gas flux rates were calculated using Equation (2):
where nair is moles of air within the chamber volume, mr is linear rate of change in mixing ratio over time, and A is the area of the chamber (Wagner et al. Citation2019). Moles of air within the chamber were determined using the ideal gas law; pressure and air temperature were taken from the nearby weather station, and volume was based on the chamber volume plus the collar volume. Positive flux values represent trace gas release from the ecosystem into the atmosphere, whereas negative flux values represent trace gas uptake by the ecosystem. Samples exhibiting negative CO2 fluxes were eliminated from analysis, because we suspected that leakage occurred during sampling or storage because photosynthesis cannot occur under dark conditions. Fluxes were averaged so that they fell within the same three time periods as the N availability measurements. CO2 and CH4 fluxes are reported in µg C m−2 s−1 and ng C m−2 s−1, respectively, and N2O fluxes in ng N m−2 s−1 using the molar masses of C and N.
Statistical analysis
Repeated measures analysis of variance was conducted in IBM SPSS 26 (IBM Corp. Citation2019) to assess main treatment effects (warming, enhanced snow, year) and their two-way interactions, with seasonality as the within-subjects factor; other higher-order interactions were moved to the error term. For all tests, residuals were assessed for normality (Shapiro-Wilk test) and extreme outliers (outside of 1.5 × the interquartile range) were removed. Homogeneity of variance (Levene’s test of equality of error variances) was also assessed, and data not meeting the aforementioned criteria were log-transformed prior to analysis.
Results
Impact of snow enhancement, warming, interannual variability, and seasonality
Environmental variables
In 2017, there were 27.3 GDD (base 5°C; GDD5), in contrast to 2018, which had 16.9 GDD5. During this time, the average growing season air temperature for 2017 was 7.3°C with 39.2 mm total rainfall, and the average growing season temperature for 2018 was 6.7°C with 76.8 mm total rainfall (Figure S1).
Soil temperatures were marginally warmer in the wetter year of 2018 and warmed significantly throughout the sampling period (), with temperatures peaking in late July. The Snow × Warming interaction was significant for soil temperature (p < .1; Table S1), with warmed plots under ambient snow conditions having the highest soil temperatures. However, there was no significant warming effect of OTCs on soil temperature. Enhanced snow depth had a marginally significant effect on dampening active layer development (), with active layer depths averaging 51.2 cm in plots without enhanced snow depth and 48.9 cm in plots under enhanced snow depth conditions. The warmer, drier year of 2017 also had significantly greater active layer development (51.5 cm in 2017 vs. 48.5 cm in 2018; ). There was also an Enhanced Snow Depth × Seasonality effect and an Enhanced Snow Depth × Year effect on active layer depths (p < .05; Table S1), with increases in active layer development across the growing season most pronounced under enhanced snow conditions in the drier year. The Enhanced Snow × Warming interaction was significant for active layer depths (p < .05; Table S1), with warmed plots under ambient snow conditions having the deepest active layers. Experimental warming had a marginally significant drying effect on soil moisture (p < .1), with soils within OTCs being ~4 percent drier on average than those in control plots. Soil moisture significantly increased across the growing seasons (p < .05), but there was no effect of enhanced snow depth or sampling year on moisture conditions ().
Figure 2. The effects of enhanced snow depth on (a) soil temperature, (b) active layer depth, (c) soil moisture, (d) NH4+ availability, (e) NO3− availability, (f) CO2 release, (g) CH4 flux, and (h) N2O flux in 2017 and 2018. Shaded box plots indicate significance at p < .05; grayed box plots indicated significance at p < .1.
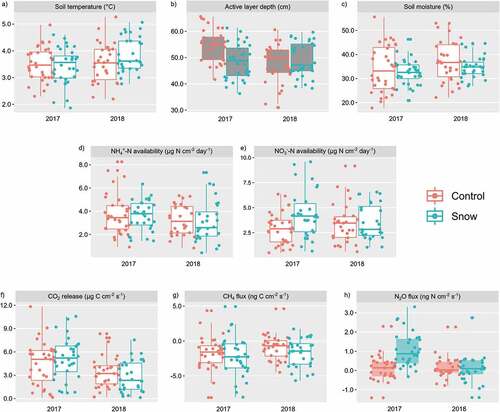
Figure 3. The effects of experimental warming on (a) soil temperature, (b) active layer depth, (c) soil moisture, (d) NH4+ availability, (e) NO3− availability, (f) CO2 release, (g) CH4 flux, and (h) N2O flux in 2017 and 2018. Shaded box plots indicate significance at p < .05; grayed box plots indicate significance at p < .1.
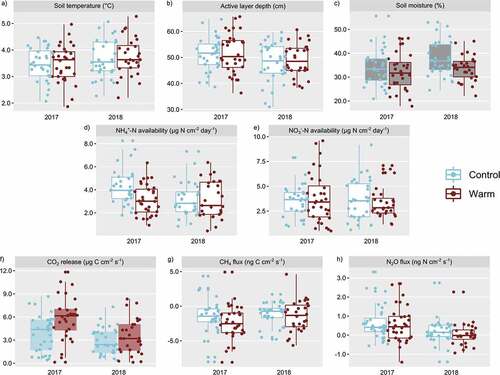
Table 1. Four-way repeated measures analysis of variance results for assessing the main effects of enhanced snow depth, warming, and study year (between subjects) and within study years (within subjects) on soil temperature, active layer depth, soil moisture, NH4+-N availability, NO3−-N availability, CO2 release, CH4 flux, and N2O flux.
Soil nitrogen availability
Differences in NH4+-N availability were not significant across the two study years or across enhanced snow and warming treatments (). NH4+-N availability increased significantly across the growing season in both years, with late-season NH4+-N availability greater than in the early season. Contrary to seasonal patterns of NH4+-N availability, NO3−-N availability significantly decreased across the growing season (Figure S2b). Though the wetter year (2018) had slightly more available NO3−-N than 2017, these differences were not significant (). Year and seasonality interacted significantly (Table S1), with the wetter year (i.e., 2018) having a more significant decrease in NO3−-N across the growing season (Figure S2b).
Trace gas release
On average, CO2 production in the drier growing season (2017) was significantly greater than that of the 2018 growing season (), releasing 5.21 and 3.15 μg C m−2 s−1, respectively. Plots within OTCs released significantly more CO2 than nonwarmed plots (5.11 vs. 3.38 μg C m−2 s−1, respectively; ). Growing season and study year had a significant interaction, with CO2 release greatest in the early season of 2017. There was also a significant Warming × Season interaction (Table S1), with warmed sites in the early season releasing more CO2 relative to the later season (Figure S3a). Enhanced snow depth had no significant impact on CO2 release.
Overall, all treatments were net CH4 sinks in both years (), and the differences between years was not significant (), although there was a significant Year × Season interaction (Table S1). Enhanced snow depth and warming had no significant effect on CH4 fluxes.
Nitrous oxide fluxes were significantly higher in 2017 than in 2018 (0.60 vs. 0.13 ng N m−2 s−1, respectively). Plots under enhanced snow depth had significantly higher rates of N2O production (; ), and there was a significant enhanced snow depth and year interaction (Table S1), with the greatest amount of N2O release in 2017 under enhanced snow conditions. Warming, however, did not have any significant effect on N2O fluxes. Though not statistically significant (p = .12), N2O release declined across the growing season (Figure S3c) and corresponded with significant declines in NO3−-N availability (p < .05).
Discussion
Warming effects on ecosystem processes
In this study, experimental warming had no significant effect on soil temperature or active layer depth. OTCs are intended to increase near-surface temperatures within the plexiglass panes by 1°C to 3°C (Henry and Molau Citation1997); thus, we expected to see a marginal effect of experimental warming on soil temperatures at 5-cm depth. We suspect that the lack of warming in the OTCs may be an artifact of extended snow accumulation around and within the plots (Makoto Citation2014), thereby delaying the onset of thaw and the growing season. Alternatively, the relatively late start of the experimental monitoring in this study (1 July and 18 July for 2017 and 2018, respectively) may not have allowed for early season treatment differences (e.g., thaw onset and subsequent temperature changes) to be captured. Previous monitoring at this site in 2015 and 2016 showed that treatment differences on environmental conditions were most significant in mid- to late June before tapering off in the mid- to late growing season (Arruda Citation2016). The later study date start, impacted by logistical access, may not have captured early season warming and thaw, resulting in a lack of significant effect of experimental warming on soil temperature and active layer depth.
Plots within the OTCs enclosures experienced a marginally significant drying effect (i.e., reduced soil moisture). The effect of soil drying due to OTCs has been documented in studies in northern Tibet (Shen et al. Citation2016), northern Sweden (Richardson et al. Citation2019), and more generally across polar and alpine regions (Bokhorst et al. Citation2013). This drying effect corresponded with a significant increase in CO2 release within OTC plots (p < .05). Though increased respiration may not be attributed to any effect of soil temperature, due to the lack of any influence of OTC on temperatures, these results suggest that soil moisture conditions are a significant determinant of CO2 exchange processes during the growing season (Shen et al. Citation2016). Additionally, the significant effect of OTCs on CO2 release demonstrates a sustained effect of ten years of experimental warming on decomposition processes and soil respiration, likely aided by increases in the soil C pool from permafrost thaw over the ten-year period. It is also possible that this increase in CO2 production may be due to increased mineralization of older soil C, as has been noted in northern Alaska soils (Lavoie, Mack, and Schuur Citation2011; Natali et al. Citation2015). This effect will likely be enhanced under warmer, drier conditions, as has been found in warming and water table manipulation experiments in Alaskan tundra (Natali et al. Citation2015).
Incubation and experimental warming studies have shown that increased temperatures can enhance rates of ecosystem processes, leading to increased organic matter decomposition and subsequent soil respiration (Lavoie, Mack, and Schuur Citation2011), N mineralization (Binkley et al. Citation1994), and nitrate production (Salmon et al. Citation2016). We expected that warmed plots would have higher NH4+-N and NO3−-N availability and that this would promote higher effluxes of CO2, CH4, and N2O. Data over the two years showed no significant effects of enhanced snow depth or experimental warming treatments on N availability. This could point to a new state of equilibrium being reached by the environment, where initial increases of available N were depleted through plant uptake during the years immediately after establishment of the experimental warming plots but microbial demand for available N remained high. Similar findings have been shown by Hartley et al. (Citation1999), where the authors found a short-lived response to warming of increased soil N mineralization that diminished by the fifth year of warming. Furthermore, this longer-term response may be due in part to shifts in aboveground plant community structure (Sistla et al. Citation2013). At this ITEX site, Arruda (Citation2016) found increases in all major plant functional group cover (bryophytes, graminoids, forbs, and prostrate shrub) in all plots across a six-year period, which may have contributed to the lack of net change to N availability. There was a significant Year × Seasonality effect on NO3−-N availability in this study, suggesting combined factors of intra- and interannual variability on nitrification processes. Though this study lacked any effects of warming alone on N availability, the significant growing season differences and divergent responses of N availability across the two study years (Figure S2) suggest that combined effects of environmental conditions will likely drive variability in soil N dynamics.
Enhanced snow depth effects on environmental conditions and N2O fluxes
The insulating effect of snow on soil temperature and the subsequent stimulation of ecosystem processes due to warming has been shown in field settings with the use of snow fences (Schimel, Bilbrough, and Welker Citation2004; Mörsdorf et al. Citation2019). Though no significant effect of enhanced snow depth was found on soil temperature in this study, the effect of enhanced snow was demonstrated here on active layer depth (p < .1) by delaying snowmelt, resulting in a shorter thaw season (Wipf and Rixen Citation2010). Deepened snow has also been found to increase available N forms in Alaska (Schimel, Bilbrough, and Welker Citation2004), Svalbard (Mörsdorf et al. Citation2019), and generally across the Circumpolar North (Xu et al. Citation2021); however, no significant effect of enhanced snow on N availability was observed here. Snow accumulation within OTCs likely confounded any snow fence effect on soil temperature and soil moisture, N availability, and CO2 release, because the enhanced snow may have delayed the onset of the growing season for snow-insulated plots.
There was a significant enhanced snow effect on N2O release (p < .01), and this was particularly evident during the drier year (2017), where N2O release was four times greater in the SW plots than the rest of the environment. The higher fluxes of N2O from SW plots in 2017 coincided with the highest availability of NO3−-N in SW plots, which suggests the production of N2O during nitrification. Ultimately, the role of enhanced snow depth on N2O release may impact the GHG balance of this system if high snow conditions persist, but this will depend in part on the supply of organic matter available to fuel N2O production.
Role of seasonality and interannual variability on plant available nitrogen and greenhouse gas balance
Though the impact of key factors on environmental variables was often surprising (e.g., the lack of a warming effect on temperature), the impact of intra- and interannual variability on biogeochemical processes across all plots was clear. Statistical analyses showed significant differences across the growing season for active layer development, which was likely driven by late-season precipitation (Figure S1). This seasonal active layer deepening corresponded with intra-annual increases in NH4+-N availability in 2017 and both inorganic N species in 2018. In future years, seasonal environmental conditions that dictate active layer development will likely dictate N availability and subsequent plant growth and GHG balance.
When comparing the two study years, 2018 had nearly double the amount of growing season rainfall compared to the prior study year. This corresponded with higher soil moisture, impeding nitrification, resulting in low N2O fluxes. In contrast, drier conditions in 2017 enhanced NO3−-N availability and contributed to the site being a net source for N2O, likely through nitrification. Concurrently, greater CO2 release in the drier year (p < .05) reflects decomposition aided by more aerobic conditions. Considered together, these results point to moisture availability via late-season precipitation inputs (i.e., rainfall) as a driving factor behind the GHG source or sink potential of this mesic heath tundra in the high Arctic. Similar findings have been reported elsewhere, where tundra moisture availability dictates the dominant biogeochemical pathway that leads to either GHG release or uptake (Huemmrich et al. Citation2010; Voigt et al. Citation2017; Wagner et al. Citation2019). In this environment, interannual variability due to climate will impact soil moisture conditions, which will dictate the GHG source or sink potential by moderating soil N availability and subsequent biogeochemical processes.
Conclusion
This study examined the impact of ten years of experimental warming and enhanced snow depth, and their interaction, on soil environmental conditions, plant available nitrogen, and greenhouse gas dynamics across two growing seasons. Currently, few factorial warming and snow accumulation experiments exist in the Arctic, particularly in the understudied high Arctic. Here, we found plots within OTCs to have lower water content than those in ambient conditions, resulting in greater CO2 release as a result of more aerobic conditions allowing respiration to occur. Snow accumulation from snow fences within OTCs likely delayed the onset of thaw, contributing to a lack of any significant effect of enhanced snow depth on biogeochemical processes. Most notable, effects of intra- and interannual variability on environmental conditions were reflected across all plots, regardless of treatment effects. Active layer development driven by late-season rainfall corresponded with increases in the inorganic N pool. Though this was only demonstrated across two study years, moisture and N availability are key controls on the GHG balance of this high Arctic mesic tundra, which will largely be moderated by future shifts and interactions between high-latitude seasonality (Bintanja and van der Linden Citation2013), precipitation (Beel et al. Citation2021), and responses to permafrost thaw (Schuur and Mack Citation2018).
Data availability
Data from this work is publicly available on the Borealis data repository: http://doi.org/10.5683/SP2/P6U9J8.
Supplemental Material
Download Zip (510.4 KB)Acknowledgments
Thank you to Sandra Yaacoub and Cole Robertson for assistance in resin extractions. We acknowledge and are grateful for the opportunity to conduct research on traditional Inuit territory. The authors also thank two anonymous reviewers for their helpful comments on earlier drafts of the article.
Disclosure statement
No potential conflict of interest was reported by the authors.
Supplementary material
Supplemental data for this article can be accessed online at https://doi.org/10.1080/15230430.2023.2178428
Additional information
Funding
References
- Aerts, R., J. H. C. Cornelissen, and E. Dorrepaal. 2006. Plant performance in a warmer world: General responses of plants from cold, northern biomes and the importance of winter and spring events. Plant Ecology 182 (1–2):65–12. doi:10.1007/s11258-005-9031-1.
- Andresen, C. G., M. J. Lara, C. E. Tweedie, and V. L. Lougheed. 2017. Rising plant-mediated methane emissions from Arctic wetlands. Global Change Biology 23 (3):1128–39. doi:10.1111/gcb.13469.
- Arctic Monitoring and Assessment Programme. 2021. Arctic climate change update 2021: Key trends and impacts. Summary for policy-makers. Tromsø, Norway: Arctic Monitoring and Assessment Programme (AMAP).
- Arruda, S. Z. 2016. Impacts of enhanced temperature and snow deposition on senescence date, vegetation cover, and CO2 exchange in a Canadian High Arctic mesic ecosystem. Master’s Thesis, Queen’s University.
- Beel, C., J. K. Heslop, J. F. Orwin, M. A. Pope, A. J. Schevers, J. K. Y. Hung, M. J. Lafrenière, and S. F. Lamoureux. 2021. Emerging dominance of summer rainfall driving High Arctic terrestrial-aquatic connectivity. Nature Communications 12 (1):1448. doi:10.1038/s41467-021-21759-3.
- Beel, C., S. F. Lamoureux, J. F. Orwin, M. A. Pope, M. J. Lafrenière, and N. A. Scott. 2020. Differential impact of thermal and physical permafrost disturbances on High Arctic dissolved and particulate fluvial fluxes. Scientific Reports 10 (1):11836. doi:10.1038/s41598-020-68824-3.
- Biasi, C., H. Meyer, O. Rusalimova, R. Hämmerle, C. Kaiser, C. Baranyi, H. Daims, N. Lashchinsky, P. Barsukov, and A. Richter. 2008. Initial effects of experimental warming on carbon exchange rates, plant growth and microbial dynamics of a lichen-rich dwarf shrub tundra in Siberia. Plant and Soil 307 (1–2):191–205. doi:10.1007/s11104-008-9596-2.
- Binkley, D., R. Stottlemyer, F. Suarez, and J. Cortina. 1994. Soil nitrogen availability in some Arctic ecosystems in northwest Alaska: Responses to temperature and moisture. Ecoscience 1 (1):64–70. doi:10.1080/11956860.1994.11682229.
- Bintanja, R., and O. Andry. 2017. Towards a rain-dominated Arctic. Nature Climate Change 7 (4):263–67. doi:10.1038/nclimate3240.
- Bintanja, R., and E. C. van der Linden. 2013. The changing seasonal climate in the Arctic. Scientific Reports 3:1–8. doi:10.1038/srep01556.
- Bjorkman, A. D., M. García Criado, I. H. Myers-Smith, V. Ravolainen, I. S. Jónsdóttir, K. B. Westergaard, J. P. Lawler, M. Aronsson, B. Bennett, H. Gardfjell, et al. 2020. Status and trends in Arctic vegetation: Evidence from experimental warming and long-term monitoring. Ambio 49 (3):678–92. doi:10.1007/s13280-019-01161-6.
- Bodelier, P. L. E., and H. J. Laanbroek. 2004. Nitrogen as a regulatory factor of methane oxidation in soils and sediments. FEMS Microbiology Ecology 47 (3):265–77. doi:10.1016/S0168-6496(03).
- Bokhorst, S., A. Huiskes, R. Aerts, P. Convey, E. J. Cooper, L. Dalen, B. Erschbamer, J. Gudmundsson, A. Hofgaard, R. D. Hollister, et al. 2013. Variable temperature effects of open top chambers at polar and alpine sites explained by irradiance and snow depth. Global Change Biology 19 (1):64–74. doi:10.1111/gcb.12028.
- Buckeridge, K. M., and P. Grogan. 2008. Deepened snow alters soil microbial nutrient limitations in Arctic birch hummock tundra. Applied Soil Ecology 39 (2):210–22. doi:10.1016/j.apsoil.2007.12.010.
- Edwards, M., and G. H. R. Henry. 2016. The effects of long-term experimental warming on the structure of three High Arctic plant communities. Journal of Vegetation Science 27 (5):904–13. doi:10.1111/jvs.12417.
- Grogan, P., and I. S. Chapin. 2000. Initial effects of experimental warming on above- and belowground components of net ecosystem CO2 exchange in Arctic tundra. Oecologia 125 (4):512–20. doi:10.1007/s004420000490.
- Hartley, A. E., C. Neill, J. M. Melillo, R. Crabtree, F. P. Bowles, A. E. Hartley, C. Neill, J. M. Melillo, R. Crabtree, F. P. Bowles, et al. 1999. Plant performance and soil nitrogen mineralization in response to simulated climate change in subarctic dwarf shrub heath. Oikos 86 (2):331–43. doi:10.2307/3546450.
- Henry, G. H. R., and U. Molau. 1997. Tundra plants and climate change: The International Tundra Experiment (ITEX). Global Change Biology 3 (SUPPL. 1):1–9. doi:10.1111/j.1365-2486.1997.gcb132.x.
- Hodgson, D. A., J. S. Vincent, and J. G. Fyles. 1984. Quaternary geology of central Melville Island, Northwest Territories. In Geological survey of Canada, Paper 83-1. Ottawa, Canada: Geological Survey of Canada. doi:10.4095/119784.
- Huemmrich, K. F., G. Kinoshita, J. A. Gamon, S. Houston, H. Kwon, and W. C. Oechel. 2010. Tundra carbon balance under varying temperature and moisture regimes. Journal of Geophysical Research 115:1–8. doi:10.1029/2009jg001237.
- Hung, J. K. Y., and P. Treitz. 2020. Environmental land-cover classification for integrated watershed studies: Cape Bounty, Melville Island, Nunavut. Arctic Science 6 (4):404–22. doi:10.1139/as-2019-0029.
- Hutchinson, G. L., and A. R. Moisier. 1981. Improved soil cover method for field measurements of nitrous oxide fluxes. Soil Science Society of Americal Journal 45 (2):311–16. doi:10.2136/sssaj1981.03615995004500020017x.
- IBM Corp. 2019. IBM SPSS statistics for windows, version 26.0. Armonk, NY: IBM Corp.
- Lamb, E. G., S. Han, B. D. Lanoil, G. H. R. Henry, M. E. Brummell, S. Banerjee, and S. D. Siciliano. 2011. A High Arctic soil ecosystem resists long-term environmental manipulations. Global Change Biology 17 (10):3187–94. doi:10.1111/j.1365-2486.2011.02431.x.
- Lavoie, M., M. C. Mack, and E. A. G. Schuur. 2011. Effects of elevated nitrogen and temperature on carbon and nitrogen dynamics in Alaskan Arctic and boreal soils. Journal of Geophysical Research: Biogeosciences 116 (3):1–14. doi:10.1029/2010JG001629.
- Leffler, A. J., and J. M. Welker. 2013. Long-term increases in snow pack elevate leaf N and photosynthesis in Salix arctica: Responses to a snow fence experiment in the High Arctic of NW Greenland. Environmental Research Letters 8 (2):025023. doi:10.1088/1748-9326/8/2/025023.
- Makoto, K. 2014. Tips for the next phase of winter climate-change study in plant-soil systems. Ecological Research 29 (4):511–15. doi:10.1007/s11284-014-1171-0.
- Marion, G. M., G. H. R. Henry, D. W. Freckman, J. Johnstone, G. Jones, M. H. Jones, E. Lévesque, U. Molau, P. Mølgaard, A. N. Parsons, et al. 1997. Open-top designs for manipulating field temperature in high-latitude ecosystems. Global Change Biology 3 (SUPPL. 1):20–32. doi:10.1111/j.1365-2486.1997.gcb136.x.
- Molau, U., and P. Mølgaard. 1996. International tundra experiment (ITEX) manual. Copenhagen, Denmark: Danish Polar Center.
- Mörsdorf, M. A., N. S. Baggesen, N. G. Yoccoz, A. Michelsen, B. Elberling, P. L. Ambus, and E. J. Cooper. 2019. Deepened winter snow significantly influences the availability and forms of nitrogen taken up by plants in High Arctic tundra. Soil Biology and Biochemistry 135 (January):222–34. doi:10.1016/j.soilbio.2019.05.009.
- Natali, S. M., E. A. G. Schuur, M. Mauritz, J. D. Schade, G. Celis, K. G. Crummer, C. Johnston, J. Krapek, E. Pegoraro, V. G. Salmon, et al. 2015. Permafrost thaw and soil moisture driving CO2 and CH4 release from upland tundra. Journal of Geophysical Research: Biogeosciences 120 (3):525–37. doi:10.1002/2014JG002872.
- Natali, S. M., E. A. G. Schuur, C. Trucco, C. E. Hicks Pries, K. G. Crummer, and A. F. Baron Lopez. 2011. Effects of experimental warming of air, soil and permafrost on carbon balance in Alaskan tundra. Global Change Biology 17 (3):1394–407. doi:10.1111/j.1365-2486.2010.02303.x.
- Oberbauer, S. F., C. E. Tweedie, J. M. Welker, J. T. Fahnestock, G. H. R. Henry, P. J. Webber, R. D. Hollister, M. D. Walker, A. Kuchy, E. Elmore, et al. 2007. Tundra CO2 fluxes in response to experimental warming across latitudinal and moisture gradients. Ecological Monographs 77 (2):221–38. doi:10.1890/06-0649.
- Pansu, M., and J. Gautheyrou. 2006. Inorganic forms of nitrogen. In Handbook of soil analysis: Mineralogical, organic and inorganic methods, 767–792. Heidelberg, Germany: Springer Berlin. doi:10.1007/978-3-540-31211-6.
- Park, T., S. Ganguly, H. Tømmervik, E. S. Euskirchen, K.-A. Høgda, S. R. Karlsen, V. Brovkin, R. R. Nemani, and R. B. Myneni. 2016. Changes in growing season duration and productivity of northern vegetation inferred from long-term remote sensing data. Environmental Research Letters 11 (8):084001. doi:10.1088/1748-9326/11/8/084001.
- Qian, P., and J. J. Schoenau. 2005. Use of ion-exchange membrane to assess nitrogen-supply power of soils. Journal of Plant Nutrition 28 (12):2193–200. doi:10.1080/01904160500324717.
- Rantanen, M., A. Y. Karpechko, A. Lipponen, K. Nordling, O. Hyvärinen, K. Ruosteenoja, T. Vihma, and A. Laaksonen. 2022. The Arctic has warmed nearly four times faster than the globe since 1979. Nature Communications Earth and Environment 3 (168):1–10. doi:10.1038/s43247-022-00498-3.
- Ravn, N. R., B. Elberling, and A. Michelsen. 2020. Arctic soil carbon turnover controlled by experimental snow addition, summer warming and shrub removal. Soil Biology and Biochemistry 142 (November 2019):107698. doi:10.1016/j.soilbio.2019.107698.
- Richardson, S. J., M. C. Press, A. N. Parsons, and S. E. Hartley. 2019. How do nutrients and warming impact on plant communities and their insect herbivores? A 9‐year study from a sub‐Arctic heath. British Ecological Society 90 (3):544–56.
- Romanovsky, V. E., and T. E. Osterkamp. 2000. Effects of unfrozen water on heat and mass transport processes in the active layer and permafrost. Permafrost and Periglacial Processes 11 (3):219–39. doi:10.1002/1099-1530(200007/09)11:3<219::AID-PPP352>3.0.CO;2-7
- Rustad, L. E., J. L. Campbell, G. M. Marion, R. J. Norby, M. J. Mitchell, A. E. Hartley, J. H. C. Cornelissen, J. Gurevitch, R. Alward, C. Beier, et al. 2001. A meta-analysis of the response of soil respiration, net nitrogen mineralization, and aboveground plant growth to experimental ecosystem warming. Oecologia 126 (4):543–62. doi:10.1007/s004420000544.
- Salmon, V. G., P. Soucy, M. Mauritz, G. Celis, S. M. Natali, M. C. Mack, and E. A. G. Schuur. 2016. Nitrogen availability increases in a tundra ecosystem during five years of experimental permafrost thaw. Global Change Biology 22 (5):1927–41. doi:10.1111/gcb.13204.
- Schimel, J. P., C. Bilbrough, and J. M. Welker. 2004. Increased snow depth affects microbial activity and nitrogen mineralization in two Arctic tundra communities. Soil Biology and Biochemistry 36 (2):217–27. doi:10.1016/j.soilbio.2003.09.008.
- Schmidt, I. K., S. Jonasson, and A. Michelsen. 1999. Mineralization and microbial immobilization of N and P in Arctic soils in relation to season, temperature and nutrient amendment. Applied Soil Ecology 11 (2–3):147–60. doi:10.1016/S0929-1393(98).
- Schuur, E. A. G., and M. C. Mack. 2018. Ecological response to permafrost thaw and consequences for local and global ecosystem services. Annual Review of Ecology, Evolution, and Systematics 49:279–301. doi:10.1146/annurev-ecolsys-121415-032349.
- Shaver, G. R., W. D. Billings, F. S. Chapin, A. E. Giblin, K. J. Nadelhoffer, W. C. Oechel, and E. B. Rastetter. 1992. Global change and the carbon balance of arctic ecosystems. BioScience 42 (6):433–41. doi:10.2307/1311862.
- Shaver, G. R., L. C. Johnson, D. H. Cades, G. Murray, J. A. Laundre, E. B. Rastetter, K. J. Nadelhoffer, and A. E. Giblin. 1998. Biomass and CO2 flux in wet sedge tundras: Responses to nutrients, temperature, and light. Ecological Monographs 68 (1):75–97. doi:10.1890/0012-9615(1998)068[0075:.
- Shen, Z. X., J. W. Wang, W. Sun, S. W. Li, G. Fu, X. Z. Zhang, Y. J. Zhang, C. Q. Yu, P. L. Shi, and Y. T. He. 2016. The soil drying along the increase of warming masks the relation between temperature and soil respiration in an alpine meadow of northern Tibet. Polish Journal of Ecology 64 (1):125–29. doi:10.3161/15052249PJE2016.64.1.011.
- Sistla, S. A., J. C. Moore, R. T. Simpson, L. Gough, G. R. Shaver, and J. P. Schimel. 2013. Long-term warming restructures Arctic tundra without changing net soil carbon storage. Nature 497 (7451):615–17. doi:10.1038/nature12129.
- van der Kolk, H. J., M. M. P. D. Heijmans, J. van Huissteden, J. W. M. Pullens, and F. Berendse. 2016. Potential Arctic tundra vegetation shifts in response to changing temperature, precipitation and permafrost thaw. Biogeosciences 13 (22):6229–45. doi:10.5194/bg-13-6229-2016.
- Voigt, C., R. E. Lamprecht, M. E. Marushchak, S. E. Lind, A. Novakovskiy, M. Aurela, P. J. Martikainen, and C. Biasi. 2017. Warming of subarctic tundra increases emissions of all three important greenhouse gases – carbon dioxide, methane, and nitrous oxide. Global Change Biology 23 (8):3121–38. doi:10.1111/gcb.13563.
- Wagner, I., J. K. Y. Hung, A. Neil, and N. A. Scott. 2019. Net greenhouse gas fluxes from three High Arctic plant communities along a moisture gradient. Arctic Science 5 (4):185–201. doi:10.1139/as-2018-0018.
- Weijers, S., F. Wagner-Cremer, U. Sass-Klaassen, R. Broekman, and J. Rozema. 2013. Reconstructing High Arctic growing season intensity from shoot length growth of a dwarf shrub. Holocene 23 (5):721–31. doi:10.1177/0959683612470178.
- Welker, J. M., J. T. Fahnestock, G. H. R. Henry, K. W. O’Dea, and R. A. Chimner. 2004. CO2 exchange in three Canadian High Arctic ecosystems: Response to long-term experimental warming. Global Change Biology 10 (12):1981–95. doi:10.1111/j.1365-2486.2004.00857.x.
- Welker, J. M., J. T. Fahnestock, and M. H. Jones. 2000. Annual CO2 flux in dry and moist Arctic tundra: Field responses to increases in summer temperatures and winter snow depth. Climatic Change 44 (1–2):139–50.
- Wilcox, E. J., D. Keim, T. de Jong, B. Walker, O. Sonnentag, A. E. Sniderhan, P. Mann, and P. Marsh. 2019. Tundra shrub expansion may amplify permafrost thaw by advancing snowmelt timing. Arctic Science 5 (4):202–17. doi:10.1139/as-2018-0028.
- Wilson, K. S., and E. R. Humphreys. 2010. Carbon dioxide and methane fluxes from Arctic mudboils. Canadian Journal of Soil Science 90 (3):441–49. doi:10.4141/CJSS09073.
- Wipf, S., and C. Rixen. 2010. A review of snow manipulation experiments in Arctic and alpine tundra ecosystems. Polar Research 29 (1):95–109. doi:10.1111/j.1751-8369.2010.00153.x.
- Xu, W., A. Prieme, E. J. Cooper, M. A. Mörsdorf, P. Semenchuk, B. Elberling, P. Grogan, and P. L. Ambus. 2021. Deepened snow enhances gross nitrogen cycling among Pan-Arctic tundra soils during both winter and summer. Soil Biology and Biochemistry 160:108356. doi:10.1016/j.soilbio.2021.108356.