
ABSTRACT
In this study, we inventoried and mapped the active and transitional rock glaciers in the central part of the Southern Alps, New Zealand, using Sentinel-1 InSAR (interferometric synthetic aperture radar) data. We used forty-three interferograms acquired between 2015 and 2019 with time intervals between six days and two years along with orthoimage analyses. A total of 123 rock glaciers were identified, of which 40 are active; that is, displaying velocities higher than 10 cm/yr. The remaining landforms are considered transitional. Among the complete sample of rock glaciers inventoried, 9 may also be interpreted as debris-covered glacierets. The number of inventoried landforms is low compared to what is observed in other similar mountain ranges, such as the European Alps. We explain this by the reduced vertical extent of the periglacial belt and the generally steep topography often not favorable for rock glacier development. Additionally, the motion rates appear relatively low. We hypothesize that a mean annual air temperature at the rock glacier locations well above 0°C is the main reason for this. These conditions may have resulted in significant ground ice melt. Rock glaciers in the Southern Alps are thus in an inactivation phase, which is expressed by typical morphologies such as stable fronts.
Introduction
Active rock glaciers are key landforms of mountain environments that reveal the existence of permafrost (Haeberli et al. Citation2006). They play a significant role in sediment transfer by conveying large amounts of debris through valley sides and therefore may be at the source of natural hazards in mountain areas (Kummert and Delaloye Citation2018; Marcer et al. Citation2020). Furthermore, rock glaciers can contain large amounts of ice and store water in the unfrozen fine-grained base layers and hence act as water reservoirs, especially in nonglaciated catchments (Jones et al. Citation2019; Schaffer et al. Citation2019; Wagner, Brodacz et al. Citation2020; Wagner et al. Citation2021). This role will increase in the future considering the rapid glacier retreat (Huss et al. Citation2017; Bosson, Huss, and Osipova Citation2019). For several decades, rock glaciers have also been considered as the visible expression of permafrost creep in unconsolidated sediment and therefore have been frequently used as input data for modeling the permafrost spatial extension (Lambiel and Reynard Citation2001; Boeckli et al. Citation2012; Schmid et al. Citation2015; Sattler et al. Citation2016; Azócar, Brenning, and Bodin Citation2017; Deluigi, Lambiel, and Kanevski Citation2017; Marcer et al. Citation2017). The influence of increasing temperatures on rock glacier velocities has been shown in several studies (e.g., Kääb, Frauenfelder, and Roer Citation2007), of which a few have evidenced the general acceleration of rock glaciers in the context of a warmer climate (e.g., Scapozza et al. Citation2014; Cusicanqui et al. Citation2021; Fleischer et al. Citation2021; Kääb et al. Citation2021; Marcer et al. Citation2021; Vivero et al. Citation2021). Therefore, active rock glaciers can be used as proxies for understanding the impact of climate change on the permafrost state.
For these different reasons, several rock glacier inventories have been realized globally, such as for the European Alps (Echelard et al. Citation2013; Scotti et al. Citation2013; Wagner, Pleschberger, et al. Citation2020), the Scandinavian mountains (Lilleøren and Etzelmüller Citation2011), North America (Liu et al. Citation2013; Charbonneau and Smith Citation2018; Johnson, Chang, and Fountain Citation2021), the Andes (Rangecroft et al. Citation2014; Villarroel et al. Citation2018; Blöthe et al. Citation2021), and the Asian mountains, including Himalaya (Jones et al. Citation2018), Tien Shan (Wang et al. Citation2017; Kääb et al. Citation2021), and the Tibetan Plateau (Ran and Liu Citation2018). Some of these inventories used InSAR (interferometric synthetic aperture radar) data for the detection of active rock glaciers (Villarroel et al. Citation2018) and for computing rock glacier velocities (Echelard et al. Citation2013; Liu et al. Citation2013; Wang et al. Citation2017). This technique is a well-established tool for detecting and mapping rock glaciers and, more generally, mass movements in mountain regions (Lambiel et al. Citation2008; Strozzi et al. Citation2010, Citation2020; Barboux, Delaloye, and Lambiel Citation2014; Bertone et al. Citation2019; Kääb et al. Citation2021).
Though some regions, such as the European Alps, have been intensively studied, others have received less attention. This is particularly the case in the Southern Alps of New Zealand. Indeed, research on rock glaciers and, more broadly, on mountain permafrost in this region is rather sparse. In a pioneering study, McGregor (Citation1967) recognized that rock glaciers are not uncommon in the Ben Ohau Range, one of the mountain ranges of the Central Alps. Augustinus (Citation2002) also acknowledged that rock glaciers are widespread across the eastern side of the Southern Alps. Jeanneret (Citation1975) and Kirkbride and Brazier (Citation1995) investigated the sensitivity of rock glaciers to climate change in the Southern Alps, and Brazier, Kirkbride, and Owens (Citation1998) provided the first mapping of rock glaciers for this region. From this study, Allen, Owens, and Huggel (Citation2008) estimated the permafrost distribution in the Aoraki/Mount Cook region. Later, Sattler et al. (Citation2016) provided the first comprehensive inventory of talus-derived rock glaciers for the Southern Alps of New Zealand, in which a categorization of the rock glacier activity was proposed from aerial image analyses. In this study, the rock glaciers were not outlined but sampled at the rock glacier initiation line to develop a model of the permafrost distribution. More recently, Winkler and Lambiel (Citation2018) showed that the development of rock glaciers in the Irishman Stream (Ben Ohau Range) started at the beginning of the Holocene. However, no study so far has investigated the dynamics of rock glaciers in New Zealand. In fact, almost nothing is known about the permafrost state and, more specifically, the rock glacier velocity rates on this island located at the Southern Hemisphere mid-latitudes. The objective of this contribution is therefore to provide new knowledge of the state of rock glaciers in the Southern Alps of New Zealand by (1) identifying and outlining active and transitional rock glaciers and (2) assessing their surface velocities. To this aim, we used Sentinel-1 InSAR data.
The study was partly realized within the framework of the Climate Change Initiative CCI+ project of the European Space Agency (https://climate.esa.int/en/projects/permafrost/), one of whose objectives was to deliver regional rock glacier inventories (Bertone et al. Citation2022). The inventory of rock glaciers in the Central Southern Alps of New Zealand is one of the eleven inventories carried out within this project.
Study area
The Southern Alps of New Zealand are an elongated mountain range, around 800 km long and 60 km wide, crossing almost the entire South Island of New Zealand from northeast to southwest (). The highest altitude at 3,724 m.a.s.l. is reached at the top of Aoraki/Mount Cook. Many summits located along the central ridge, called the Main Divide, are higher than 2,500 m.a.s.l., and sixteen of them exceed 3,000 m.a.s.l. The geology of the Southern Alps is rather homogeneous, with the dominance of graywacke east of the Main Divide (Fitzsimons and Veit Citation2001; Barrell, Andersen, and Denton Citation2011). The climate is temperate, with a strong maritime influence (Sturman and Wanner Citation2001). Average annual air temperatures are between 8°C and 10°C in the inland basins, like in the area of Aoraki/Mt Cook village (Macara Citation2016). Most of the atmospheric perturbations come from the west perpendicularly to the Southern Alps. This provokes a strong precipitation gradient across the mountain range, with annual rainfalls ranging from 3,000 mm on the West Coast, up to 14,000 mm on the Main Divide, to less than 1,000 mm further east (Henderson and Thompson Citation1999). This has a strong influence on the altitude of the equilibrium line of glaciers, which is at around 1,600 m.a.s.l. on the West Coast and up to 2,200 m.a.s.l. in the eastern catchments (Lamont, Chinn, and Fitzharris Citation1999). Hence, the glacier coverage is extensive around the highest areas close to the Main Divide, hindering the development of rock glaciers.
Figure 1. Location of the Central Southern Alps of New Zealand. BR = Barrier Range; BOR = Ben Ohau Range; LR = Liebig Range; TTR = Two Thumb Range; LH = Lake Heron; LC = Lake Coleridge; AP = Arthur’s Pass; MC = Mount Cook.
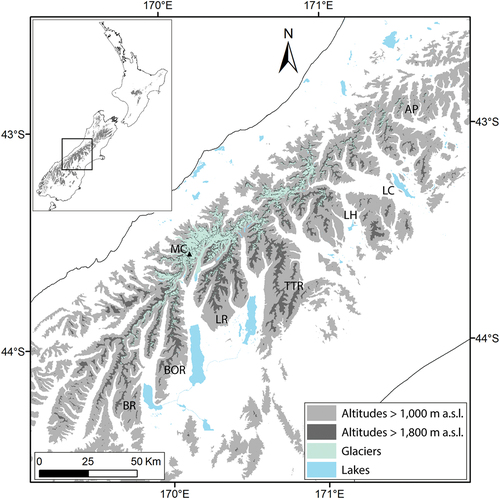
Sattler et al. (Citation2016) showed that most of the rock glaciers in the Southern Alps are located in the central part of the mountain range; that is, from southwest to northeast in the Barrier Range, the Ben Ohau Range, the Liebig Range, the Two Thumb Range, as well as in the Lake Heron and Arthur’s Pass regions. In their study, 75 active and 88 inactive rock glaciers, as well as 220 relict landforms, were identified based on the interpretation of aerial images. All of them are located at the east side of the Main Divide, where glaciers are more reduced. From this, they assessed that the permafrost lower limit lies at around 1,850 m.a.s.l. in south-exposed slopes.
Using the latter study as a starting point, we concentrated our investigations on the central part of the Southern Alps. The Kaikoura range, where a couple of rock glaciers were inventoried by Sattler et al. (Citation2016), and the area of Queenstown, where few landforms are also present, were not considered. The area of investigation is therefore between roughly 42°50′ S, 171°50′ E and 44°20′ S, 169°15′ E ().
Material and methods
InSAR
Spaceborne synthetic aperture radar (SAR) systems offer a relatively fast and low-cost method to survey large areas, even in remote locations. Differential SAR interferometry (DInSAR) is a consolidated technology for mapping surface displacements that uses two SAR images acquired from slightly different orbit configurations and at different times to exploit the phase difference of the signals. The interferometric phase can be written as a sum of a topographic phase term, a displacement phase term, and error terms (atmospheric distortion, system noise; Bamler and Hartl Citation1998; Rosen et al. Citation2000; Strozzi et al. Citation2020). The basic idea of differential SAR interferometry is to separate the topography- and displacement-related phase terms to allow mapping of the coherent displacement occurring along the line of sight (LOS) between the acquisitions of the interferometric image pair. Despite limitations due to the decorrelation of the signal, the special SAR imaging geometry and atmospheric water vapor–induced phase effects, the method has in recent years been successfully applied in mountainous regions for detecting and inventorying mass movements (Barboux, Delaloye, and Lambiel Citation2014; Nishiguchi, Tsuchiya, and Imaizumi Citation2017; Wang et al. Citation2017; Villarroel et al. Citation2018; Brencher, Handwerger, and Munroe Citation2021).
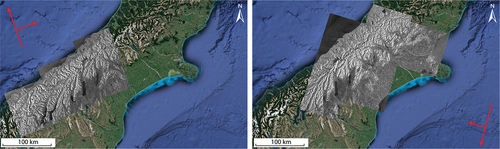
For this study, we used Sentinel-1 data with a center frequency of 5.4 GHz (C-band), corresponding to a wavelength of 5.55 cm. The width of the Sentinel-1 images is approximately 250 km. The area of interest is covered by ascending orbit number 23 and descending orbit number 146 (). The images were downloaded in Single Look Complex format from the Copernicus Open Access Hub (https://scihub.copernicus.eu) and co-registered to a winter reference geometry. A topographic reference in the New Zealand Transverse Mercator 2000 (NZTM2000) projection was prepared with the 8-m digital elevation model (DEM) originally created by Geographx (geographx.co.nz) from January 2012 LINZ Topo50 20-m contours and available at https://data.linz.govt.nz/layer/51768-nz-8m-digital-elevation-model-2012. The topographic reference was considered for geocoding and removal of the terrain-induced phase changes in the SAR interferograms.
Figure 2. Footprints of the Sentinel-1 data used over the Southern Alps. Left: Ascending orbit number 23; Right: Descending orbit number 146.
Because of the location of the Southern Alps in the Southern Hemisphere, only images acquired between January and April (i.e., in the austral summer period) were used to avoid the presence of snow cover. We used two data sets processed by gamma remote sensing for 2015–2018 and 2018–2019. The first set contained twelve interferograms from the ascending orbit and eleven interferograms from the descending orbit. The second set contained ten interferograms from each orbit. The latter was produced within the framework of the ESA CCI+ Permafrost Project (2018–2021). Time intervals were of 6, 12, 24, 48, 72, 360, 366, 372, 726, and 732 days.
Moving areas and rock glacier mapping
The study was carried out within GIS software ArcGIS 10.7. The Sentinel-1 interferograms were analyzed together with complementary data. Orthoimages with a ground resolution of 0.75 m were downloaded from the LINZ (Land Information New Zealand) data service, together with topographic maps from the NZTopo50 series (scale 1:50,000). Other data, like the 8-m DEM and glaciated areas (Barrell, Andersen, and Denton Citation2011), were also used. Finally, the shapefile of the rock glacier inventory of Sattler et al. (Citation2016) was included in the ArcGIS project.
The detection and analysis of the moving areas followed different steps. To minimize subjectivity, the work was performed by three different operators. In case of different results, a common analysis was performed to reach a consensus. First, we started from the points indicating the rock glacier location of the Sattler et al. (Citation2016) inventory. In their study, the rock glaciers were categorized into three groups; that is, active, inactive, and relict, based on orthophoto and Google Earth image interpretation. We systematically analyzed the available interferograms for all active and inactive rock glaciers of this inventory. Ascending images were used for east-facing and descending images for west-facing slopes. For north- or south-facing slopes, both sets of images were used. Additionally, we looked at rock glaciers classified as relict by Sattler et al. (Citation2016; ). This step allowed us to update the categorization of rock glacier activity proposed by the latter authors. In a second step, we systematically analyzed the interferograms for all catchments or valley slopes located above roughly 1,700 m.a.s.l. to possibly detect rock glaciers that had been missed in the available inventory. This was done by a thorough analysis of orthoimages and topographic maps, including Google Earth and Bing Aerial images. For each rock glacier, the complete series of interferograms was checked.
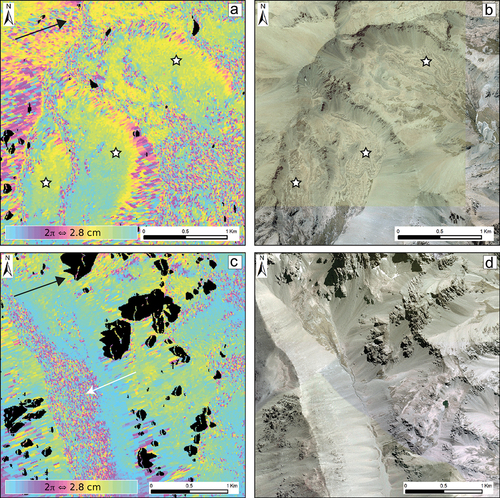
Figure 3. Examples of noisy interferograms. The color scale corresponds to a complete fringe equivalent to a change in topography of half the wavelength (2.8 cm for Sentinel-1). The black arrow indicates the LOS direction. Black patches correspond to layover and shadow areas. (a) Three hundred sixty-day ascending interferogram (13 March 2017–18 March 2018) and (b) corresponding orthoimage show noisy patterns in the steep slopes and around the crests, together with the absence of signals on the three indicated relict rock glaciers (white stars). Location: 43°51′12″ S/170°43′40″ E. (c) Twenty-four-day ascending interferogram, 31 March 2017–24 April 2017) and (d) (corresponding orthoimage) show a noisy pattern on a steep and regular east-facing valley side (white arrow). Location: 43°46′20″ S/170°21′20″ E. Basemap: Orthoimage 2006 (Terralink Citation2004–2010).
The outlining of the detected moving areas followed the rules proposed by the IPA Action Group Rock Glacier Inventories and Kinematics (RGIK Citation2020). The absence of a signal (plain pattern) indicates no change, a (partly) observed fringe pattern means movement, and a decorrelated signal indicates either noise or movement higher than about half of the wavelength. The identification of a moving area requires the compilation of a set of interferograms of various time intervals to exclude misinterpreted signals: a signal visible on a short time interval interferogram must also be visible at a longer time interval. If this is not the case, the signal must be considered as noise due to other causes than topographic change.
The moving areas were drawn manually, starting from the interferograms with the shortest time interval and then refined using the interferograms with increasing time intervals. Because the objective was not only the mapping of moving areas but also the assessment of velocities, adjacent polygons with different velocities could be drawn for the same landform. It is also important to note that the moving areas’ outlines do not necessarily fit the outline of the corresponding rock glacier or any mass wasting landform. Next, the velocity of each moving area was assessed from the interferograms used, after which each moving area was classified according to its velocity and following the categories defined by RGIK (Citation2020): 0 = undefined, 1 = <1 cm/yr, 2 = 1–3 cm/yr, 3 = 3–10 cm/yr, 4 = 10–30 cm/yr, 5 = 30–100 cm/yr, 6 = >100 cm/yr, 7 = other.
It should be noted that the velocity assessed from InSAR refers to the one-dimensional projection along the LOS. Therefore, unless the rock glacier is moving exactly along the LOS direction, the velocity assessed is automatically underestimated. The larger the angle between the LOS direction and the direction of motion, the higher the underestimation is. To support our investigations, we also computed a normalization factor, corresponding to the scale factor to multiply the LOS velocity to obtain the three-dimensional velocity, assuming that the rock glacier is moving along the maximum slope direction estimated from the DEM filtered over a distance of 200 m. The normalization factor ranges between 1 and +∞, with 1 meaning parallel LOS and slope directions, 2 meaning that the actual movement should be two times the LOS movement, etc. However, the normalization factor only gives an indication of the underestimation, because other factors, such as the mass continuity or the surface roughness with respect to the resolution of the DEM, can influence the direction of motion of a rock glacier. That is assessing the velocity in the LOS direction instead of doing a conversion using this normalization factor is advised (RGIK Citation2020). In addition, the assessment of velocities is based on summer interferograms (i.e., the snow-free period), whereas summer velocities are usually higher than annual means (Delaloye, Lambiel, and Gärtner-Roer Citation2010; Wirz et al. Citation2016; Cicoira et al. Citation2019). For all these reasons, quantifying the exact annual velocity and its error for each landform is not feasible, and classes of velocities are proposed by the RGIK (Citation2020). To provide an uncertainty estimation on the movement and its outlining, however, we indicated the reliability of the detected moving areas, and thus of the kinematic attribute, in the supplementary table, following the guidelines of the RGIK (Citation2020). For nonoptimal slope configurations (e.g., north- and south-facing slopes), the reliability was set to “medium” or “low.”
The following step consisted of allocating a kinematic attribute to each corresponding rock glacier. Here, we again followed the rules of the RGIK (Citation2020). First, a dot was manually set on each rock glacier. For complex landforms composed of different rock glacier units (i.e., adjacent or superimposed lobes), one dot per unit was set. Based on the guidelines, “a kinematic attribute is a semi-quantitative (order of magnitude) information, which must be representative of the overall multi-annual downslope movement rate of an inventoried rock glacier unit” (RGIK Citation2020, 21). It thus reflects the kinematic behavior of the rock glacier. shows the different categories used. From this, a related activity was attributed. Following the updated categorization of activity proposed by RGIK (Citation2022), the state “transitional” was attributed to rock glaciers having velocities lower than 10 cm/yr, thus for all categories below and including the category centimeters per year to decimeters per year. For higher velocities, the classical category “active” was used. In this new categorization, the traditional class “inactive” no longer exists.
Table 1. Categories of kinematic attributes and related activity.
Finally, the rock glaciers were outlined using the orthoimages as a first basis. The outline was drawn at the base of the front and the lateral margins. For cases where the front was prolonged downslope by a talus slope or any other debris accumulation without any change in slope angle or contrast in material, the thickness of the rock glacier at the front was inferred from the height of the lateral margins. The outlining at the roots (i.e., where the motion starts) depends on the upslope connection, and for most cases, a reliance on the orthoimage interpretation was not sufficient. Google Earth images, which allow 3D visualization, as well as topographic maps, were therefore also used. The large majority of active and transitional rock glaciers in the Southern Alps are talus connected, as defined by RGIK (Citation2022). For this category of landforms, the outline was drawn where the slope angle becomes gentler at the base of the talus. Changes in texture (i.e., increasing grain size) as well as snow patches were also used as indicators for distinguishing the talus slope from the rock glacier. Areas with geomorphological indices of permafrost creep in the steeper upslope area were also considered as being part of the rock glacier. Finally, the moving areas outlined in the previous step were systematically visualized. In particular, this could help refine the outlining at the roots; for instance, where the movement was present in the steeper upslope area.
Results
Quality of the interferograms and validation of the detected velocities
Compared to other regions worldwide like the Swiss Alps, Western Greenland, and the semiarid Andes of South America (Strozzi et al. Citation2020), the interferograms available over the Southern Alps of New Zealand generally appeared rather noisy (). On one hand, they often showed severe phase variations due to atmospheric heterogeneities caused by atmospheric water vapor variability, on the spatial scale of a few kilometers (e.g., Hanssen et al. Citation1999). On the other hand, we found large noise for some steep and regular valley sides, as visible in , on which the east-facing valley side is almost entirely decorrelated in twenty-four days. This sector corresponds to a series of fine-grained adjacent talus slopes without any creeping landforms; hence, such decorrelated patterns must be attributed to other reasons than rapid motion. Such noisy patterns can be observed in numerous similar topographical situations, and the noise generally increases with the time span. We attribute the lower level of coherence to changing surface conditions at the level of the size of the wavelength. The main reason for this may be the strong wind erosion, a phenomenon particularly efficient in the Southern Alps (Basher and Painter Citation1997), especially on very fine-grained slopes, as is the case for the examples in .
We must also consider that a large proportion of rock glaciers in the Southern Alps are not in an optimal orientation regarding the orbit of Sentinel-1. Because Sentinel-1 is right-looking with a roughly south–north flight direction in the ascending mode and north–south flight direction in the descending one, as for all current satellites, the best configurations for quantifying surface movement are the east and west orientations (i.e., parallel to the LOS, or perpendicular to the satellite orbit). However, in our case 39 percent of the rock glaciers have an aspect between 160° and 200° (). This nonoptimal configuration did not prevent the detection of moving areas but may have resulted in the underestimation of the velocities for some landforms.
Figure 4. Number of active and transitional rock glaciers per aspect class.
Considering the abovementioned limitations, including quite large tropospheric disturbances, signal identification and quantification were challenging for several locations. The analysis by different operators, however, helped to reduce the subjectivity.
Even if InSAR is a well-established tool for quantifying mass movements, validation of the detected velocities by alternative measurements is always desirable. This is especially the case when the interferograms are fairly noisy like in this study. In our case, we could compare the InSAR-detected velocities for two rock glaciers located in the Irishman Stream, Ben Ohau Range, with those obtained through terrestrial surveys (). The kinematics of these two rock glaciers, termed RG_19 and RG_20-2, were investigated through two differential GNSS (dGNSS) measurement campaigns in January 2016 and February 2017. The position of around twenty blocks was measured on each rock glacier with a Trimble R10 using the real-time kinematics mode (see Lambiel and Delaloye Citation2004). The positioning error is usually around 1 to 2 cm with this technique.
Figure 5. (a) Oblique view on active rock glacier units on the head of Irishman Stream, Ben Ohau Range (Photo C. Lambiel, 2016.01.10; Location: 43°59ʹ17”S/170°03ʹ00”E); (b) annual horizontal velocities of rock glaciers RG_19 and RG_20-2 measured with dGNSS between 10 January 2016 and 8 February 2017 and moving areas mapped from InSAR data; (c) 24-day descending interferogram (26 March 2016–19 April 2016) with moving areas; (d) 360-day descending interferogram (12 February 2015–7 February 2016) with moving areas. Black arrows indicate LOS. Basemap: Orthoimage 2006 (Terralink Citation2004–2010).
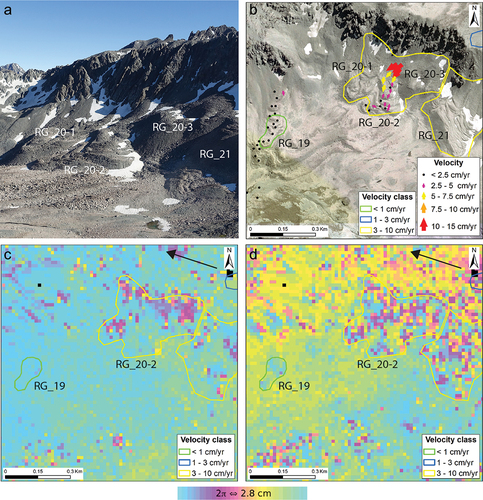
Horizontal velocities measured on rock glacier RG_20-2 are between 2 and 5 cm/yr in its lower part and 5 to 15 cm/yr in its upper part, with the maximal values measured near the roots (). On the twenty-four-day interferogram, a plain pattern is clearly visible in the upper part of RG_20-2 (but also on RG_20-1 and RG_20-3 units; ), indicating velocities of around 15 cm/yr at the location of the dGNSS surveys. On the annual interferogram (), most of the rock glacier (RG_20) shows a decorrelated signal, indicating velocities higher than 3 cm/yr, whereas the lower part of RG_20-2 displays a plain pattern whose analysis gives values of around 3 cm/yr. Consequently, a moving area of 3 to 10 cm/yr was mapped for this rock glacier. On rock glacier RG-19, horizontal surface velocities measured with dGNSS are lower than 3 cm/yr (). On the annual interferogram, a barely visible pattern showing velocities lower than 1 cm/yr can be observed on the center of the rock glacier (). For both rock glaciers, RG-20 and RG-19, the velocities quantified from InSAR data are thus in accordance with in situ measurements. From these comparisons, we can conclude that despite rather noisy interferograms, the velocities that can be extracted are reliable, yet they require careful analysis.
Distribution of active and transitional rock glaciers
A total of 123 rock glaciers were detected through InSAR analyses in the study area ( and and supplementary table). Their mean area is 3.9 ha, the median is 2.9 ha, and the standard deviation 3.1, indicating a large variability of landform size. Only seven landforms are larger than 10 ha, with the largest one reaching 17 ha. Note that the relict rock glaciers, which are not considered in this study, have much larger dimensions. Except for three rock glaciers connected to glacier forefields, all landforms are located at the base of talus slopes. On transitional rock glaciers, the contrast in surface material between the rock glacier surface and the front is generally low, with the latter rarely displaying abundant fine-grained and unweathered material and the angle between the front and the surface appearing generally smooth. These characteristics also concern several active rock glaciers and are therefore a sign of low activity.
Figure 6. Example of an active rock glacier: (a) and (b) RG_111, Two Thumb Range (location: 43°35′00″ S/170°39′28″ E) and of two rock glaciers classified as transitional (c) and (d) RG_023 (west) and RG_024 (east), Ben Ohau Range (location: 43°59′04″ S/170°03′50″ E). (a) Twelve-day ascending interferogram (9 March 2019–21 March 2019) with moving area; (b) corresponding orthoimage with moving area and rock glacier outline; (c) forty-eight-day ascending interferogram (7 March 2017–24 April 2017) with moving areas; (d) corresponding orthoimage with moving areas and rock glacier outlines. Black arrows indicate LOS. Basemap: Orthoimage 2006 (Terralink Citation2004–2010).
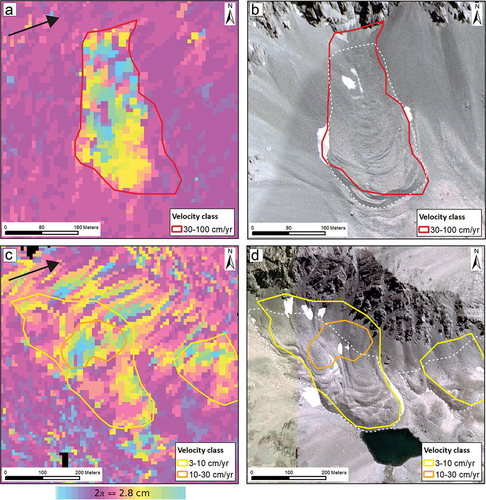
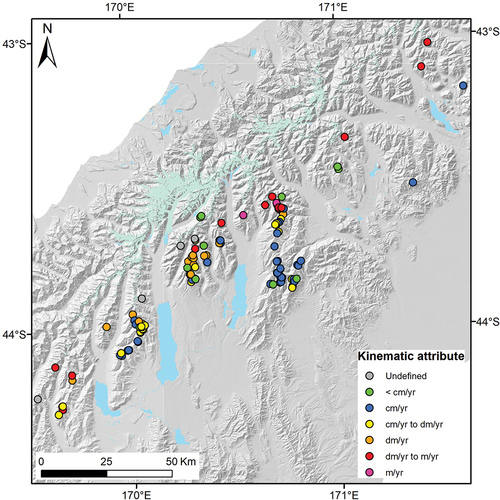
Figure 7. Location and kinematics of the active and transitional rock glaciers in the Central Southern Alps.
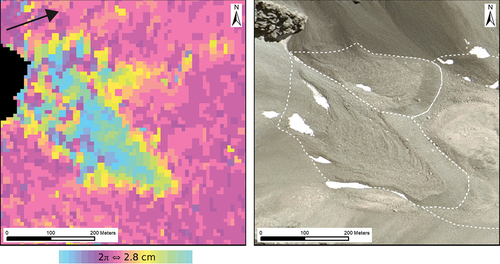
Though most of the inventoried landforms present the classical patterns of active and transitional rock glaciers, some others cannot be unambiguously classified as rock glaciers. Indeed, nine landforms display, to a varying extent, some of the following characteristics: presence of small lateral crests; smoother surface compared to classical rock glaciers (absence of compression ridges); sharp angle between the front and the landform surface, contrary to most of the rock glaciers of the Southern Alps; and presence of late-lying snow patches at the roots (). Regarding these characteristics, these landforms may also be interpreted as debris-covered glacierets (DCGs). In addition, three other landforms display features that may indicate past deformation by glacier advance and may thus be interpreted as glacitectonized frozen landforms (GFLs; see Wee and Delaloye Citation2022).
Figure 8. Two adjacent rock glacier units (RG_088_3, south, and RG_088_4, north; Two Thumb Range, 43°35′39″ S/170°44′05″ E). Left: Twelve-day ascending interferogram (9 March 2019–21 March 2019). Right: Corresponding orthoimage with rock glacier units’ outlines. RG_088_3 may be a debris-covered glacieret, as evidenced by the small lateral crests. Black arrow indicates LOS. Basemap: Orthoimage 2006 (Terralink Citation2004–2010).
Three regions contain 87 percent of the identified moving landforms: the Ben Ohau Range (west of Lake Pukaki), the Liebig Range (northwest of Lake Tekapo), and the Two Thumb Range (northeast of Lake Tekapo), with 42 percent found in the latter area (). A few rock glaciers are also present in the west of Lake Ohau and in the areas of Lake Heron and Lake Coleridge. Forty rock glaciers were classified as active (i.e., with velocities higher than 10 cm/yr), whereas the eighty-three remaining rock glaciers are transitional (i.e., velocities below 10 cm/yr). Half of the rock glaciers in the Liebig Range are active, whereas this proportion falls to 22 percent in the Ben Ohau Range and only 18 percent in the Two Thumb Range.
The mean frontal altitude of the transitional rock glaciers is 1,972 m.a.s.l., and it is 1,987 m.a.s.l. for active rock glaciers (). However, if we consider only the “classical” active rock glaciers—that is without the possible/likely DCGs and the GFLs—this value increases to 2,037 m.a.s.l., strongly reducing the dispersion of altitudes (from σ = 128 to σ = 96 and σ = 117 for transitional landforms). Regarding the roots of the rock glaciers (i.e., where creeping starts), the altitudes are 2,039 m/a.s.l. and m 2,114 m.a.s.l. (for “classical” rock glaciers), respectively. Hence, both front and root altitudes are slightly higher for active rock glaciers compared to transitional ones.
Figure 9. Altitudes of the front for transitional and active rock glaciers, as well as for “classical” active rock glaciers (i.e., after removing the possible/likely debris-covered glacierets and the glacitectonized frozen landforms) in the entire study area. The number of rock glaciers is indicated at the bottom of the chart.
Rock glacier velocities
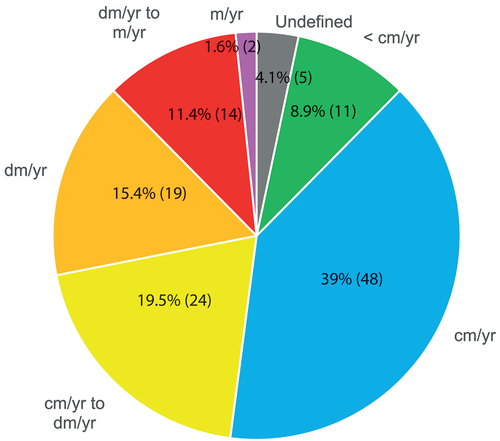
The velocities of the moving areas were classified following the guidelines of the IPA Action Group Rock Glacier Inventories and Kinematics (RGIK Citation2020) and, successively, a kinematic attribute was given to each corresponding rock glacier. Half of the landforms display velocities on the order of centimeters per year or less, 20 percent are in the category centimeters per year to decimeters per year, 15 percent in the category decimeters per year, and only 13 percent fall into the two highest categories, decimeters per year to meters per year and meters per year ().
Figure 10. Proportion of rock glaciers by kinematic class.
The influence of altitude on the rock glacier activity evidenced in the previous section () can also be observed for the kinematic classes centimeters per year, centimeters per year to decimeters per year, and decimeters per year in . Indeed, for these classes we can observe a slight increasing velocity trend with increasing altitude. However, this relationship does not work for the most rapid landforms (decimeters per year to meters per year and meters per year). The mean frontal altitude of this category is indeed lower than that of the slowest rock glaciers. This is largely explained by the presence of possible/likely DCGs in this category. Their presence at low elevations is due to their location at the foot of well-developed slopes that can furnish high amounts of snow by avalanches, which may have allowed the formation of small glacierets or perennial snow patches during the coldest periods of the Holocene. In more recent times, the high rock fall activity from the large rock walls may have led to the formation of a debris cover, preventing ice from complete melting. The probable presence of relatively large quantities of ice close to the surface may result in significant surface deformation due to ice melt–related processes. The strong and often decorrelated InSAR signals visible on these landforms may thus reflect surface subsidence rather than downslope movement. However, the distinction of the two types of movement cannot be made with InSAR alone.
Figure 11. Link between rock glacier kinematics and altitude. The number of rock glaciers is indicated at the bottom of the chart.
Among other factors that may influence the rock glacier creeping rates, the slope apparently plays no role. Indeed, the average slope for active landforms is 24° (σ = 8), whereas it is 25° (σ = 6) for transitional ones.
Discussion
Mapping and categorizing rock glacier activity using InSAR analyses
Overall, the InSAR analyses performed in this study were often difficult, due to the generally high level of noise in the available interferograms. As expressed previously, many signals were present without any geomorphic significance. Thus, instead of looking first at the interferogram and then at the orthoimage to interpret the observed signal, as is conventionally done (Barboux, Delaloye, and Lambiel Citation2014), it was generally necessary to proceed in the opposite way, by looking for possible signals at the location of known rock glaciers. This analysis was very time-consuming, due to the frequent intercomparison of interferograms, orthoimages, and Google Earth/Bing Aerial images. Despite this and the generally noisy nature of the available interferograms, however, the clarity of the signals on the visually most active rock glaciers, together with the validation of the InSAR-detected velocities in the Irishman Stream with dGNSS surveys, supports the reliability of the results obtained.
We recall that InSAR data provide velocities projected along the LOS direction. The rate of motion of the rock glaciers is thus underestimated, and for nonoptimal slope orientations (e.g., north–south), the kinematic attributes of a few landforms could actually be different than indicated in our inventory. Also, we cannot exclude that few relict rock glaciers are still slowly moving but were not captured by the InSAR analysis. As mentioned earlier, however, following the suggestions of the RGIK (Citation2020), we decided not to project the LOS velocity along the maximum slope direction, because this would introduce further uncertainties, in particular when LOS and slope direction approach a perpendicular direction. The rough estimation of the error is, however, indicated in the supplementary table of the inventory as a reliability factor.
Among the 123 rock glaciers inventoried in this study, 40 landforms were recognized as active, whereas 83 were mapped as transitional. Note that this category includes extremely slow-moving rock glaciers with velocities below 1 cm/yr. In comparison, Sattler et al. (Citation2016) inventoried 75 active and 88 inactive rock glaciers (163 landforms in total) in the same region, based only on the geomorphological interpretation of aerial images. Making a comparison between the two studies is not straightforward, because the categories are not the same (transitional vs. inactive). To make it possible, we reclassified the transitional rock glaciers of the present study by transferring the landforms belonging to the class centerimeters per year to decimeters per year to the category active and by considering the landforms of the two slowest classes (i.e., centimers per year and less than centimeters per year) as inactive. This new categorization resulted in the presence of 64 active and 59 inactive rock glaciers. Also, Sattler et al. (Citation2016) considered only the talus rock glaciers and thus did not map the entire diversity of rock glaciers. To make the two studies comparable, we therefore removed the twelve possible/likely DCGs and GFLs from our sample of active rock glacier, thus yielding 52 active rock glaciers. Of these, only 26 were recognized as such by Sattler et al. (Citation2016), whereas 10 were considered as inactive, 1 was considered relict, and 15 were not mapped (). These large differences also appear for the category inactive. Furthermore, 8 rock glaciers classified as relict by Sattler et al. (Citation2016) are in fact either active (1) or inactive (7). In total, a good match (i.e., same categorization) was noted for 46 percent of the rock glaciers, whereas 31 percent were mapped differently and 23 percent (26 landforms) were not mapped in the prior inventory.
Table 2. Comparison matrix of rock glacier categorization in the present study and that of Sattler et al. (Citation2016).
These large differences between the two studies show the difficulty of an activity assessment based only on aerial image analyses. This is especially the case for the study area, because most rock glaciers lack clear evidence of motion due to their low velocities. In particular, the fronts rarely display the classical exposure of fine-grained and unweathered sediments that contrasts with the rock glacier surface, together with the sharp angle between the front and the surface for active rock glaciers. This comparative study therefore highlights the usefulness of InSAR for assessing rock glacier kinematics, as evidenced by several other studies (e.g., Wang et al. Citation2017; Villarroel et al. Citation2018; Brencher, Handwerger, and Munroe Citation2021).
Rock glacier distribution in the Southern Alps
The inventory of active and transitional rock glaciers performed in this study can be considered as almost exhaustive for the central part of the Southern Alps, given the comprehensive analyses that were carried out (systematic analyses of all available interferograms, orthoimage inspection of all sectors potentially favorable for rock glaciers, work performed by three independent operators). In addition to the 123 inventoried landforms, Sattler et al. (Citation2016) reported 3 additional active rock glaciers in the Kaikoura range more to the northeast, and a couple of other rock glaciers are also present in the region of Queenstown. Regarding the size, topography, and climatic parameters of this mountain range, the number of rock glaciers is low compared to other temperate mountain ranges like the European Alps. For example, Marcer et al. (Citation2017) inventoried 814 active and 671 inactive rock glaciers in the French Alps, for an area similar in size to the Central Southern Alps in New Zealand. In the Western Swiss Alps, around 600 active and transitional rock glaciers were mapped in an area around five to six times smaller than that of the Southern Alps (Bertone et al. Citation2022), Scotti et al. (Citation2013) mapped approximately 600 intact (i.e., active and inactive) rock glaciers in the Central Italian Alps in an area around two times smaller than that of the Southern Alps, and Wagner, Pleschberger, et al. (Citation2020) identified 2,309 intact rock glaciers in Austria, for an area approximately three times larger than the Southern Alps.
Two reasons for this generally low number of active rock glaciers can be identified. The first one relies upon the topography. The Southern Alps are characterized by extremely high erosion rates due to high uplift rates, combined with the strong westerly atmospheric perturbations (Fitzsimons and Veit Citation2001). As a result, many valleys are deeply incised and present steep sides from the crest to the valley bottom occupied by large talus slopes and therefore lack flatter sections within the permafrost belt (). In addition, the rock walls are often not well developed, and several valleys lack small inherited glacial cirques. Altogether, these topographic characteristics hindered the development of rock glaciers in many valleys. On the other hand, Sattler et al. (Citation2016) inventoried 220 relict rock glaciers in the Southern Alps, with a high concentration of landforms in some regions like the Two Thumb Range or the south of the Ben Ohau Range. This suggests that the topography at lower elevations was more favorable to rock glacier development during the colder phases of the Holocene or during the Late Glacial period. It is also worth noting that the general steep topography probably has no influence on the slope gradient of rock glaciers. The values we measured (i.e., 24°–25°) are indeed in line with values obtained by Lilleøren and Etzelmüller (Citation2011; 20°–23°), Ran and Liu (Citation2018; 30°), and Johnson, Chang, and Fountain (Citation2021; 20.5°).
The second reason is due to the combined effect of topography and climate. Because the climate of the Southern Alps is relatively humid and the summer temperatures are moderate due to the maritime influence (Sturman and Wanner Citation2001), glacier equilibrium-line altitude (ELA) is relatively low at around 2,000 to 2,200 m.a.s.l. in the region where rock glaciers are present (Lamont, Chinn, and Fitzharris Citation1999). In parallel, permafrost is expected above 1,850 m.a.s.l. in south-exposed slopes (Sattler et al. Citation2016). The consequence is a restricted vertical extension of the periglacial belt of around 300 m, and thus limited space for rock glaciers. A rough approximation shows that where summits are higher than 2,300 m.a.s.l., small glaciers or Little Ice Age glacier forefields are present in the cirque below, and where summits are lower than 2,000 m.a.s.l., the required conditions for the occurrence of active and transitional rock glaciers are not met.
Why are velocities so low?
Overall, the velocities are low compared to what is observed in similar mountain ranges, such as the European Alps (Barboux, Delaloye, and Lambiel Citation2014; Marcer et al. Citation2021). In the Southern Alps, only 30 percent of the rock glaciers move at velocities on the order of decimeters per year or higher, whereas this proportion is around 60 percent in the Western Swiss Alps (Bertone et al. Citation2022). As expressed before, this low activity is also evidenced by the geomorphological characteristics of the rock glaciers.
As shown in , the lowest velocities appear to be generally found in the southern parts of the ranges. This is especially true for the Ben Ohau and Two Thumb ranges. These clusters of low velocities do not correspond to significantly lower elevations. On the other hand, annual precipitation in these areas is distinctly lower than in the northern part of the ranges due to increasing continentality toward the southeast (Henderson and Thompson Citation1999; Sturman and Wanner Citation2001; see also Supplementary Material). This means a longer snow-free period and therefore possibly more degraded permafrost conditions. This is in line with Sattler et al. (Citation2016), who showed that maritime climate allows lower permafrost conditions.
To understand the overall reason for the low rock glacier activity, we calculated the mean annual air temperature (MAAT) for the period 1981–2010 at each rock glacier location. We can first observe that all rock glaciers are situated well below the 0°C isotherm altitude (). The highest active rock glacier has an MAAT of +1.4°C, and the mean value for all active landforms is +2.5°C. The values for transitional rock glaciers are slightly warmer, with a highest value of +4.3°C. Therefore, rock glaciers in the Southern Alps occupy areas where permafrost is in strong imbalance with the current climatic conditions. Such warm conditions have caused significant ice loss, which is expressed by frequent degraded morphologies. The high rock glacier velocities due to permafrost degradation observed in several regions worldwide (e.g., Fleischer et al. Citation2021; Kääb et al. Citation2021; Marcer et al. Citation2021; Vivero et al. Citation2022) is not present in the Southern Alps. We hypothesize that this occurred earlier during the Holocene and that rock glaciers in this part of the world are currently in an inactivation phase.
Figure 12. Distribution of the MAAT for the period 1981–2010 for active and transitional rock glaciers. Data source: NIWA.
From this arises the question of the long-term development of rock glaciers in the Southern Alps. Winkler and Lambiel (Citation2018) investigated the ages of the two rock glaciers in the Irishman Stream (Ben Ohau Range) on which dGNSS surveys were carried out in the present study. Schmidt Hammer dating revealed early Holocene ages for the two rock glaciers and a long development throughout the entire Holocene with probable different periods of activity. We can thus expect higher activity rates during the colder phases of the Holocene for the ensemble of rock glaciers investigated here. In New Zealand, the first part of the Holocene and the last millennia up to the end of the nineteenth century were characterized by temperatures significantly colder than today, evidenced by several glacier advances (Schaefer et al. Citation2009; Putnam et al. Citation2012). It is therefore highly probable that the rock glacier activity was higher during these colder periods and that the landforms depicted the classical morphologies of active rock glaciers during these periods. Apart from this, there is little evidence of glacier advances on most of the rock glaciers. Indeed, most of them are talus connected. This is therefore also consistent with an early Holocene age for most of the rock glaciers. However, in the most favorable locations, small glacierets and perennial snow patches could have formed during the cold periods of the Holocene, whereas they were progressively covered with debris during the warmest period (e.g., Seppi et al. Citation2014; Bosson and Lambiel Citation2016). Due to continuous ice flow under the superficial debris cover, today these small landforms have morphologies very close to those of active rock glaciers.
Conclusions
Using Sentinel-1 InSAR data, we inventoried 123 creeping landforms associated with ground ice in the central part of the Southern Alps in New Zealand. Most of these landforms correspond to talus-connected rock glaciers, 9 may correspond to debris-covered glacierets and 3 to glacitectonized frozen landforms. The number of rock glaciers in the Southern Alps appears relatively low compared to other similar mountain ranges, such as the European Alps. The reason for this is the small vertical extent of the periglacial belt due to the low glacier ELA and the lack of favorable topography for rock glacier development.
Despite generally noisy interferograms and uncertainties inherent to the method, the assessment of rock glacier kinematics could be satisfactorily achieved. The rock glacier velocities are rather low, with half of the inventoried rock glaciers moving with velocities lower than 3 cm/yr and only 10 percent having velocities higher than 30 cm/yr. These values are significantly lower than those measured in several other mountain ranges. This is explained by relatively warm MAAT at the rock glacier locations. Active rock glaciers in the Southern Alps can thus be considered in an inactivation phase.
Both the number of inventoried rock glaciers and the classification of active and transitional/inactive landforms show quite large differences with a preliminary inventory based on the interpretation of aerial images only. This comparative study highlights the usefulness of InSAR for assessing rock glacier kinematics, especially when transitional landforms dominate, as is the case in the Southern Alps.
The recent digitalization of the Crown Aerial Film Archive of New Zealand can provide a unique opportunity to study long-term rock glacier kinematic changes in the region. In particular, this archive contains aerial surveys dating back to the 1940s (LINZ Citation2022). The reprocessing of these images with modern digital photogrammetry techniques can help unravel the response of creeping permafrost to atmospheric changes in this mountain range located in the southern hemisphere mid-latitude. This should be complemented by the initiation of thermal and kinematic monitoring of few selected active rock glaciers.
Supplemental Material
Download Zip (2.4 MB)Acknowledgments
We thank NIWA for the supply of temperature and precipitation data and the Universities of Canterbury and Otago for providing GNSS equipment and support during the 2016 and 2017 field campaigns. Thank you also to Reynald Delaloye, Chloé Barboux, and Line Rouyet for fruitful discussions and to the two anonymous reviewers for their very helpful comments.
Disclosure statement
No potential conflict of interest was reported by the author(s).
Supplementary material
Supplemental data for this article can be accessed online at https://doi.org/10.1080/15230430.2023.2183999.
Correction Statement
This article has been corrected with minor changes. These changes do not impact the academic content of the article.
Additional information
Funding
References
- Allen, S., I. Owens, and C. Huggel. 2008. A first estimate of mountain permafrost distribution in the Mount Cook region of New Zealand’s Southern Alps. Ninth International Conference on Permafrost 37–18. doi:10.5167/uzh-5447.
- Augustinus, P. 2002. Periglacial research in New Zealand: A review. South African Journal of Science 98:64–70.
- Azócar, G. F., A. Brenning, and X. Bodin. 2017. Permafrost distribution modelling in the semi-arid Chilean Andes. The Cryosphere 11 (2):877–90. doi:10.5194/tc-11-877-2017.
- Bamler, R., and P. Hartl. 1998. Synthetic aperture radar interferometry. Inverse Problems 14 (4):R1–R54. doi:10.1088/0266-5611/14/4/001.
- Barboux, C., R. Delaloye, and C. Lambiel. 2014. Inventorying slope movements in an Alpine environment using DInSAR. Earth Surface Processes and Landforms 39 (15):2087–99. doi:10.1002/esp.3603.
- Barrell, D. J. A., B. G. Andersen, and G. H. Denton. 2011. Glacial geomorphology of the Central South Island, New Zealand. GNS Science Monograph, Nr. 27, Lower Hutt: GNS Science.
- Basher, L. R., and D. J. Painter. 1997. Wind Erosion in New Zealand. In Proceedings of the International Symposium on Wind Erosion. Manhattan, KS: USDA-ARS.
- Bertone, A., C. Barboux, X. Bodin, T. Bolch, F. Brardinoni, R. Caduff, H. H. Christiansen, M. Darrow, R. Delaloye, B. Etzelmüller, et al. 2022. Incorporating InSAR kinematics into rock glacier inventories: Insights from 11 regions worldwide. The Cryosphere 16 (7):2769–92. doi:10.5194/tc-16-2769-2022.
- Bertone, A., F. Zucca, C. Marin, C. Notarnicola, G. Cuozzo, K. Krainer, V. Mair, P. Riccardi, M. Callegari, and R. Seppi. 2019. An unsupervised method to detect rock glacier activity by using Sentinel-1 SAR interferometric coherence: A regional-scale study in the Eastern European Alps. Remote Sensing 11 (14):1711. doi:10.3390/rs11141711.
- Blöthe, J. H., C. Halla, E. Schwalbe, E. Bottegal, D. Trombotto Liaudat, and L. Schrott. 2021. Surface velocity fields of active rock glaciers and ice-debris complexes in the Central Andes of Argentina. Earth Surface Processes and Landforms 46 (2):504–22. doi:10.1002/esp.5042.
- Boeckli, L., A. Brenning, S. Gruber, and J. Noetzli. 2012. A statistical approach to modelling permafrost distribution in the European Alps or similar mountain ranges. The Cryosphere 6 (1):125–40. doi:10.5194/tc-6-125-2012.
- Bosson, J. B., M. Huss, and E. Osipova. 2019. Disappearing World Heritage glaciers as a keystone of nature conservation in a changing climate. Earth’s Future 7 (4):469–79. doi:10.1029/2018EF001139.
- Bosson, J.-B., and C. Lambiel. 2016. Internal structure and current evolution of very small debris-covered glacier systems located in alpine permafrost environments. Frontiers in Earth Science 4:39. doi:10.3389/feart.2016.00039.
- Brazier, V., M. P. Kirkbride, and I. F. Owens. 1998. The relationship between climate and rock glacier distribution in the Ben Ohau Range, New Zealand. Geografiska Annaler. Series A, Physical Geography 80:193–207. doi:10.1111/j.0435-3676.1998.00037.x.
- Brencher, G., A. L. Handwerger, and J. S. Munroe. 2021. InSAR-based characterization of rock glacier movement in the Uinta Mountains, Utah, USA. The Cryosphere 15:4823–44. doi:10.5194/tc-15-4823-2021.
- Charbonneau, A. A., and D. J. Smith. 2018. An inventory of rock glaciers in the central British Columbia Coast Mountains, Canada, from high resolution Google Earth imagery. Arctic, Antarctic, and Alpine Research 50. doi:10.1080/15230430.2018.1489026.
- Cicoira, A., J. Beutel, J. Faillettaz, and A. Vieli. 2019. Water controls the seasonal rhythm of rock glacier flow. Earth and Planetary Science Letters 528:115844. doi:10.1016/j.epsl.2019.115844.
- Cusicanqui, D., A. Rabatel, C. Vincent, X. Bodin, E. Thibert, and B. Francou. 2021. Interpretation of volume and flux changes of the Laurichard Rock Glacier between 1952 and 2019, French Alps. Journal of Geophysical Research: Earth Surface 126. doi:10.1029/2021JF006161.
- Delaloye, R., C. Lambiel, and I. Gärtner-Roer. 2010. Overview of rock glacier kinematics research in the Swiss Alps. Geographica Helvetica 65 (2):135–45. doi:10.5194/gh-65-135-2010.
- Deluigi, N., C. Lambiel, and M. Kanevski. 2017. Data-driven mapping of the potential mountain permafrost distribution. Science of the Total Environment 590:370–80. doi:10.1016/j.scitotenv.2017.02.041.
- Echelard, T., J. M. Krysiecki, M. Gay, and P. Schoeneich. 2013. Détection des mouvements de glaciers rocheux dans les Alpes Françaises par interférométrie radar différentielle (D-InSAR) dérivée des archives satellitaires ERS (European Remote Sensing). Geomorphologie: Relief, Processus, Environnement 19:231–42. doi:10.4000/geomorphologie.10264.
- Fitzsimons, S. J., and H. Veit. 2001. Geology and geomorphology of the European Alps and the Southern Alps of New Zealand: A comparison. Mountain Research and Development 21:340–49. doi:10.1659/0276-4741(2001)021[0340:GAGOTE]2.0.CO;2.
- Fleischer, F., F. Haas, L. Piermattei, M. Pfeiffer, T. Heckmann, M. Altmann, J. Rom, M. Stark, M. H. Wimmer, and N. Pfeifer. 2021. Multi-decadal (1953–2017) rock glacier kinematics analysed by high-resolution topographic data in the upper Kaunertal, Austria. The Cryosphere 15:5345–69. doi:10.5194/tc-15-5345-2021.
- Haeberli, W., B. Hallet, L. Arenson, R. Elconin, O. Humlum, A. Kääb, V. Kaufmann, B. Ladanyi, N. Matsuoka, S. Springman, et al. 2006. Permafrost creep and rock glacier dynamics. Permafrost and Periglacial Processes 17:189–214. doi:10.1002/ppp.561.
- Hanssen, R. F., T. M. Weckwerth, H. A. Zebker, and R. Klees. 1999. High-resolution water vapor mapping from interferometric radar measurements. Science 283:1297–99. doi:10.1126/science.283.5406.1297.
- Henderson, R. D., and S. M. Thompson. 1999. Extreme rainfalls in the Southern Alps of New Zealand. Journal of Hydrology (New Zealand) 38:309–30.
- Huss, M., B. Bookhagen, C. Huggel, D. Jacobsen, R. S. Bradley, J. J. Clague, M. Vuille, W. Buytaert, D. R. Cayan, and G. Greenwood. 2017. Toward mountains without permanent snow and ice. Earth’s Future 5:418–35. doi:10.1002/2016EF000514.
- Jeanneret, F. 1975. Blockgletscher in den Südalpen Neuseelands. Zeitschrift für Geomorphologie N.F 19:83–94.
- Johnson, G., H. Chang, and A. Fountain. 2021. Active rock glaciers of the contiguous United States: Geographic information system inventory and spatial distribution patterns. Earth System Science Data 13:3979–94. doi:10.5194/essd-13-3979-2021.
- Jones, D. B., S. Harrison, K. Anderson, H. L. Selley, J. L. Wood, and R. A. Betts. 2018. The distribution and hydrological significance of rock glaciers in the Nepalese Himalaya. Global and Planetary Change 160:123–42. doi:10.1016/j.gloplacha.2017.11.005.
- Jones, D. B., S. Harrison, K. Anderson, and W. B. Whalley. 2019. Rock glaciers and mountain hydrology: A review. Earth-Science Reviews 193:66–90. doi:10.1016/j.earscirev.2019.04.001.
- Kääb, A., R. Frauenfelder, and I. Roer. 2007. On the response of rockglacier creep to surface temperature increase. Global and Planetary Change 56:172–87. doi:10.1016/j.gloplacha.2006.07.005.
- Kääb, A., T. Strozzi, T. Bolch, R. Caduff, H. Trefall, M. Stoffel, and A. Kokarev. 2021. Inventory and changes of rock glacier creep speeds in Ile Alatau and Kungöy Ala-Too, northern Tien Shan, since the 1950s. The Cryosphere 15:927–49. doi:10.5194/tc-15-927-2021.
- Kirkbride, M. P., and V. Brazier. 1995. On the sensitivity of Holocene talus-derived rock glaciers to climate change in the Ben Ohau Range, New Zealand. Journal of Quaternary Science 10:353–65. doi:10.1002/jqs.3390100405.
- Kummert, M., and R. Delaloye. 2018. Mapping and quantifying sediment transfer between the front of rapidly moving rock glaciers and torrential gullies. Geomorphology 309:60–76. doi:10.1016/j.geomorph.2018.02.021.
- Lambiel, C., and R. Delaloye. 2004. Contribution of real-time kinematic GPS in the study of creeping mountain permafrost: Examples from the Western Swiss Alps. Permafrost and Periglacial Processes 15:229–41. doi:10.1002/ppp.496.
- Lambiel, C., R. Delaloye, T. Strozzi, R. Lugon, H. Raetzo. 2008. ERS InSAR for assessing rock glacier activity. In Ninth International Conference on Permafrost, ed. K. Kane and D. L. Hinkel, 219–223. Fairbanks: University of Alaska Fairbanks.
- Lambiel, C., and E. Reynard. 2001. Regional modelling of present, past and future potential distribution of discontinuous permafrost based on a rock glacier inventory in the Bagnes-Hérémence area (Western Swiss Alps). Norsk Geografisk Tidsskrift-Norwegian Journal of Geography 55:219–23. doi:10.1080/00291950152746559.
- Lamont, G. N., T. J. Chinn, and B. B. Fitzharris. 1999. Slopes of glacier ELAs in the Southern Alps of New Zealand in relation to atmospheric circulation patterns. Global and Planetary Change 22:209–19. doi:10.1016/S0921-8181(99)00038-7.
- Lilleøren, K. S., and B. Etzelmüller. 2011. A regional inventory of rock glaciers and ice-cored moraines in Norway. Geografiska Annaler, Series A: Physical Geography 93:175–91. doi:10.1111/j.1468-0459.2011.00430.x.
- LINZ. 2022. Accessed March 22, 2023. https://www.linz.govt.nz/our-work/projects/crown-aerial-film-archive-historical-imagery-scanning-project.
- Liu, L., C. I. Millar, R. D. Westfall, and H. A. Zebker. 2013. Surface motion of active rock glaciers in the Sierra Nevada, California, USA: Inventory and a case study using InSAR. The Cryosphere 7:1109–19. doi:10.5194/tc-7-1109-2013.
- Macara, G. R. 2016. The climate and weather of Canterbury. NIWA Science and Technology Series 68: 44. https://niwa.co.nz/static/web/canterbury_climatology_second_ed_niwa.pdf.
- Marcer, M., X. Bodin, A. Brenning, P. Schoeneich, R. Charvet, and F. Gottardi. 2017. Permafrost favorability index: Spatial modeling in the French Alps using a rock glacier inventory. Frontiers in Earth Science 5 doi:10.3389/feart.2017.00105.
- Marcer, M., A. Cicoira, D. Cusicanqui, X. Bodin, T. Echelard, R. Obregon, and P. Schoeneich. 2021. Rock glaciers throughout the French Alps accelerated and destabilised since 1990 as air temperatures increased. Communications Earth & Environment 2:1–11. doi:10.1038/s43247-021-00150-6.
- Marcer, M., S. Ringsø Nielsen, C. Ribeyre, M. Kummert, P. A. Duvillard, P. Schoeneich, X. Bodin, and K. Genuite. 2020. Investigating the slope failures at the Lou rock glacier front, French Alps. Permafrost and Periglacial Processes 31:15–30. doi:10.1002/ppp.2035.
- McGregor, V. R. 1967. Holocene moraines and rock glaciers in the Central Ben Ohau Range, South Canterbury, New Zealand. Journal of Glaciology 6:737–48. doi:10.3189/S0022143000019973.
- Nishiguchi, T., S. Tsuchiya, and F. Imaizumi. 2017. Detection and accuracy of landslide movement by InSAR analysis using PALSAR-2 data. Landslides 14:1483–90. doi:10.1007/s10346-017-0821-z.
- Putnam, A. E., J. M. Schaefer, G. H. Denton, D. J. A. Barrell, R. C. Finkel, B. G. Andersen, R. Schwartz, T. J. H. Chinn, and A. M. Doughty. 2012. Regional climate control of glaciers in New Zealand and Europe during the pre-industrial Holocene. Nature Geoscience 5:627–30. doi:10.1038/ngeo1548.
- Rangecroft, S., S. Harrison, K. Anderson, J. Magrath, A. P. Castel, and P. Pacheco. 2014. A first rock glacier inventory for the Bolivian Andes. Permafrost and Periglacial Processes 25:333–43. doi:10.1002/ppp.1816.
- Ran, Z., and G. Liu. 2018. Rock glaciers in Daxue Shan, south-eastern Tibetan Plateau: An inventory, their distribution, and their environmental controls. The Cryosphere 12:2327–40. doi:10.5194/tc-12-2327-2018.
- RGIK. 2020. Rock glacier inventory using InSAR (kinematic approach), Practical Guidelines (version 3.0.2). IPA Action Group Rock glacier inventories and kinematics (Ed.). https://bigweb.unifr.ch/Science/Geosciences/Geomorphology/Pub/Website/CCI/Guidelines/RGI_ka_InSAR-based_Guidelines_v.3.0.2.pdf.
- RGIK. 2022. Towards standard guidelines for inventorying rock glaciers: Baseline concepts (version 4.2.2). IPA Action Group Rock glacier inventories and kinematics (Ed.). https://bigweb.unifr.ch/Science/Geosciences/Geomorphology/Pub/Website/IPA/Guidelines/V4/220331_Baseline_Concepts_Inventorying_Rock_Glaciers_V4.2.2.pdf.
- Rosen, P., S. Hensley, I. Joughin, F. Li, S. Madesn, E. Rodriguez, and R. Goldstein. 2000. Synthetic aperture radar interferometry. Proceedings of the IEEE 88 (3):333–82. doi:10.1109/5.838084.
- Sattler, K., B. Anderson, A. Mackintosh, K. Norton, and M. de Róiste. 2016. Estimating permafrost distribution in the maritime Southern Alps, New Zealand, based on climatic conditions at rock glacier sites. Frontiers in Earth Science 4:1–17. doi:10.3389/feart.2016.00004.
- Scapozza, C., C. Lambiel, C. Bozzini, S. Mari, and M. Conedera. 2014. Assessing the rock glacier kinematics on three different timescales: A case study from the southern Swiss Alps. Earth Surface Processes and Landforms 39:2056–69. doi:10.1002/esp.3599.
- Schaefer, J. M., G. H. Denton, M. Kaplan, A. Putnam, R. C. Finkel, D. J. A. Barrell, B. G. Andersen, R. Schwartz, A. Mackintosh, T. Chinn, et al. 2009. High-frequency holocene glacier fluctuations in New Zealand differ from the northern signature. Science 324:622–25. doi:10.1126/science.1169312.
- Schaffer, N., S. MacDonell, M. Réveillet, E. Yáñez, and R. Valois. 2019. Rock glaciers as a water resource in a changing climate in the semiarid Chilean Andes. Regional Environmental Change 19:1263–79. doi:10.1007/s10113-018-01459-3.
- Schmid, M. O., P. Baral, S. Gruber, S. Shahi, T. Shrestha, D. Stumm, and P. Wester. 2015. Assessment of permafrost distribution maps in the Hindu Kush Himalayan region using rock glaciers mapped in Google Earth. The Cryosphere 9:2089–99. doi:10.5194/tc-9-2089-2015.
- Scotti, R., F. Brardinoni, S. Alberti, P. Frattini, and G. Crosta. 2013. A regional inventory of rock glaciers and protalus ramparts in the central Italian Alps. Geomorphology 186:136–49. doi:10.1016/j.geomorph.2012.12.028.
- Seppi, R., T. Zanoner, A. Carton, A. Bondesan, R. Francese, L. Carturan, M. Zumiani, M. Giorgi, and A. Ninfo. 2014. Current transition from glacial to periglacial processes in the Dolomites (South-Eastern Alps). Geomorphology 228:71–86. doi:10.1016/j.geomorph.2014.08.025.
- Strozzi, T., R. Cadu, N. Jones, C. Barboux, R. Delaloye, X. Bodin, A. Kääb, E. Mätzler, and L. Schrott. 2020. Monitoring rock glacier kinematics with satellite synthetic aperture radar. Remote Sensing 12:559. doi:10.3390/rs12030559.
- Strozzi, T., R. Delaloye, A. Kääb, C. Ambrosi, E. Perruchoud, and U. Wegmüller. 2010. Combined observations of rock mass movements using satellite SAR interferometry, differential GPS, airborne digital photogrammetry, and airborne photography interpretation. Journal of Geophysical Research: Earth Surface 115:1–11. doi:10.1029/2009JF001311.
- Strozzi, T., U. Wegmüller, L. Tosi, G. Bitelli, and V. Spreckels. 2001. Land subsidence monitoring with differential SAR interferometry. Photogrammetric Engineering and Remote Sensing 67:1261–70.
- Sturman, A., and H. Wanner. 2001. A comparative review of the weather and climate of the Southern Alps of New Zealand and the European Alps. Mountain Research and Development 21:359–69. doi:10.1659/0276-4741(2001)021[0359:ACROTW]2.0.CO;2.
- Terralink. 2004–2010. Canterbury 0.75 m rural aerial photomosaic. Wellington: Terralink International limited. Index file of individual images. Accessed March 22, 2023. https://data.linz.govt.nz/layer/1893.
- Villarroel, C. D., G. T. Beliveau, A. P. Forte, O. Monserrat, and M. Morvillo. 2018. DInSAR for a regional inventory of active rock glaciers in the Dry Andes Mountains of Argentina and Chile with Sentinel-1 data. Remote Sensing 10:1588. doi:10.3390/rs10101588.
- Vivero, S., X. Bodin, D. Farías-Barahona, S. MacDonell, N. Schaffer, B. A. Robson, and C. Lambiel. 2021. Combination of aerial, satellite, and UAV photogrammetry for quantifying rock glacier kinematics in the Dry Andes of Chile (30°S) since the 1950s. Frontiers in Remote Sensing 2:1–17. doi:10.3389/frsen.2021.784015.
- Vivero, S., H. Hendrickx, A. Frankl, R. Delaloye, and C. Lambiel. 2022. Kinematics and geomorphological changes of a destabilising rock glacier captured from close-range sensing techniques (Tsarmine rock glacier, Western Swiss Alps). Frontiers in Earth Sciences 10:1017949. doi:10.3389/feart.2022.1017949.
- Wagner, T., A. Brodacz, K. Krainer, and G. Winkler. 2020. Active rock glaciers as shallow groundwater reservoirs, Austrian Alps. Grundwasser 25:215–30. doi:10.1007/s00767-020-00455-x.
- Wagner, T., S. Kainz, K. Helfricht, A. Fischer, M. Avian, K. Krainer, and G. Winkler. 2021. Assessment of liquid and solid water storage in rock glaciers versus glacier ice in the Austrian Alps. Science of the Total Environment 800:149593. doi:10.1016/j.scitotenv.2021.149593.
- Wagner, T., R. Pleschberger, S. Kainz, M. Ribis, A. Kellerer-Pirklbauerm, K. Krainer, R. Philippitsch, and G. Winkler. 2020. The first consistent inventory of rock glaciers and their hydrological catchments of the Austrian Alps. Austrian Journal of Earth Sciences 113:1–23. doi:10.17738/ajes.2020.0001.
- Wang, X., L. Liu, L. Zhao, T. Wu, Z. Li, and G. Liu. 2017. Mapping and inventorying active rock glaciers in the northern Tien Shan of China using satellite SAR interferometry. The Cryosphere 11:997–1014. doi:10.5194/tc-11-997-2017.
- Wee, J., and R. Delaloye. 2022. Post-glacial dynamics of an alpine Little Ice Age glacitectonized frozen landform (Aget, western Swiss Alps). Permafrost and Periglacial Processes 33: 370–85. doi:10.1002/ppp.2158.
- Winkler, S., and C. Lambiel. 2018. Age constraints of rock glaciers in the Southern Alps/New Zealand – Exploring their palaeoclimatic potential. The Holocene 28:778–90. doi:10.1177/0959683618756802.
- Wirz, V., S. Gruber, R. S. Purves, J. Beutel, I. Gärtner-Roer, S. Gubler, and A. Vieli. 2016. Short-term velocity variations at three rock glaciers and their relationship with meteorological conditions. Earth Surface Dynamics 4:103–23. doi:10.5194/esurf-4-103-2016.