
ABSTRACT
In this article, we study snow avalanche activity during the snow seasons of 2017–2020 using four automatic time-lapse cameras strategically positioned along the southwestern slope of Tasiapik Valley, near the village of Umiujaq, in Nunavik (northern Québec, Canada). Over the three snow seasons, cameras helped to detect evidence of 130 avalanche events, scattered over seventy-eight distinct avalanche days. The evolution of weather conditions prior to each avalanche release was detailed according to data from a nearby weather station. Moreover, the time of release, the release type, the surface texture, and whether rocky material was present in the deposits were documented from the photographs. To explore relationships between weather data and avalanche releases, conditional inference tree (CIT) analysis was conducted. Results of the CIT analysis showed that there are different weather patterns associated with avalanche releases depending on the season, and significant thresholds values were defined. In winter, the avalanche probability was greater when three-day snowfall total exceeded 10 cm. In spring, the avalanche probability was greater when cumulative melting degree-days were less than forty-six and when daily minimum air temperature was greater than 2°C. Moreover, cornice failures were found to be a major component of the avalanche dynamic in Tasiapik Valley, mainly because of the slope’s morphology. They have also been the cause of the three largest volume and longest runout avalanches observed by cameras in this study, highlighting potential risks for local communities. The probability of observing cornice failures is enhanced on days when maximum air temperature is greater than −8°C in winter conditions, whereas in spring conditions it is enhanced by daily maximum air temperature greater than 2.5°C. This study represents a necessary first step toward avalanche forecasting based on weather data in Nunavik. Efforts should be continued given the expected higher frequency of natural hazards in northern regions as a consequence of recent climate changes.
Introduction
Snow avalanches (hereafter avalanches) are ranked as the second deadliest natural hazard in the province of Québec, eastern Canada (Hétu, Brown, and Germain Citation2008, Citation2011; Landry et al. Citation2013; Woods et al. Citation2014; Germain Citation2016; Gauthier, Germain, and Hétu Citation2017). Even though the region of Nunavik, in northern Québec, is generally flat, some steep slopes reaching altitudes of well over 80 m have already been the scene of fatal avalanches due to their proximity to villages constructed inside or near steep glacial valleys (Bérubé Citation2000; Lied and Domaas Citation2000; Campbell et al. Citation2007; Germain Citation2016). Moreover, according to Germain (Citation2016), the environmental conditions encountered in Nunavik, which include steep, heavily weathered slopes; high snowfall; and strong winds, are particularly suitable to avalanches.
In previous studies, the potential for avalanches has been assessed in proximity to Nunavik villages based on recommendations made in a coroner’s report following the tragedy of Kangiqsualujjuaq on 1 January 1999 (Bérubé Citation2000; Lied and Domaas Citation2000; Campbell et al. Citation2007; Germain Citation2016). Considering the current population growth in Nunavik and the increasing number of tourists yearly, the risks related to avalanches keep growing, highlighting the need for more avalanche research in the region (Duhaime Citation2007; Hétu, Brown, and Germain Citation2011; Germain Citation2016; L’Hérault et al. Citation2017; Veilleux, Bhiry, and Decaulne Citation2019; Decaulne et al. Citation2021; Loiseau Citation2021; Veilleux, Decaulne, and Bhiry Citation2021).
The village of Umiujaq, in Nunavik, has had a considerable increase in tourism since the inauguration of the nearby Tursujuq National Park in 2013 (Administration Régionale Kativik Citation2007; Antomarchi, Joliet, and Chanteloup Citation2020). From the village, a road travels toward Tursujuq National Park’s entrance, crossing Tasiapik Valley’s steep southwestern slopes. Although there are no major human structures within Tasiapik Valley, this road is frequently traveled by locals and tourists to get to the park and to explore the area (Administration Régionale Kativik Citation2007). Recent avalanche studies conducted in Tasiapik Valley documented cornice formation and the dominance of avalanches from cornice collapses in the area (Veilleux Citation2019; Veilleux, Decaulne, and Bhiry Citation2021), as well as the potential for avalanches to reach the road (Veilleux Citation2019; Loiseau Citation2021; Veilleux, Decaulne, and Bhiry Citation2021). They also studied the possibility of two different avalanche regimes in the region (one in winter and one in spring). Yet the meteorological conditions conducive to avalanche releases are still not well documented.
In this study, we characterized and contextualized avalanche activity in Tasiapik Valley over three snow seasons (2017–2020) using time-lapse cameras and weather data. We also examined possible relationships between weather data and avalanche releases using conditional inference trees (Hothorn, Hornik, and Zeileis Citation2006; Hothorn and Zeielis Citation2015; Horton, Towell, and Haegeli Citation2020). Our study shows that cornice failures represent the main avalanche issue in the area; however, we also acknowledge the methodological limits of this study as well as the limits of avalanche regimes. Taking a broader regional perspective, we provide a comparison of the identified weather conditions favoring avalanche releases in Tasiapik Valley with those in the Chic-Chocs Mountain Range in Gaspésie (eastern Canada), where most of the existing avalanche research in Québec has been conducted (e.g., Dubé, Filion, and Hétu Citation2004; Hétu Citation2007; Germain, Filion, and Hétu Citation2009; Fortin, Hétu, and Germain Citation2011; Graveline and Germain Citation2016; Gauthier, Germain, and Hétu Citation2017; Gratton, Germain, and Boucher Citation2019; Germain and Stabile-Caillé Citation2023).
Study area
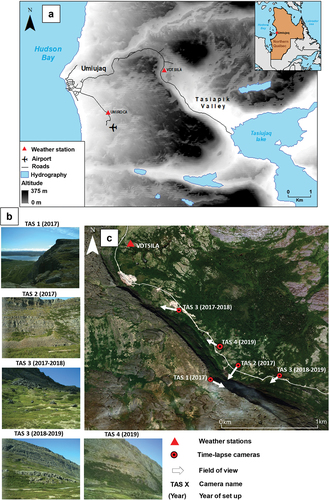
Tasiapik Valley (56°33′ N, 76°28′ W) is a 4.5-km-long and 1.5-km-wide valley located 5 km east of the village of Umiujaq, on the eastern coast of Hudson Bay, in Nunavik, Québec (). The valley follows a northwest–southeast orientation, and the height of its southwest (SW) slope increases from upstream (~50 m) to downstream (~300 m). The relief of the studied slope is asymmetrical, presenting a very steep northeastern front (almost vertical) and a gently inclined (about 5°–10°) SW slope that extends toward the Hudson Bay. The SW slope is also free of wind obstacles (Dionne Citation1976; Michaud and Dionne Citation1987; Veilleux, Bhiry, and Decaulne Citation2019). Luckman (Citation1978) has identified such topography, where leeward slope can accumulate drifting snow for cornice formation, as having a particularly high potential for avalanches. In Tasiapik Valley, according to Veilleux, Decaulne, and Bhiry (Citation2021), the optimal wind direction for cornice formation is 202.5°–247.5°, which corresponds to south–southwest to west–southwest prevailing winds.
Figure 1. (a) Location of Tasiapik Valley within the Umiujaq Village area. (b) Frame view of each automatic time-lapse camera used in the study. (c) Location of automatic time-lapse cameras along Tasiapik Valley SW slope. Data source: Ministère de l’Énergie et des Ressources naturelles (Citation2019) and Ministère des Ressources naturelles et de la Faune (Citation2019).
Umiujaq’s region is located within the discontinuous permafrost zone and has a subarctic climate according to Köppen’s classification (Allard et al. Citation2007; Allard and Lemay Citation2012; Lemieux et al. Citation2020). The valley itself is characterized by a microclimate regulated by the freeze–thaw cycles of Lake Tasiujaq, which warms the air when ice-free (Busseau et al. Citation2017). The annual mean air temperature generally remains below 0°C (between −4°C and −6°C typically), and it receives a yearly average of 550 mm of precipitation, of which about 40 percent is snowfall (Ménard, Allard, and Michaud Citation1998; Charron Citation2015; Lemieux et al. Citation2020).
The valley floor is mainly covered by low shrubs, ericaceous plants, and lichens in the upstream part. Further downstream, the vegetation cover is relatively denser and more diverse (trees, shrubs, herbs, lichens, and mosses). The shrubification of the valley over the twentieth century tends to suggest that slope processes are not as active as they have been (Ménard, Allard, and Michaud Citation1998; Provencher-Nolet, Bernier, and Lévesque Citation2014; Lemay et al. Citation2018; Pelletier, Allard, and Levesque Citation2018). However, evidence from automatic time-lapse cameras showed that short-term slope dynamic processes, such as rockfalls and avalanches, are still active (Veilleux, Bhiry, and Decaulne Citation2019; Veilleux, Decaulne, and Bhiry Citation2021).
Methods
Automatic time-lapse cameras
A total of four automatic time-lapse cameras were used to document avalanche events from November 2017 to June 2020. The cameras were positioned along the SW slope of Tasiapik Valley in areas where terrain features showed potential for avalanches (i.e., where scree slopes are present and vegetation is rare/nonexistent; Veilleux Citation2019; Veilleux, Bhiry, and Decaulne Citation2019). The four cameras captured color images at a 1080p resolution (2048 × 1536) and are still in use.
The cameras were named in reference to the valley (TAS for Tasiapik) followed by a number from one to four for identification. One camera is located at the top of the slope, documenting the dynamics (growth processes and failures) of a snow cornice over the snow season with a side view of the ridgeline (TAS 1). It is located at an altitude of 206 m. Another camera (TAS 2) targets the avalanche track below the cornice from its apex to the distal part with its ~170-m-high by ~200-m-wide field of view (Veilleux, Decaulne, and Bhiry Citation2021). The TAS 2 camera is located at an altitude of 35 m and about 175 m from the talus slope.
The TAS 3 camera recorded two distinct avalanche tracks, one upstream in 2017–2018 and another further downstream in 2018–2019 ( and ). During 2017–2018, the TAS 3 camera was placed at an altitude of 75 m and was located roughly 120 m away from the main avalanche track it monitored. Its field of view was about ~95 m high by ~200 m wide. From summer 2018 and onwards, the TAS 3 camera was set more downstream at an altitude of 15 m and about 250 m from the slope. At this new position, TAS 3 now had a field of view ~200 m high by ~200 m wide. In October 2019, the TAS 4 camera was added to the monitoring system of this study. It was installed in the median part of the valley at an altitude of 42 m and ~200 m from the targeted avalanche track. It has a field of view of ~170 m high by ~200 m wide. These four cameras were all placed in animal/weatherproof metallic cases and attached to steel poles between 1.5 m to 2.0 m from ground level.
For the first snow season of the study (2017–2018), all of the functioning cameras were set to take pictures hourly from 9:00 a.m. to 5:00 p.m. local time. From summer 2018 onwards, the settings were changed so that pictures would be taken from 9:00 a.m. to 4:00 p.m. inclusive, because frequent low lighting conditions were encountered at 5:00 p.m. during the first year, which contributed to battery depletion. From 2017 to 2020, we collected nearly 39,500 photographs spanning three complete snow seasons. Each photograph was visually inspected to detect signs of avalanche deposits. While inspecting the photographs, we also compiled an Excel file that included the temperature recorded by the camera, the cloud coverage (clear, partly covered, fully covered), as well as whether the objective of the camera was clear or covered by fog, frost, blowing snow, etc. Such conditions unfortunately made the photographs unusable. The camera that was most affected by harsh weather conditions was TAS 1. In fact, in December 2017, 87 percent of the pictures that were taken by TAS 1 did not provide any valuable information regarding the snow cover or the cornice. Moreover, such conditions often affected visibility for many days in a row, meaning that an avalanche could have occurred but its deposits would not have been noticed because they may have been covered or altered during that time. To help address this issue, we plan to create a social media platform in which members of the local community will be able to report avalanche events and upload pictures of avalanche deposits in parts of the valley that are currently not monitored by cameras.
Meteorological data
Meteorological data recorded in the valley by the VDTSILA weather station of the Center d’études nordiques (CEN) climate monitoring network were used. This weather station has been recording valley conditions since 30 September 2012 (CEN Citation2020). It is in the upstream part of the valley at an altitude of 136 m and is within 2 km of all four automatic time-lapse cameras. It provided mean air temperature, maximum air temperature, minimum air temperature, mean wind direction, and mean wind speed data at the hourly and daily scales for the period from 1 November 2017 to 30 June 2020.
The days with efficient wind for cornice formation and loading were identified according to Li and Pomeroy (Citation1997) 4 m/s−1 to 11 m/s−1 threshold for optimal snow transportation combined with the optimal wind orientation measured in the area by Veilleux, Decaulne, and Bhiry (Citation2021). Data from the VDTSILA weather station are available for download via the Nordicana D platform of the Center d’études nordiques (CEN Citation2020).
Snowfall data were extracted from snow cover depth data measured directly at the VDTSILA weather station by Québec’s Ministère de l’Environnement et de la Lutte contre les Changements Climatiques (MELCC) since 2012 (MELCC Citation2019). Rainfall has also been measured hourly in the area since 2012 at the VDTSILA station by an automatic cumulative rain gauge belonging to the MELCC. These installations are the closest to the study area, with Kuujjuarapik’s weather stations (160 km south) and Inukjuaq’s weather station (230 km north) being the next closest for weather data collection in the region.
Statistical analysis
In the present study, because our aim was to explore relationships between weather data and avalanche releases, a conditional inference tree analysis was conducted using the ctree function found in the partykit package that can be implemented in the statistical software R (Hothorn and Zeileis Citation2015). Our data set was composed of twenty-three independent variables, which are listed in . The dependent variable was binary, and it expressed whether avalanche deposits had been observed that day (avalanche day). The conditional inference tree was prioritized over other types of statistical analyses because of the limited number of avalanche days contained in our data set. Furthermore, it produces a simple representation that explains complex relationships between the predictors and the dependdnt variable (Horton, Towell, and Haegeli Citation2020). Because our data set is small, we decided to keep the threshold p value at .05 for variable splits (Horton, Towell, and Haegeli Citation2020).
Table 1. Codes, signification, and units of meteorological variables contained in the data set.
Classification of avalanche seasons: Winter and spring regimes
According to the observations of Veilleux, Decaulne, and Bhiry (Citation2021), there is a potential for two main snow avalanche regimes in the Tasiapik Valley area, the first occurring in winter conditions and the other in spring conditions. To examine whether weather conditions favorable to avalanche release changed according to these regimes, we needed to split our avalanche observations by adding a variable expressing the weather conditions in which they occurred (e.g., Dreier et al. Citation2016; Kern et al. Citation2021; Yang, He, and Liu Citation2022). Hétu (Citation2007) has also split avalanche events into two major regimes according to the seasonality in Gaspésie (eastern Canada).
Based on early observations, we decided to define the start of winter weather conditions as the first day when mean air temperature fell below 0°C, whereas the start of spring weather conditions was when daily mean air temperature increased above 0°C at the end of winter conditions. The spring regime ended when there was no more snow in the valley area or when the cameras ran out of batteries and therefore stopped collecting photographs.
Results
Winter and spring seasons summary
Over the three winter seasons documented in this study, the four automatic time-lapse cameras helped us to detect forty-six winter avalanche events scattered over forty-two distinct avalanche days in a total of 606 winter days (). The duration of the winter season varied from 213 days in 2017–2018 down to 181 days in 2019–2020 (). The percentage of winter days with efficient wind conditions for cornice formation (and growth) varied from 18 percent in 2017–2018 to 17 percent in 2018–2019 and 12 percent in 2019–2020. The mean air temperature during the winter seasons remained constant, measuring approximately −11.5°C each season. The greatest amount of snowfall occurred in 2017–2018 according to data from the VDTSILA weather station.
Figure 2. Calendar of avalanche and cornice–avalanche events observed in photographs from Tasiapik Valley’s automatic time-lapse cameras from winter 2017 to spring 2020.
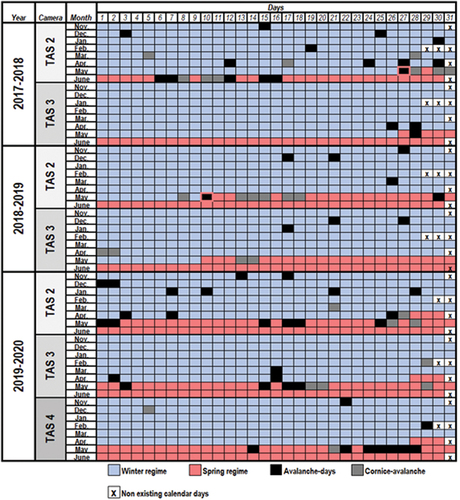
Table 2. Summary table of the main characteristics of the three winter seasons presented in the study.
Over the three spring seasons documented in this study, the four automatic time-lapse cameras helped to detect eight-four avalanche deposits over a total of 130 days (). Avalanche deposits were observed to occur on thirty-six distinct avalanche days. The duration of the spring season varied from 23 to 64 days (). The mean air temperature was close to 3°C during the three spring periods in the study, with 2018 being the coldest with a mean air temperature of 2.4°C over a 23-day span. Spring 2019 was marked by heavy rainfall after the temperature rose to over 0°C.
Table 3. Summary table of the main characteristics of the three spring seasons presented in the study.
Winter 2017–2018
General weather conditions
According to the mean air temperature data registered by VDTSILA, the shift from autumn conditions to winter conditions occurred on 26 October 2017. Winter conditions then lasted until 27 May, for a total of 213 days. Over the winter, snowfall totaled 629 cm in the upper valley area, and snow cover depth reached a maximum of 100 cm at the VDTSILA location on 17 April. The winter season started with frequent blizzard-like conditions as snowfall totaled 118 cm between 1 November and 20 November inclusive, as reported by Veilleux (2021).
For the whole winter season, the mean air temperature was −11.5°C and thirty-eight days (18 percent) had efficient wind conditions suitable for snow transportation along the gently inclined SW slope toward the ridgeline ().
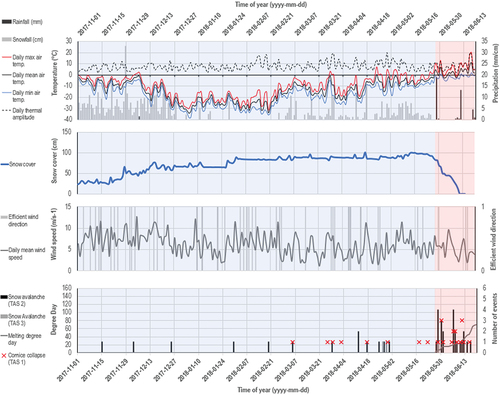
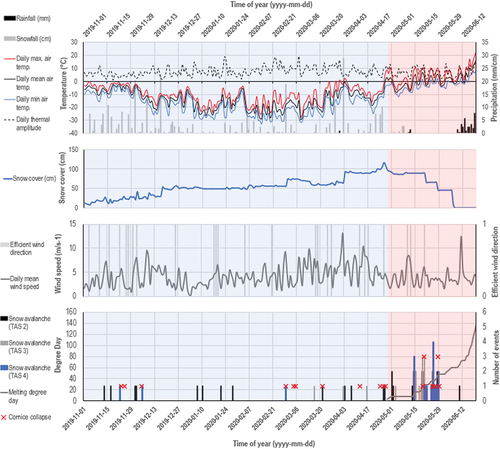
Figure 3. Occurrence of snow avalanche and cornice collapse events in relation with the evolution of weather conditions recorded at the VDTSILA weather station from 1 November 2017 to 19 June 2018. Data source: CEN (Citation2020) and Ministère de l’environnement et de la Lutte contre les changements climatiques (Citation2019). The winter regime is shown in blue, and the spring regime is shown in red.
Observed avalanche activity and characteristics of the deposits
A total of fifteen avalanche deposits were observed in photographs. These fifteen events occurred on fourteen distinct avalanche days. Avalanche deposits were mainly recorded by the TAS 2 camera. In fact, the TAS 2 camera recorded thirteen avalanche deposits, whereas only two avalanche deposits were recorded by TAS 3. From its position on the slope’s ridgeline, the TAS 1 camera detected evidence of eight cornice collapses in winter conditions, of which three could be directly related to avalanche deposits observed in photographs from TAS 2 below. The first snow avalanche deposits of the winter were observed on 15 November 2017, and the first cornice collapse was reported on 5 March 2018.
Of all of the avalanche deposits that were observed that winter, 26 percent appeared in photographs taken during the day (between 10:00 a.m. and 5:00 p.m.) and 73 percent likely occurred at night, because they were observed on the first photograph of the day at 9:00 a.m.
Most of the observed avalanches were loose. Only three avalanches in winter left clear crown shapes visible within the snow cover, which is typically attributed to slab avalanches. These three deposits were observed on 5 March, 17 April, and 30 April. Notable among these three events, on 17 April 2018, a slab avalanche was triggered by a large cornice collapse and its deposits reached the road downslope ( and ). Seven out of the fifteen avalanche deposits could not be classified based on the photographs because of fog, frost, blowing snow, or poor lighting conditions/shade that impeded visibility and prevented us from clearly identifying the release type.
The surface texture of most of the deposits could be interpreted using the photographs. For the winter of 2017–2018, nine deposits presented a rounded snowball-like shape, whereas only one event’s deposits seemed to be formed of angular snow blocks. The remaining five deposits could not be characterized effectively due to their distance from the camera and/or poor view. It is noteworthy that all fifteen deposits appeared very white and devoid of any contaminants.
Meteorological conditions preceding avalanche releases
As mentioned above, the first avalanche deposits of the winter were observed in photographs from TAS 2 on 15 November 2017, exactly twenty days after the onset of winter conditions (). Prior to the observation of these deposits, 98 cm of snow had already fallen since 1 November, including 15 cm in the previous 48 hours. The evolution of weather conditions also shows that between 10 November and 15 November, the daily maximum air temperature increased progressively, going from −10.5°C to −2°C. The daily thermal amplitude on the day the deposits were observed was 10.5°C. Moreover, the two days before 15 November were days with efficient wind for cornice formation. The same type of meteorological scenario (i.e., warm fronts) prevailed on days prior to the observation of seven of the fifteen avalanche deposits that were observed by cameras that winter. The observed deposits that were preceded by this type of weather were seen on 15 November, 3 December, 5 March, 17 April, 24 April, 28 April, and 30 April 2018.
By contrast, the eight other times when avalanche deposits were recorded by cameras during the winter of 2017–2018 took place on seven distinct days following the onset of cold fronts. In most of the cases, large snowfall amounts could be observed over the 24 to 72 hours prior to the observation of avalanche deposits. For example, between 23 and 25 December (the date on which avalanche deposits were recorded by the TAS 2 camera), snowfall totaled 16 cm, and mean air temperature drastically decreased from −19°C to −29°C. Similar weather conditions were observed prior to the observation of avalanche deposits on 30 January, 28 March, 12 April (two events), 26 April, and 27 April.
Spring 2018
General weather conditions
Between the start of spring 2018, on 27 May and 19 June the mean air temperature was 2.4°C and rainfall totaled 39 mm (). During that time, a total of twenty-four avalanche deposits were observed (twenty-three in photographs from TAS 2 and one in photographs from TAS 3). These twenty-four events were documented as occurring on twelve distinct avalanche days. The last deposits of the season were observed on 16 June. Moreover, the pictures from TAS 1 provided evidence of eighteen cornice collapses scattered over eleven different days, the last being 15 June. Nine of the eighteen cornice collapses observed were directly related to avalanche deposits observed in photographs from TAS 2.
Observed avalanche activity and characteristics of the deposits
In spring 2018, the twenty-four avalanche deposits were observed on twelve different avalanche days. As in winter, it was the TAS 2 camera that captured the majority of avalanche activity (96 percent). The proportion of avalanche deposits that appeared in pictures taken during the day reversed in comparison with winter; that is, seventeen of the twenty-four deposits were observed between 10:00 a.m. and 5:00 p.m.
Again, the release type of most of the avalanches was loose (twenty-one out of twenty-four). Only one spring event, namely on 30 May, left a clear crown shape resulting from a slab avalanche visible in the snow cover. We were not able to clearly identify the release type of the two remaining avalanche deposits due to visibility issues.
The surface texture of most of the avalanche deposits was again characterized by a rounded snowball-like shape (thirteen out of twenty-four). In contrast, three out of twenty-four were characterized as angular and blocky (two on 30 May and the other on 5 June). For eight of the avalanche deposits (33 percent), surface texture could not be assessed from the photographs due to poor visibility.
Regarding the presence of contaminants, sixteen deposits presented a contaminated appearance, sometimes containing clearly visible incorporated rocky debris. The remaining eight did not seem to be contaminated according to our interpretation of the photographs.
Meteorological conditions preceding avalanche releases
During spring 2018, rainfall and the accumulation of melting degree-days (i.e., the sum of daily mean air temperatures above 0°C) appeared to be conducive to avalanche release. In fact, all of the avalanche deposits observed by time-lapse cameras that spring occurred on days with rainfall or on days that closely followed a rainfall episode (as observed from 28 to 31 May and from 11 to 12 June). Avalanche activity also seemed to peak at between the values of two and sixty cumulative melting degree-days, because new avalanche deposits were observed almost daily within that interval.
Winter 2018–2019
General weather conditions
In 2018–2019, the shift from autumn conditions to winter conditions occurred on 10 October, which was 21 days earlier than in the year before. Winter conditions remained until 10 May, totaling 212 days. According to data from the VDTSILA weather station, snowfall totaled 323 cm during the winter of 2018–2019, and a maximum snow cover depth of 70 cm on the valley floor was measured on 24 March 2019 (). Between 1 November 2018 and 10 May 2019, mean air temperature was again −11.5°C. Within that same time frame, 36 days were reported to have efficient wind conditions suitable for snow transportation according to the mean wind speed and wind orientation data recorded by the VDTSILA weather station.
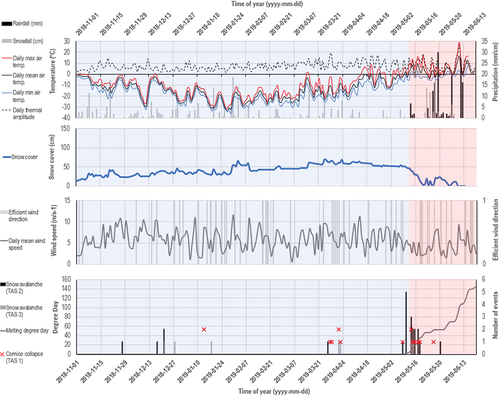
Figure 4. Occurrence of snow avalanche and cornice collapse events in relation with the evolution of weather conditions recorded at the VDTSILA weather station from 1 November 2018 to 19 June 2019. Data source: CEN (Citation2020) and Ministère de l’environnement et de la Lutte contre les changements climatiques (Citation2019). The winter regime is shown in blue, and the spring regime is shown in red.
A total of eleven avalanche deposits were recorded by the cameras: six by TAS 2 and five by TAS 3. The first avalanche deposits were detected in photographs from 27 November 2018. In addition, eight cornice failures were observed using the cameras, mostly by TAS 1 (six by TAS 1, two by TAS 3). The first two cornice failures were observed on the same day, on 13 January 2019. Matching our findings from the first year of the study, three of the eight cornice collapses were linked to avalanche deposits captured by the cameras below (one by TAS 2, two by TAS 3).
Observed avalanche activity and characteristics of the deposits
Over the winter of 2018–2019, six of the eleven deposits appeared in photographs taken between 10:00 a.m. and 4:00 p.m., whereas five were observed in the first picture of the day at 9:00 a.m. when nothing was visible beforehand. Once again, most of the avalanches had a loose release type (ten out of eleven). The only slab avalanche in winter conditions was observed in photographs from TAS 2 on 21 December. The surface texture of most of the deposits was unfortunately not characterizable because of visibility issues. Only three deposits (27 percent) could be characterized, and all three of them presented a rounded shape. Just like in the winter before, every deposit that was observed in winter conditions did not seem to be contaminated by debris. All eleven deposits appeared to be white and completely devoid of any contaminants that could have been eroded from the rock wall or reworked from the talus slope.
Meteorological conditions preceding avalanche releases
During winter 2018–2019, eleven avalanche deposits were observed on nine different avalanche days. Just as in the first year, seven of the deposits (64 percent) occurred on days preceded by the onset of a warm front. For instance, shortly before the observation of avalanche deposits on 17 December, 13 cm of snowfall was recorded in the preceding 72 hours, including 5 cm on the day the deposits were observed. Daily maximum air temperature also increased progressively, going from −26.5°C on 11 December to 0°C on 17 December. Efficient winds favoring lee-slope accumulation were also reported the day before and on the day that the deposits were observed. On 26 March, similar meteorological conditions were observed prior to the observation of avalanche deposits. Snowfall totaled 14 cm in the 72 hours preceding the event and daily mean air temperature increased by 5°C in the preceding 48 hours from −22°C to −17°C. Similar combinations of meteorological conditions also prevailed before the observation of avalanche deposits on 27 November, 27 December, 1 April, 2 April, and 8 May 2019.
The remaining four winter avalanche deposits (36 percent) were observed on two distinct avalanche days that followed what appeared to be cold fronts. Avalanche deposits were recorded in photographs from 21 December (three distinct deposits) and 17 January. On 21 December, 10 cm of snow fell in the preceding four days, and daily mean air temperature decreased by 8.5°C, including a drop of about 8°C in the 24 hours prior to the observation of avalanche deposits. Before the event of 17 January, no snowfall had been recorded up to a week before, and daily mean air temperature went from −10.5°C to −29°C over that same period.
Spring 2019
General weather conditions
Spring conditions in 2019 started on 10 May and ended on 19 June (forty-one days). During that time, mean air temperature was 3.2°C and rainfall reached an impressive total of 146 mm (). During this period, the time-lapse cameras helped us detect eighteen avalanche deposits (sixteen by TAS 2 and two by TAS 3). These eighteen events occurred on seven distinct avalanche days, the first being 10 May and the last being 30 May. From the ridgeline, the TAS 1 camera captured evidence of nine cornice failures, of which eight were directly associated with avalanche deposits observed the same day in pictures taken by TAS 2 and TAS 3 below. The last cornice failure event of spring 2019 occurred on 26 May 2019.
Figure 5. Occurrence of snow avalanche and cornice collapse events in relation with the evolution of weather conditions recorded at the VDTSILA weather station from 1 November 2019 to 30 June 2020. Data source: CEN (Citation2020) and Ministère de l’environnement et de la Lutte contre les changements climatiques (Citation2019). The winter regime is shown in blue, and the spring regime is shown in red.
Observed avalanche activity and characteristics of the deposits
Throughout the spring of 2019, 55 percent of the avalanche deposits appeared in photographs taken during the day. Accordingly, the remaining 45 percent of the avalanche deposits observed in Tasiapik Valley were likely released between 4:00 p.m. and the following morning.
The only slab avalanche that was visible in spring occurred on 17 May. This event followed approximately the same path as the 17 April 2018 event. However, this event had a slightly shorter runout because it stopped only a few meters short of the road ( and ). The seventeen other events were classed as loose avalanches.
The shape and surface texture of only eight of the deposits could be visually assessed. The other ten deposits were too far from the camera to clearly interpret the surface texture. Of the eight deposits that were interpreted, six were characterized as presenting a snowball-like shape. The remaining two deposits had a more angular surface texture.
Of the eighteen deposits, thirteen exhibited a contaminated aspect with some visible debris clusters and five deposits did not appear to be contaminated by debris. These five uncontaminated deposits were observed on 10 May (third event of the day), 14 May (first event of the day), 15 May (first event of the day), 17 May (first event of the day) and 18 May.
Meteorological conditions preceding avalanche releases
The eighteen avalanche deposits that were observed occurred during approximately the same weather conditions as in spring 2018. On 10 May, five distinct avalanche deposits were observed when mean air temperature rose above 0°C for the first time, reaching 2.0°C. On that same day, daily maximum air temperature peaked at 4.5°C. Then, from 13 to 15 May, intermittent rainfall episodes totaling 9.5 mm combined with warmer air temperature reaching a maximum of 14°C on 14 May likely contributed to the release of nine avalanches. Similar meteorological conditions were recorded shortly before the observation of avalanche deposits on 17, 18, and 30 May, the latter being the last event recorded by time-lapse cameras that spring. Once again, avalanche activity and cornice collapse seemed to peak between the values of two and fifty-five cumulative melting degree-days ().
Winter 2019–2020
General weather conditions
In 2019–2020, the shift from autumn to winter conditions occurred on 30 October according to data from VDTSILA. Thereafter, daily mean air temperature remained below 0°C until 28 April 2020 (181 days). Over the winter, snowfall totaled 304 cm, reaching a maximum snow cover of 117 cm on 27 April (). A total of twenty avalanche deposits were reported. These were scattered over nineteen different avalanche days (thirteen recorded by TAS 2, four by TAS 3, and three by the newly placed TAS 4). The first avalanche deposits were observed on 13 November 2019 in photographs recorded by TAS 2. Evidence of eleven cornice failures was also recorded primarily in photographs from TAS 1 but also in some from TAS 3 and TAS 4. Five cornice failures are likely to have led to the release of avalanches on the slopes below, according to our observations of avalanche deposits in corresponding photographs from the TAS 2, TAS 3, and TAS 4 cameras.
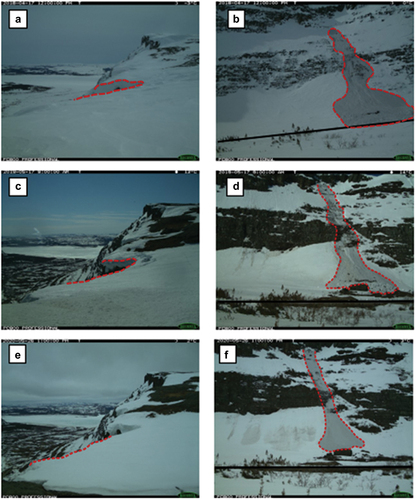
Figure 6. Examples of large cornice failures triggering avalanches: (a), (b) 17 April 2018, (c), (d) 17 May 2019, and (e), (f) 26 May 2020. The deposits of the first avalanche reached the road, whereas the two other events remained a few meters short.
Observed avalanche activity and characteristics of the deposits
Of the twenty avalanches that occurred in the winter of 2019–2020, thirteen were observed during the day and seven were observed at night. The release type of sixteen out of twenty was interpreted as loose. The remaining four deposits were interpreted as slab avalanches, based on the observation of crown-like shapes in the existing snow cover on the slope. These slab avalanches were observed in photographs from 21 March, 3 April, 7 April, and 27 April.
Nine of the twenty deposits were characterized as presenting a rounded shape, whereas two had a blockier and more angular appearance. Again, due to distance of the cameras and shadows, the surface texture of the remaining nine deposits could not be characterized.
However, based on the photographs, we were able to determine that seventeen out of twenty avalanche deposits occurring that winter did not show any presence of contaminants. The remaining three deposits could not be clearly observed to determine whether they were contaminated by debris or not.
Meteorological conditions preceding avalanche releases
Sixteen of the twenty avalanches occurred shortly following the passing of warm fronts that brought large snowfall episodes combined with rapid increases in air temperature (). For example, in the 72 hours preceding the observation of avalanche deposits on 17 November, a snowfall episode totaling 17 cm (including 6 cm the day of the event) and an increase in daily mean air temperature from −9.5°C to −5°C were signaled. Another example of a similar warm front passing prior to avalanche release was observed on 2 April, when snowfall totaled 29 cm the day of the event and daily mean air temperature had increased rapidly, going from −13°C to −4.5°C between 30 March and 2 April. Similar weather settings were also observed before the observation of avalanche deposits on 13 and 22 November; 1 and 2 December; 7, 10, 21, and 28 January; 28 February; 16 March; and 3, 26, and 27 April.
The other four avalanche deposits that were observed during winter 2019–2020 occurred after decreases in air temperature and more limited snowfall amounts associated with cold fronts. These conditions were also like those observed prior to some avalanche events during the first two years of monitoring. For example, 72 hours before the 5 December event, snowfall totaled only 4 cm and daily mean air temperature decreased from −3.5°C to −13°C over three days. Another example of such conditions occurred before the event of 21 March, when snowfall had also totaled 4 cm since 16 March and daily mean air temperature went progressively from −13.5°C to −24°C. This meteorological condition was also observed before the events of 7 and 16 April.
Spring 2020
General weather conditions
Spring weather conditions in 2020 began on 28 April. Between 28 April and 30 June, mean air temperature was 3.5°C and rainfall totaled 42 mm (). During that season, a total of forty-two avalanches deposits were observed (sixteen by TAS 2, twelve by TAS 3, and fourteen by the new TAS 4). These forty-two events were scattered across eighteen avalanche days, the first one on 1 May 2020 and the last one on 10 June 2020. During that spring, ten cornice failures were also detected, the first on 19 May and the last one on 29 May. Of the ten cornice failures, nine were related to avalanche deposits seen in the corresponding photographs captured by one of the downslope cameras.
Observed avalanche activity and characteristics of the deposits
Of the forty-two deposits that were observed during spring 2020, twenty-eight were observed in photographs taken during the day and fourteen most likely occurred at night. Based on our observations, all of the forty-two events appear to be loose avalanches. The most notable event was observed on 26 May 2020 when a large cornice failure triggered an avalanche on the slope below. It followed the same general path as the events of 17 April 2018 and 17 May 2019, but it had a shorter runout than both previous events ( and ).
Regarding surface texture, twenty-eight out of forty-two (66 percent) of the deposits were classified and only one of them presented an angular and blocky shape. The remaining twenty-seven deposits were characterized as presenting a more spherical surface texture. We also observed that 62 percent of spring avalanche deposits were contaminated with debris and had a dirty appearance. Still, sixteen avalanche deposits from that spring did not show any sign of contamination by visual inspection of the photographs.
Meteorological conditions preceding avalanche releases
Starting on 1 May, daily mean air temperature dropped below 0°C, reaching a minimum of −8.5°C on 4 May right after being above 0°C for three consecutive days at the end of April. Over that period, four avalanche deposits appeared in photographs from 1 May (two events), 2 May, and 3 May 2020.
Very low levels of rainfall were observed throughout spring 2020, according to data from VDTSILA. From 11 to 12 May 2020, a very short rainfall episode totaling 2.0 mm preceded the observation of eight new avalanche deposits over the following three days. The same scenario was noticed before the observation of avalanche deposits on 10 June 2020, because rainfall totaled 2.0 mm in the two days prior to its release. Once again, avalanche and cornice failure observations were mostly made between the values of two and fifty-five cumulative melting degree-days.
Conditional inference tree analysis for observed avalanche deposits
Prior to conducting the conditional inference tree analysis, we removed all October observations from the data set because no avalanche had been documented during that month. This operation reduced the data set from 734 total days to 705 total days. Accordingly, the number of days in winter weather conditions went from 605 days to 576 days.
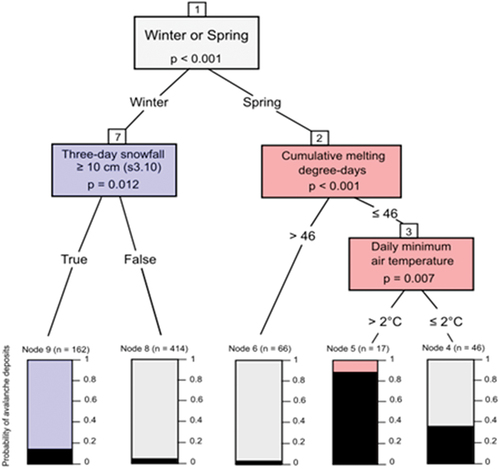
Looking at the root node of the conditional inference tree presented in , we note that the seasonal classification is the most important parameter in tracking avalanche dynamics because there is an immediate split of the data set into two branches depending on whether the observation pertains to the winter avalanche regime or to the spring avalanche regime.
Figure 7. Conditional inference tree for the observation of avalanche deposits (i.e., avalanche occurrence) based on weather regime and weather variables. The blue bar chart represents the combination with the highest prevalence of avalanche deposits in winter conditions. The red bar chart represents the combination with the highest prevalence of deposits in spring conditions.
Spring avalanche regime
Going down the tree, we find the second decision node on the spring branch where the decision is based on whether the cumulative melting degree-day value is less than or equal to forty-six or greater than forty-six. If the cumulative melting degree-days value is greater than forty-six, the tree leads to terminal node 6, where the probability of observing an avalanche is only 4.5 percent. This low percentage is likely because beyond the value of forty-six melting degree-days, a lot of snow had melted in the valley area, as seen in pictures from May 2019 (). However, when the cumulative melting degree-days value is lower than forty-six, the tree leads to a third decision node where the decision is based on whether the daily minimum air temperature is less than or equal to 2°C or greater than 2°C. If daily minimum air temperature is below 2°C, we follow the path to terminal node 4, where the probability of observing avalanche deposits is 39 percent based on forty-six observations. If daily minimum air temperature is greater than 2°C, the tree leads to terminal node 5, which groups the days of the spring regime that showed a cumulative melting degree-day value less than or equal to forty-six combined with a daily minimum temperature greater than 2°C. Within the seventeen days showing a cumulative melting degree-day value less than or equal to 46 and a daily minimum air temperature greater than 2°C, the probability of observing avalanche deposits was 88 percent. This scenario occurs right at the beginning of spring conditions when daily mean air temperatures are above 0°C, but not by much, which gradually enables the accumulation of melting degree-days. The beginning of spring was identified as a critical period of the year for avalanche releases during analysis of the photographs of every snow season.
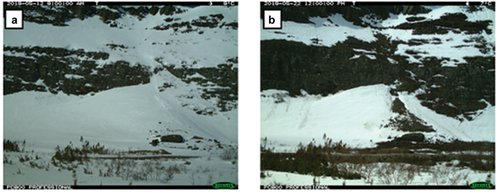
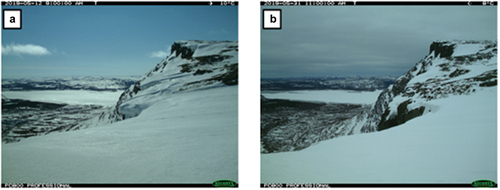
Figure 8. Pictures taken by the TAS 2 camera (a) on 12 May 2019 at four cumulative melting degree-days and (b) on 22 May 2019 at forty-seven cumulative melting degree-days.
In summary, the conditional inference tree analysis suggests that in spring conditions the most suitable weather combination for the observation of avalanche deposits (i.e., avalanche releases) is on days when daily minimum air temperature is greater than 2°C prior to reaching the value of forty-six cumulative melting degree-days.
Winter avalanche regime
The winter side of the CIT contains nodes 7, 8, and 9. At node 7, we find a decision based on whether 3-day snowfall has equaled at least 10 cm. The answer “False” leads to terminal node 8, which includes a subset of 414 days during this study. For the observations of that node, the probability of observing avalanche deposits (i.e., the probability of avalanche occurrence) was very low at 5 percent. The answer “True,” on the other hand, leads to terminal node 9, which consists of a subset of 162 days. When 3-day snowfall equaled at least 10 cm, the probability of an avalanche climbed to 13 percent. Because the ratio of event–nonevent contained in our data set is less than 13 percent (11 percent), it can be interpreted as the signal that 3-day snowfall totaling at least 10 cm has a significant impact on the probability of observing avalanches during winter conditions in the monitored avalanche paths of Tasiapik Valley.
Cornice failures as one of the main avalanche triggers in Tasiapik Valley
As observed throughout this study and the study by Veilleux, Decaulne, and Bhiry (Citation2021), one of the main avalanche challenges in Tasiapik Valley is the cornice–avalanche dynamic, because the morphology of the plateau leading to the edge of the SW slope is particularly suitable for cornice formation. They usually form under moderate wind conditions as long as the erosion rate does not surpass the deposition rate (Yu et al. Citation2023). Cornices represent serious risks of avalanches, and their stability is well known to be particularly sensitive to changing weather conditions such as increases in air temperature, heating by solar radiation, rainfall in spring, and rapid snow loading in winter (McCarty, Brown, and Montagne Citation1986; Conway and Raymond Citation1993; Conway and Wilbour Citation1999; Conway Citation2004; Burrows and McClung Citation2006; McClung and Schaerer Citation2006; Wahl, Planchon, and David Citation2009; Vogel, Eckerstorfer, and Christiansen Citation2012; van Herwijnen and Fierz Citation2014; Munroe Citation2018).
During our study, sixty-one cornice failures were observed: twenty-five in 2017–2018 (eight in winter and seventeen in spring), fifteen in 2018–2019 (eight in winter and seven in spring), and twenty-one in 2019–2020 (eleven in winter and ten in spring). Cornice failures were observed on forty-six different days during this study.
From the total of sixty-one cornice failures, thirty-seven (61 percent) were related to avalanche deposits scattered over twenty-nine different days. This means that 63 percent of the days on which cornice failures occurred coincide with observations of avalanche deposits in photographs. Moreover, as reported earlier, cornice failures were the source of the three longest runout avalanche events observed during the study period that nearly reached the road. Such events highlight the potential risks for valley users who are known to shortcut closer to the slope with their snowmobiles over the snow season instead of following the road path (Laine Chanteloup and Fabienne Joliet, personal communication, summer 2021). Cornice failures were sometimes difficult to detect from the field of view of the TAS 3 and TAS 4 cameras. Combined with harsh weather conditions that sometimes deprived us of quality information due to unusable photographs, some cornice failures and avalanche events may not have been detected throughout the study period.
Using the observations of cornice failures over the three years of monitoring, we were able to run a conditional inference tree analysis to explore the possible relationships between weather conditions and cornice failures.
Conditional inference tree for cornice failures
Like the avalanche conditional inference tree, the first decision node of the CIT for cornice failures () concerns whether the event takes place in spring conditions or in winter conditions (p < .001). Following the spring branch of the tree, the variable for cumulative melting degree-days is again identified as the second most important variable for spring cornice failures (p = .043). If the cumulative melting degree-days value is greater than fifty-two, the tree leads to terminal node 6, where the predicted probability of observing a cornice failure is 0 percent. As observed during the analysis of the photographs, the snow cornice does not seem to overhang the slope much beyond the fifty-two cumulative melting degree-days mark (). However, when the cumulative melting degree-days value is still less than fifty-two, the tree leads to inner node 3, where we now find a decision based upon daily maximum air temperature (p = .02). On days when daily maximum air temperature is less than or equal to 2.5°C, the probability of a cornice failure remains very low at 3 percent, but when daily maximum air temperature is greater than 2.5°C (terminal node 5), the probability for cornice failure climbs to 44 percent.
Figure 9. Conditional inference tree for the observation of cornice failure based on avalanche regime and weather regime and weather variable. The blue bar chart represents the combination with the highest prevalence of cornice failures in winter conditions. The red bar chart represents the combination with the highest prevalence of cornice failures in spring conditions.
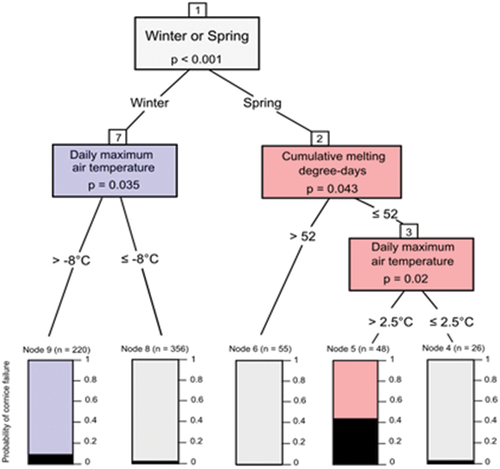
Figure 10. (a) The snow cornice is seen overhanging the slope on 12 May 2019 at four cumulative melting degree-days. (b) The snow cornice does not overhang the slope on 31 May 2019 at fifty-seven cumulative melting degree-days.
On the winter branch of the cornice failure tree, the decision is solely based on daily maximum air temperature (p = .035). On days when the daily maximum air temperature was below −8°C, which was the case for 61 percent of the winter days contained in our data set, the predicted probability of observing a cornice failure was only 2 percent. However, on days when the daily maximum air temperature was greater than −8°C, the probability of observing a cornice failure grew to 7.3 percent, which is greater than the proportion of days when cornice failures were observed on the number of days contained in the data set (6.5 percent). Based on this finding, the predicted probability of 7.3 percent is interpreted as a signal that winter days that show a daily maximum air temperature warmer than −8°C have an impact on the studied snow cornices.
Overall, these findings are in general agreement with those identified by other published studies where warmer temperatures are a contributing factor to cornice failures (McCarty, Brown, and Montagne Citation1986; Conway and Raymond Citation1993; Conway and Wilbour Citation1999; Conway Citation2004; Burrows and McClung Citation2006; McClung and Schaerer Citation2006; Vogel, Eckerstorfer, and Christiansen Citation2012; Munroe Citation2018). The continuous monitoring over the upcoming years will help us gather more data and thus will help clarify the weather patterns prone to cornice failures in the area. As observed over the first three years, cornice collapses are an important component of avalanche dynamics in the area and were responsible for the events with the longer runouts, exhibiting the potential dangers associated with them.
Discussion
Comparison with another eastern Canadian context: the Chic-Chocs
Throughout this study, we have documented the recent avalanche dynamic in Tasiapik Valley, Nunavik. Furthermore, conditional inference tree analyses helped us identify important meteorological variables for avalanche and cornice collapses in addition to pinpointing practical threshold values favoring their occurrence. However, efforts must be pursued in upcoming years to better understand existing patterns between weather and avalanches in Nunavik. As we highlighted, there are risks associated with avalanches in the area, and they must be further assessed to avoid upcoming tragedies such as the avalanche of January 1999 in Kangiqsualujjuaq, northern Québec (Bérubé Citation2000; Germain Citation2016; Decaulne et al. Citation2021). In this section, we compare the results of the present study conducted in Nunavik where almost no published data on the subject exist with avalanche studies conducted in the Chic-Chocs Mountains in southern Québec to determine whether there are similarities in the identified weather conditions that trigger avalanches in both contexts. We chose to compare the two regions because of their proximity and because they present similar biophysical and geographical characteristics.
The Chic-Chocs Mountain range lies in the southeastern part of the province of Québec (northern Gaspésie, eastern Canada), approximately 1,080 km southeast of Umiujaq, and is the region where most of the avalanche research has been carried out in the province of Québec. According to Hétu and Bergeron (Citation2004), the great yearly snowfall amounts that Gaspésie receives explain why it is one of the main regions susceptible to avalanches in Québec. The mountains in the Chic-Chocs Range are generally higher than those in Nunavik, with over twenty-five summits peaking at more than 1,000 m.a.s.l in Gaspésie. Nonetheless, the mountains found in the Chic-Chocs are often characterized as very eroded with flat tops and very steep slopes, similar to the slopes found in Nunavik.
On the inner valley slope studied in Tasiapik Valley, we found that the variable expressing whether three-day snowfall exceeded 10 cm was the most important variable related to the probability of avalanches occurring in winter conditions. In the Chic-Chocs, the relationships between winter avalanche releases, total snowfall, and, most important, snowstorms exceeding 10 cm/day have also been found by Dubé, Filion, and Hétu (Citation2004) and Hétu (Citation2007). Moreover, using classification trees, Gratton, Germain, and Boucher (Citation2019) found that snowfall exceeding 10 cm over a seven-day span favored avalanche releases. In both contexts, snowfall exceeding 10 cm seems to be a recurring value found to affect the probability for avalanche releases. In their study, Gauthier, Germain, and Hétu (Citation2017) produced similar results to what we found in Nunavik using logistic regression models. Their study showed that on inner valley slopes, avalanche releases were better predicted using variables representing three-day snowfall (they used water equivalent), daily rainfall, and the preceding two days of thermal amplitude (Gauthier, Germain, and Hétu Citation2017). Although the variable we have found to be the most important for winter avalanche releases in Nunavik was a composite variable expressing whether snowfall had exceeded 10 cm over three days, it is interesting to note that the same number of days of snowfall was raised through statistical analyses in both contexts and that snowfall exceeding 10 cm over different time frames is a recurring factor.
For spring avalanches, on the northeast-facing slope that we studied in Tasiapik Valley, we found cumulative melting degree-days and daily minimum air temperature greater than 2°C to be the weather variables that most affected the probability of spring avalanche release, and similar weather conditions have been defined as conducive for cornice failures. We also observed in photographs taken by automatic time-lapse cameras and in situ field campaigns that the snow cover remains longer on the steep northeast-facing slope than on the gently dipping southwest-facing slope and on the valley floor. In the Chic-Chocs, spring avalanche releases have been frequently associated with snowmelt, rainfall, and ice block falls from overlooking rock walls (Hétu Citation2007; Germain, Filion, and Hétu Citation2009; Gauthier, Hétu, and Bergeron Citation2012; Graveline and Germain Citation2016). Furthermore, Hétu (Citation2007) stated that such conditions had a greater impact on north-facing slopes in the region because they protect the snow cover from direct afternoon sunlight, resulting in a snow cover that persists later into the season. Gratton, Germain, and Boucher (Citation2019) are the only ones who have found a relationship with heating (i.e., melting) degree-days specifically for avalanche releases in the Chic-Chocs using classification trees. However, they associated heating degree-days with avalanches occurring in October, November, and December. Gauthier, Hétu, and Bergeron (Citation2012) and Graveline and Germain (Citation2016) found that melting degree-days favor ice block falls from rock walls and ice block falls are known to trigger avalanches on the slopes below. They did not say that increasing melting degree-days was directly related to avalanches. Overall, the studies in the Chic-Chocs range generally agree that warmer temperatures are conducive to avalanches in winter as well as in spring, without indicating precise temperatures or warming values. In our study in Nunavik, we also concluded that warmer temperatures in spring are conducive to avalanches while defining threshold values that indicate in when avalanches are most likely to occur.
Although it was not identified by our conditional inference trees, we should note that rainfall episodes were often observed prior to many avalanche events in spring in Tasiapik Valley. The low number of observations contained in our data set may have prevented us from identifying more variables affecting the probability of observing avalanches. From a research perspective, we think that comparing snow avalanche calendars from Tasiapik and from some of the Chic-Chocs slopes may highlight regional synoptic conditions between the two Quebec areas and whether the same weather conditions affecting both areas with a time delay are responsible for avalanche release.
Limitations
The three years of slope monitoring in Tasiapik Valley have given us a database totaling 130 avalanche deposit observations scattered over seventy-eight distinct avalanche days (forty-two in winter, thirty-six in spring). They have also allowed us to detect forty-six days of cornice failures. This remote sensing method, although not particularly expensive, enables continuous data collection at regular time intervals and provides a safe observer position that does not alter the physical properties of the study site (Eckerstorfer et al. Citation2016). However, it also comes with nonnegligible limitations. These limitations concern the spatially limited character of the observations contained in the resulting data set as well as issues with visibility due to harsh weather conditions and poor lighting. In addition, the cameras and the weather station used in the study are not at the same altitude, which may lead to some divergence in the findings. For instance, the VDTSILA weather station is situated at an altitude of 126 m.a.s.l. in the valley and is protected from winds by the high SW slope, whereas the TAS 1 camera is located at 300 m.a.s.l. and is completely exposed to strong westerly winds, as we experienced on the field during summer 2021.
Effectively, the use of automatic time-lapse cameras also means that the database is spatially limited to the avalanche tracks we choose to monitor. As mentioned by Veilleux, Decaulne, and Bhiry (Citation2021), the conditions may be locally favorable for avalanche releases. For instance, during the first year of monitoring, many events were observed using TAS 2 (thirty-six), whereas TAS 3 only detected three events. To acquire additional observations, the camera was moved upstream to an area that was believed to be more favorable to avalanches. However, the previous pattern was again observed in 2018–2019, because the TAS 2 camera recorded 76 percent of the avalanche deposits that year. In 2019–2020, even though a fourth camera was added to the monitoring system, the same pattern emerged: TAS 2 recorded 48 percent of the avalanche deposits, whereas TAS 3 and TAS 4 recorded 26 percent each. This further highlights the fact that conditions may be locally more favorable to avalanche release, making it difficult to extrapolate the results obtained via time-lapse cameras for the rest of the valley. Moreover, the fact that a camera was added and that another was moved during the study period means that the data set is not stable through time. This also restricts the kinds of analyses that may be performed with the data set and diminishes its predictive power.
The authors would also like to reiterate that many of the photographs taken by the cameras could not be used to gather any useful information on the avalanche dynamic due to poor visibility conditions. We think this issue affected the study the most during the first snow season of the study, which is when the VDTSILA weather station data showed the most total snowfall (~629 cm). Accordingly, during a fieldwork campaign in summer 2019, Veilleux, Decaulne, and Bhiry (Citation2021) were told through informal discussions with locals that the snow season 2017–2018 was particularly long and harsh. Such conditions could most certainly have triggered more avalanches than usual. However, the severe winter conditions also contributed to a very high number of unusable pictures due to fog, frost, blowing snow, and/or snow accumulation on the camera lenses, as observed during photo interpretation from winter season 2017–2018. With regards to total snowfall, the great number of unusable photographs may be a reason for the similar number of avalanches observed in winter 2017–2018 than in the two subsequent winters.
Conclusion
In this study, we documented the occurrence and deposit characteristics of avalanches occurring along the southwestern slope of the Tasiapik Valley using four automatic time-lapse cameras. We also examined the meteorological conditions favorable to avalanche releases in winter and in spring from 2017 to 2020 using conditional inference trees. The results of this study showed that synoptic weather phenomena such as warm and cold fronts bringing snowfall and changes in temperatures over relatively short periods of time were conducive to avalanche release in winter, whereas the heating of the snowpack and valley area was conducive to spring avalanche release. The first type generally exhibited longer runouts, indicative of their potential to reach the road, whereas the latter often contained visible rocky debris within their deposits, indicative of the erosive power of spring avalanches over the rock wall and talus slopes.
Conditional inference tree analysis confirmed that winter avalanches and spring avalanches are favored by different weather conditions. In winter, three-day snowfall episodes equaling at least 10 cm increased the probability of avalanche occurrence, whereas in spring the probability of avalanche occurrence was enhanced when cumulative melting degree-days was less than forty-six on days when minimum air temperature was above 2°C. Cornice failures were also found to be promoted by different weather conditions in winter conditions versus in spring conditions. In winter, the probability of observing a cornice collapse has been shown to be greater on days when mean air temperature is greater then −8°C. In spring, cornice failures are more likely to occur when cumulative melting degree-days is less than fifty-two on days when maximum air temperature is above 2.5°C.
This study of weather conditions favoring avalanche releases over the monitored paths of Tasiapik Valley represents a first step toward avalanche forecasting based on weather data in Nunavik. Time-lapse monitoring will continue over the years to come. Weather data and photographs are now being registered by two weather stations and five time-lapse cameras from the snow season 2020–2021 and onwards. The data are currently being processed to enlarge our observation data set and add another layer to avalanche hazard knowledge in northern Québec.
Acknowledgments
We gratefully acknowledge the Centre d’études Nordiques (CEN), a strategic cluster funded by the Fonds québécois de recherche Nature et Technologie, for access to its research infrastructure for professional and logistical support. Special thanks are extended to the community of Umiujaq for their generosity and for agreeing to host our research. The authors also thank Samuel Veilleux, Denis Sarrazin, Carl Barrette, Félix Faucher, Julien Lebrun, and Þorsteinn Saemundsson for their valuable assistance in the field. Finally, we thank one anonymous reviewer as well as Dr. Pascal Haegeli for their valuable and constructive feedback on previous versions of the article.
Disclosure statement
No potential conflict of interest was reported by the authors.
Additional information
Funding
References
- Administration Régionale Kativik (ARK). 2007. Projet de parc national des Lacs-Guillaume-Delisle-et-à-l’Eau-Claire. État des connaissances. Kuujjuaq, Québec: Administration régionale Kativik, Service des ressources renouvelables, de l’environnement, de territoire et des parcs, Section des parcs.
- Allard, M., F. Calmels, D. Fortier, C. Laurent, E. L’Hérault, and F. Vinet. 2007. Cartographie des conditions de pergélisol dans les communautés du Nunavik en vue de l’adaptation au réchauffement climatique. Québec: Gouvernement du Québec. 49.
- Allard, M., and M. Lemay. 2012. Nunavik and Nunatsiavut: From science to policy. An Integrated Regional Impact Study (IRIS) of climate change and modernization, 303. Québec: ArcticNet Inc.
- Antomarchi, V., F. Joliet, and L. Chanteloup. 2020. Les parcs nationaux du Nunavik: Une offre touristique au service des sociétés autochtones ?” Espace populations sociétés. [Online], 2020/3-2021/1 | 2021, Online since 21 January 2021, connection on 11 November 2022. http://journals.openedition.org/eps/10760.
- Bérubé, J. 2000. Rapport d’enquête publique suite à l’avalanche de 1999 à Kangiqsualujjuaq. Québec: Rapport du bureau du coroner. 66.
- Burrows, R. A., and D. M. McClung. 2006. Snow cornice development and failure monitoring. Paper presented at the International Snow Science Workshop in Telluride, Colorado.
- Busseau, B.-C., A. Royer, A. Roy, A. Langlois, and F. Domine. 2017. Analysis of snow-vegetation interactions in the low Arctic-Subarctic transition zone (northeastern Canada). Physical Geography 38 (2):159–22. doi:10.1080/02723646.2017.1283477.
- Campbell, C., L. Bakermans, B. Jamieson, and C. Stetham. 2007. Current and future snow avalanche threats and mitigation measures in Canada. Report prepared for Public Safety Canada, Canadian Avalanche Centre, 103.
- Center d’études nordiques. 2020. Climate station data from the Umiujaq region in Nunavik, Quebec, Canada, v. 1.7 (1997–2019). Nordicana D9. http://www.cen.ulaval.ca/nordicanad/dpage.aspx?doi=45120SL-067305A53E914AF0.
- Charron, I. 2015. Élaboration du portrait climatique régional du Nunavik. Montréal: Ouranos.
- Conway, H. 2004. Storm Lewis: A rain-on-snow event on the Milford Road, New Zealand. Proceedings of the International Snow Science Workshop 2004, Jackson Hole, 557–64
- Conway, H., and C. F. Raymond. 1993. Snow stability during rain. Journal of Glaciology 39 (133):635–42. doi:10.1017/S0022143000016531.
- Conway, H., and C. Wilbour. 1999. Evolution of snow slope stability during storms. Cold Regions Science and Technology 30:67–77. doi:10.1016/S0165-232X(99)00009-9.
- Decaulne, A., N. Bhiry, J. Faucher-Roy, and C. Pelletier-Boily. 2021. The development of Kangiqsualujjuaq and the threat of snow avalanches in a permafrost degradation context, Nunavik, Canada. Espace populations sociétés. [En ligne], 2020/3-2021/1 | 2021, mis en ligne le 21 janvier 2021, consulté le 18 mars 2021. http://journals.openedition.org/eps/10497.
- Dionne, J. C. 1976. Les grandes cuestas de la mer d’Hudson. GÉOS (Energie, Mines et Ressources Canada) 5 (1):18–20.
- Dreier, L., S. Harvey, A. van Herwijnen, and C. Mitterer. 2016. Relating meteorological parameters to glide-snow avalanche activity. Cold Regions Science and Technology 128:57–68. doi:10.1016/j.coldregions.2016.05.003.
- Dubé, S., F. Filion, and B. Hétu. 2004. Tree-ring reconstruction of high-magnitude snow avalanches in the Northern Gaspé Peninsula, Québec, Canada. Arctic, Antarctic, and Alpine Research 36 (4):555–64. doi:10.1657/1523-0430(2004)036[0555:TROHSA]2.0.CO;2.
- Duhaime, G. 2007. Profil socioéconomique du Nunavik. Chaire de recherche du Canada sur la condition autochtone comparée. Québec: Université Laval. 90.
- Eckerstorfer, M., Y. Bühler, R. Frauenfelder, and E. Malnes. 2016. Remote sensing of snow avalanches: Recent advances, potential, and limitations. Cold Regions Science and Technology 121:126–40. doi:10.1016/j.coldregions.2015.11.001.
- Fortin, G., B. Hétu, and D. Germain. 2011. Climat hivernal et régimes avalancheux dans les corridors routiers de la Gaspésie septentrionale (Québec, Canada). Climatologie 8:9–25. doi:10.4267/climatologie.202.
- Gauthier, F., D. Germain, and B. Hétu. 2017. Logistic model as a forecasting tool for snow avalanches in a cold maritime climate: Northern Gaspésie, Québec, Canada. Natural Hazards 89 (1):201–32. doi:10.1007/s11069-017-2959-3.
- Gauthier, F., B. Hétu, and N. Bergeron. 2012. Analyses statistiques des conditions climatiques propices aux chutes de blocs de glace dans les corridors routiers du nord de la Gaspésie, Québec, Canada. Canadian Geotechnical Journal 49 (12):1408–26. doi:10.1139/cgj-2011-0394.
- Germain, D. 2016. Snow avalanche hazard assessment and risk management in northern Quebec, eastern Canada. Natural Hazards 80 (2):1303–21. doi:10.1007/s11069-015-2024-z.
- Germain, D., L. Filion, and B. Hétu. 2009. Snow avalanche regime and climatic conditions in the Chic-Chocs Range, eastern Canada. Climate Change 92:141–67. doi:10.1007/s10584-008-9439-4.
- Germain, D., and L. Stabile-Caillé. 2023. Environmental drivers of paraglacial time duration and intensity for scree slopes dynamics in forested environments. Earth Surface Processes and Landforms 1–16. doi:10.1002/esp.5538.
- Gratton, M., D. Germain, and É. Boucher. 2019. Meteorological triggering scenarios of tree-ring-based snow avalanche occurrence on scree slopes in a maritime climate, Eastern Canada. Physical Geography 41 (1):3–20. doi:10.1080/02723646.2019.
- Graveline, M.-H., and D. Germain. 2016. Ice-block fall and snow avalanche hazards in northern Gaspésie (eastern Canada): Triggering weather scenarios and process interactions. Cold Regions Science and Technology 123:81–90. doi:10.1016/j.coldregions.2015.11.012.
- Hétu, B. 2007. Les conditions météorologiques propices au déclenchement des avalanches de neige dans les corridors routiers du nord de la Gaspésie, Québec, Canada. Géographie physique et Quaternaire 61 (2–3):18–53. doi:10.7202/038990ar.
- Hétu, B., and A. Bergeron. 2004. Les avalanches au Québec: Analyse des conditions météorologiques et des facteurs de terrain propices au déclenchement des avalanches. Programme conjoint de sécurité-avalanche au Québec, Secrétariat général de Recherche et Sauvetage Canada, 84.
- Hétu, B., K. Brown, and D. Germain. 2008. L’inventaire des avalanches mortelles au Québec depuis 1825 et ses enseignements. Proceedings of the 4th Canadian Conference on Geohazards, Université Laval, Québec, 20–24.
- Hétu, B., K. Brown, and D. Germain. 2011. Les victimes d’avalanche au Québec entre 1825 et 2009. The Canadian Geographer/Le Géographe canadien 55 (3):273–87. doi:10.1111/j.1541-0064.2010.00338.x.
- Horton, S., M. Towell, and P. Haegeli. 2020. Examining the operational use of avalanche problems with decision trees and model-generated weather and snowpack variables. Natural Hazards and Earth System Sciences 20:3551–76. doi:10.5194/nhess-20-3551-2020.
- Hothorn, T., K. Hornik, and A. Zeileis. 2006. Unbiased recursive partitioning: A conditional inference framework. Journal of Computational and Graphical Statistics 15:651–74. doi:10.1198/106186006X133933.
- Hothorn, T., and A. Zeileis. 2015. partykit: A modular toolkit for recursive partytioning in R. The Journal of Machine Learning Research 16 (1):3905–9.
- Kern, H., N. Eckert, V. Jomelli, D. Grancher, M. Deschatres, and G. Arnaud-Fassetta. 2021. Brief communication: Weak control of snow avalanche deposit volumes by avalanche path morphology. The Cryosphere 15:4845–52. doi:10.5194/tc-15-4845-2021.
- Landry, B., J. Beaulieu, M. Gauthier, M. Lucotte, M. Moingt, S. Ochietti, D. L. Pinti, and M. Quirion. 2013. Notions de géologie. 4th edition. Montreal: Modulo. 656.
- Lemay, M.-A., L. Provencher-Nolet, M. Bernier, E. Lévesque, and S. Boudreau. 2018. Spatially explicit modeling and prediction of shrub cover increase near Umiujaq, Nunavik. Ecological Monographs 33 (3):385–407.
- Lemieux, J., R. Fortier, J. Molson, R. Therrien, and M. Ouellet. 2020. Topical collection: Hydrogeology of a cold-region watershed near Umiujaq (Nunavik, Canada). Hydrogeology Journal 28:809–12. doi:10.1007/s10040-020-02131-z.
- L’Hérault, E., A. Boisson, M. Allard, S. Aubé-Michaud, D. Sarrazin, J. Roger, and C. Barrette 2017. Détermination et analyse des vulnérabilités du Nunavik en fonction des composantes environnementales et des processus physiques naturels liés au climat. Rapport final, Réalisé pour le compte du Ministère des Forêts, de la Faune et des Parcs, Gouvernement du Québec. Centre d’études nordiques, Université Laval, 160.
- Lied, K., and U. Domaas. 2000. Avalanche hazard assessment in Nunavik and on Côte-Nord, Québec, Canada. Québec, Canada: Ministère de la sécurité publique de Québec.
- Li, L., and J. Pomeroy. 1997. Estimates of threshold wind speeds for snow transport using meteorological data. American Meteorological Society 36 (3):205–13.
- Loiseau, R. 2021. Étude des avalanches à Umiujaq (Nunavik, Canada): Persistance des dépôts et distances de parcours. Rapport de stage de Master 2.
- Luckman, B. H. 1978. Geomorphic work of snow avalanches in the Canadian Rocky Mountains. Arctic and Alpine Research 10 (2):261–76. doi:10.1080/00040851.1978.12003965.
- McCarty, D., R. L. Brown, and J. Montagne 1986. Cornices: Their growth, properties, and control. 1986 International Snow Science Workshop, Lake Tahoe, CA, USA, 41–45.
- McClung, D. M., and P. A. Schaerer. 2006. The avalanche handbook, 3rd edition. Seattle: The Mountaineers Books, 342.
- Ménard, É., M. Allard, and Y. Michaud 1998. Monitoring of ground surface temperatures in various biophysical micro-environments near Umiujaq, eastern Hudson Bay, Canada. Proceedings of the 7th International Conference on Permafrost, Yellowknife, Canada, 723–9.
- Michaud, Y., and J.-C. Dionne. 1987. Altération des substrats rocheux et rôle du soulèvement gélival dans la formation des champs de blocaille, en Hudsonie. Géographie physique et Quaternaire 41 (1):7–18. doi:10.7202/032661ar.
- Ministère des Ressources naturelles et de la Faune. 2019. Cartes topographiques des villages autochtones du nord à l’échelle de 1/2 000. Québec: Direction générale de l’information géospatiale, Québec. Available from https://www.donneesquebec.ca/recherche/dataset/cartes-topographiques-des-villages-autochtones-du-nord-a-l-echelle-de-1-2-000.
- Ministère de l’Énergie et des Ressources naturelles. 2019. Cartes topographiques des villages autochtones du nord à l’échelle de 1/2 000. Québec: Direction générale de l’information géospatiale, Québec. Available from https://www.donneesquebec.ca/recherche/dataset/cartes-topographiques-des-villages-autochtones-du-nord-a-l-echelle-de-1-2-000
- Ministère de l’Environnement et de la Lutte contre les changements climatiques (MELCC). 2019. Données du Réseau de surveillance du climat du Québec. Québec: Direction générale du suivi de l’état de l’environnement.
- Munroe, J. S. 2018. Monitoring snowbank processes and cornice fall avalanches with time-lapse photography. Cold Regions Science and Technology 154:32–41. doi:10.1016/j.coldregions.2018.06.006.
- Pelletier, M., M. Allard, and E. Levesque. 2018. Ecosystem changes across a gradient of permafrost degradation in subarctic Québec (Tasiapik Valley, Nunavik, Canada). Arctic Science 5 (1):1–26. doi:10.1139/as-2016-0049.
- Provencher-Nolet, L., M. Bernier, and E. Lévesque. 2014. Quantification des changements récents à l’écotone forêt-toundra à partir de l’analyse numérique de photographies aériennes. Écoscience 21 (3–4):419–33. doi:10.2980/21-(3-4)-3715.
- van Herwijnen, A., and C. Fierz. 2014. Monitoring snow cornice development using time-lapse photography. Proceedings of the International Snow Science Workshop. Davos, Switzerland. 865–9.
- Veilleux, S. 2019. Processus gravitaires dans la vallée Tasiapik (Nunavik): Témoins géomorphologiques de la dynamique de versant récente et passée. Québec: Mémoire de maîtrise, Université Laval, 94.
- Veilleux, S., N. Bhiry, and A. Decaulne. 2019. Talus slope characterization in Tasiapik Valley (subarctic Québec): Evidence of past and present slope processes. Geomorphology 349. doi:10.1016/j.geomorph.2019.106911.
- Veilleux, S., A. Decaulne, and N. Bhiry. 2021. Snow-cornice and snow-avalanche monitoring using automatic time-lapse cameras in Tasiapik Valley, Nunavik (Québec) during the winter of 2017–18. Arctic Science 7 (4):798–812. doi:10.1139/as-2020-0013.
- Vogel, S., M. Eckerstorfer, and H. H. Christiansen. 2012. Cornice dynamics and meteorological control at Gruvefjellet, Central Svalbard. The Cryosphere 6 (1):157–71. doi:10.5194/tc-6-157-2012.
- Wahl, L., O. Planchon, and P. M. David. 2009. Characteristics and seasonal evolution of firns and snow cornices in the High Vosges mountains (eastern France). Erdkunde 63 (1):51–67. doi:10.3112/erdkunde.2009.01.04.
- Woods, J. G., M. Labrecque, C. English, and T. Fujimura. 2014. Collecting and preserving the history of snow avalanche activity, research and safety in Canada. Paper presented at International Snow Science Workshop, Banff, Canada.
- Yang, J., Q. He, and Y. Liu. 2022. Winter–spring prediction of snow avalanche susceptibility using optimisation multi-source heterogeneous factors in the Western Tianshan Mountains, China. Remote Sensing 14 (6):1340. doi:10.3390/rs14061340.
- Yu, H., G. Li, B. Walter, M. Lehning, J. Zhang, and N. Huang. 2023. Wind conditions for snow cornice formation in a wind tunnel. The Cryosphere 17:639–51. doi:10.5194/tc-17-639-2023.