
ABSTRACT
On 29 June 2022, local observers reported the drainage of a 0.5 ha lake near Qikiqtaġruk (Kotzebue), Alaska, that prompted this collaborative study on the life cycle of a thermokarst lake in the Arctic. Prior to its drainage, the lake expanded from 0.13 ha in 1951 to 0.54 ha in 2021 at lateral rates that ranged from 0.25 to 0.35 m/year. During the drainage event, we estimate that 18,500 m3 of water drained from the lake into Kotzebue Sound, forming a 125-m-long thermo-erosional gully that incised 2 to 14 m in ice-rich permafrost. Between 29 June and 18 August 2022, the drainage gully expanded from 1 m to >10 m wide, mobilizing ~8,500 m3 of material through erosion and thaw. By reconstructing a pre-lake disturbance terrain model, we show that thaw subsidence occurs rapidly (0.78 m/year) upon transition from tundra to lake but that over a seventy-year period it slows to 0.12 m/year. The combination of multiple remote sensing tools and local environmental observations provided a rich data set that allowed us to assess rates of lake expansion relative to rates of sub-lake permafrost thaw subsidence as well as hypothesizing about the potential role of beavers in arctic lake drainage.
Introduction
The formation and drainage of lakes in the Arctic represent dominant landscape change processes in permafrost regions (Grosse, Jones, and Arp Citation2013; Brosius et al. Citation2021; B. M. Jones et al. Citation2022). Their dynamics during the Holocene and Anthropocene have shaped the current state of lowland arctic landscapes and lake and drained lake basin (L-DLB) systems (Farquharson et al. Citation2016; Bouchard et al. Citation2020; S. Wolfe et al. Citation2020; B. M. Jones et al. Citation2022). Taken together, L-DLB systems may cover up to 80 percent of the landscape in lowland permafrost regions in the Arctic (Hinkel et al. Citation2005; M. C. Jones et al. Citation2012; Grosse, Jones, and Arp Citation2013; B. M. Jones and Arp Citation2015; Bergstedt et al. Citation2021). Several recent studies have documented an increase in lake evolution and, in particular, lake drainage across the permafrost region (Nitze et al. Citation2018, Citation2020; Lara, Chen, and Jones Citation2021; Webb et al. Citation2022) with implications for local-, regional-, and global-scale feedbacks (Turetsky et al. Citation2020; B. M. Jones et al. Citation2022). Better understanding lake drainage processes and documenting lake drainage events is of importance to climate change research, wildlife and habitat studies, access to subsistence resources, and the well-being of northern socioecological systems (B. M. Jones et al. Citation2022).
L-DLB systems in the northwestern Alaska Arctic region are continuing to shift to a landscape that is increasingly dominated by DLBs. B. M. Jones et al. (Citation2011) found that between 1951 and 2007 on the Cape Espenberg Lowlands of the northern Seward Peninsula, the land area gained through lake drainage was nearly 4 times greater than land area lost through lake formation and expansion. Swanson (Citation2019) conducted lake change studies for the U.S. National Park Service lands in the region showing widespread lake losses (mean regional rate loss of 16 ha/year) between 2000 and 2017. Nitze et al. (Citation2020) further documented widespread lake area loss for the northern Seward Peninsula and Baldwin Peninsula in 2017 and 2018, where 192 lakes were identified as draining, which exceeded the long-term average drainage rate by a factor of approximately ten. Lara, Chen, and Jones (Citation2021) assessed lake drainage dynamics across the entirety of the Brooks Range and northwestern Arctic Alaska between 1975 and 2019, showing that 100 to 250 lakes per year had drained between 2015 and 2019 and that by 2050 lake area will likely decline by an additional 15 to 21 percent. The factors responsible for the rapid nature of lake drainage in the region have been attributed to increases in mean annual air temperature and precipitation, lengthening of the thaw season, and increasing near-surface permafrost ground temperature that destabilize ice-rich permafrost soils (Swanson Citation2019; Nitze et al. Citation2020; Lara, Chen, and Jones Citation2021). However, an increase in the presence of beaver engineering in the region has also been well documented through the formation of more than 12,000 new beaver ponds since the early 1950s (Tape et al. Citation2018, Citation2022). The recent and rapid expansion of beavers in the region adds a level of complexity when trying to infer the factors responsible for lake dynamics. For example, B. M. Jones, Tape, et al. (Citation2020) found that beavers were the primary driver of surface water area increases on the Baldwin Peninsula between 2002 and 2019 but their engineering activities had caused the drainage of some thermokarst lakes. Our recent observations, both with remote sensing and during field studies, in part prompted this study to investigate the complex processes triggering lake drainage.
On 29 June 2022, between 08:00 and 20:00, a 0.5 ha thermokarst lake, with bank heights that ranged from 2 to 4 m high, drained on the Schaeffer’s Native allotment on the Baldwin Peninsula, near Qikiqtaġruk (Kotzebue), Alaska (). The event was reported on the Local Environmental Observer (LEO) Network by Susan and Tim Tessier, who have their home on the allotment near the lake (Tessier et al. Citation2022). Over the course of the next few months, a cross-disciplinary group of scientists and local knowledge experts from a variety of countries and institutions explored the lake basin using aerial and satellite imagery as well as on-site surveys and discussions with local observers. The presence of a beaver in the lake just days before the drainage event and beaver-chewed shrubs on the shore indicate that it may have played a role in the lake drainage event. To better understand the factors leading up to this lake drainage event, we investigated various forms of imagery to reconstruct lake water volume and topographic change and estimate permafrost thaw subsidence over time. More specifically, we used historical aerial photography and contemporary very high-resolution airborne and satellite imagery to reconstruct lake evolution prior to drainage as well as corroborating the timing of the lake drainage event. Structure-from-motion (SfM) techniques were used to process digital photography acquired from a plane mounted camera (2016 and 2021) and a drone system camera (2022) to provide an estimate of lake water volume loss and topographic change associated with the lake drainage. Simulating a pre-lake formation terrain surface allowed for the estimate of permafrost thaw subsidence associated with thermokarst lake evolution prior to its drainage in 2022.
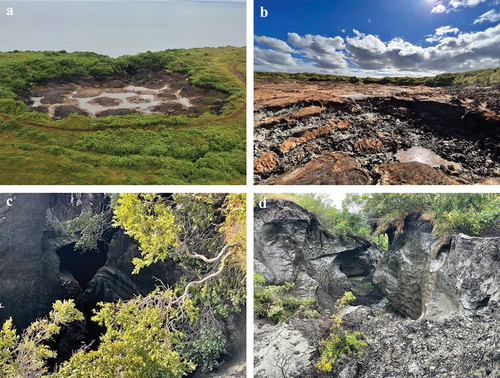
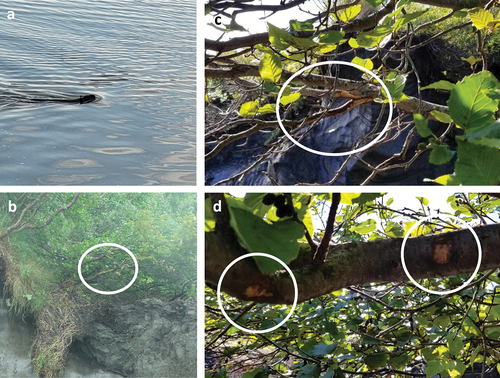
Figure 1. Photos from the LEO post on the sudden lake drainage event that happened on 29 June 2022 (Tessier et al. Citation2022). (a) Oblique aerial photo of the drained lake basin on 10 August 2022 (photo credit: Sebastian Zavoico). (b) Ground photo of the recently exposed drained lake basin floor and (c) the thermo-erosional drainage gully that formed during the drainage event (photo credits: Susan Tessier, 29 June 2022). (d) The thermo-erosional drainage gully fifty-four days after the lake drained showing continued permafrost thaw and ground ice melt since the drainage event (photo credit: Benjamin Jones).
Methods
Local environmental observations
The observation of the sudden lake drainage event was provided through the Alaska Native Tribal Health Consortium’s LEO Network. The LEO Network is a community of local and topic experts who share knowledge about the time and location of specific events that are signals of environmental change. In 2012, the LEO Network was launched as an online tool to help the tribal health system and local observers to share information about climate and other drivers of environmental change. The event was reported on the LEO Network by Tim and Susan Tessier, who have their home on a Native allotment near the lake, which is located about 5 km northeast of Kotzebue, Alaska (; Tessier et al. Citation2022). Several researchers were then approached by the LEO Network to verify and comment on this reported event, which led to the scientific analysis reported here in close collaboration between local observers and researchers.
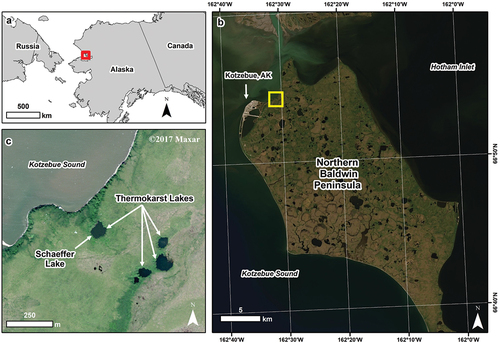
Figure 2. The northwestern Arctic region of Alaska where the thermokarst lake drained on 29 June 2022. (a) An inset map showing the location of the northern part of the Baldwin Peninsula (red box). (b) A Landsat satellite image showing the northern Baldwin Peninsula and the location of the drained thermokarst lake (yellow box). (c) A Worldview-2 satellite image from 20 July 2017 showing a series of small thermokarst lakes that have formed in ice-rich permafrost. Schaeffer Lake is the lake that drained on 29 June 2022. ©2023 Maxar.
Reconstructing lake area changes over time
We reconstructed the environmental history and drainage of Schaeffer Lake by analyzing several remote sensing datasets in a geographic information system (Jones Citation2023). Historical aerial photography from 14 July 1951 (1:20,000 scale), 6 July 1974 (1:6,000 scale), and 31 August 1993 (1:48,000 scale) provided a historical data set to map changes in the lake area over time due to lake expansion into ice-rich permafrost. The historical aerial photograph time series was complemented by very high-resolution satellite imagery from 4 July 2007 (Quickbird-2) and 4 August 2021 (Worldview-2) to map lake area in the two decades prior to its drainage (). The Worldview-2 image from 2021 was used as the base image to georegister the other four images in the time series. The georegistration error was less than 1.0 m based on using ten ground control points in each image (). Visual analysis of very high-resolution satellite images from 24 June 2022 (Worldview-3), 30 June 2022 (Worldview-2), and 1 August 2022 (Worldview-2) bracketed the drainage event in 2022 and demonstrated its complete drainage ().
Figure 3. Very high-resolution satellite image time series bracketing the drainage of Schaeffer Lake to the time period observed by local environmental observers. The lake drained between 24 June 2022 (note smoke is present) and 30 June 2022 as observed in the 0.5 m resolution satellite images. The observation from 4 August 2021 was the last non-smoke and snow/ice-affected image available for the site prior to the lake drainage. The image acquired on 1 August 2022 demonstrates that the lake drainage was complete. ©2023 Maxar.
Table 1. Historic aerial photograph and contemporary satellite imagery used in our analysis of Schaeffer Lake evolution between 1951 and 2021.
Quantifying thermokarst lake margin expansion rates
Lake expansion rates between each time period (1951 versus 1974, 1974 versus 1993, 1993 versus 2007, and 2007 versus 2021) were measured using Digital Shoreline Analysis System (DSAS) Version 5.1 (Himmelstoss et al. Citation2021) extension installed in ArcGIS Desktop 10.8.1 (ESRI Citation2022). This method had previously been used to successfully quantify thermokarst lake expansion rates (B. M. Jones et al. Citation2011). Transects were cast 3 m apart using the baseline polyline drawn on the outside of the 2021 shoreline for a total of 110 transects. Transects were initially cast using automated features in DSAS and edited to ensure that all transects crossed each lake shoreline in a perpendicular direction. The same transects were used for each DSAS run for each time period. The net expansion (m) and mean expansion rate (m/year) were calculated for each time period using the 110 perpendicular transect lines.
Developing high-resolution digital surface and terrain models
Predrainage digital images were acquired on 1 September 2016 from a small single-engine airplane with a Nikon D800E DSLR camera with a 24 mm lens mounted vertically and connected to a Trimble 5700 survey-grade Global Positioning System (Fairbanks Fodar Citation2019). Photo exposure was continuously monitored and adjusted in flight as needed by the pilot. The bulk of the missions were planned with a 17-cm ground sample distance using a two-pass method along the coast. The coast was followed by eye and then subsequent lines offset the appropriate distance to get a 60 percent across-track overlap. Along-track overlap was generally 80 percent or more. The photos were processed using the software Agisoft Photoscan (Nolan, Larsen, and Sturm Citation2015) to create an orthophoto mosaic, a digital surface model (DSM), and a point cloud with twelve points per square meter using North American Datum (NAD)83 UTM Zone 3 North in orthometric heights (North American Vertical Datum of 1988 (NAVD)88).
Predrainage MACS (Modular Aerial Camera System) aerial images with red–green–blue and near-infrared sensors were acquired on 3 July 2021 during the Perma-X 2021 flight campaign. Images were captured on a single flight line with an 80 percent along-track overlap and a flight altitude of 1,000 m, which translates to an approximate ground resolution of 10 cm. We processed these data to an orthophoto mosaic, DSM, and colorized point cloud in Pix4D Mapper (v4.7.5; PIX4D Citation2022). The single-track acquisition pattern of the MACS data required the manual selection of ground control points using the postdrainage drone system orthophoto mosaic and DSM to ensure spatial accuracy across data sets.
Postdrainage digital images were acquired from a DJI P4RTK quadcopter with a DJI D-RTK 2 Mobile Base Station at the Schaeffer Lake drainage study site on 22 August 2022. The drone system was flown at 50 m above ground level, and flight speeds varied from 7 to 8 m/s. The along-track overlap and across-track overlap of the mission were set at 80 percent and 70 percent, respectively. All images were processed in the software Pix4D Mapper (v4.7.5) to produce an orthophoto mosaic and a DSM at spatial resolutions of 2 and 5 cm, respectively and a point cloud with ~400 points per square meter. A Leica Viva differential Global Positioning System provided ground control for the mission, and the data were postprocessed to WGS84 UTM Zone 3 North in ellipsoid heights.
We developed predrainage (1 September 2016 and 3 July 2021) and postdrainage (22 August 2022) digital terrain models (DTMs) using the AGL Analyst function in the software Quick Terrain Modeler (QTM v8.31; QTM Citation2022). We reprocessed all point cloud data sets to a spatial resolution of 30 cm by calculating a bare earth DTM using the LidarSense algorithm in QTM. The 2016 and 2021 data sets were reprojected to WGS84 UTM Zone 3 North in ellipsoid heights to match the reference frame of the 2022 data prior to differencing the DTM products to estimate the volume of water lost through lake drainage as well as thermal erosion caused by the lake drainage event. Prior to differencing the DTMs, Schaeffer Lake was hydro-flattened to an ellipsoid height of 31 m in QTM.
Simulating a predisturbance land surface
We simulated a pre-lake formation land surface by extracting topographic information from a 0.5 ha area adjacent to Schaeffer Lake in the 2016 DTM. The area where the elevation values were extracted represented the same inferred topography as the site where Schaeffer Lake had developed. These inferences were based on information in historical U.S. Geological Survey topographic maps as well as features visible in the historical aerial photography. The hydro-flattened surface of Schaeffer Lake in the 2016 DTM was replaced with the extracted elevation values from the adjacent upland land surface. We downsampled the merged product using an aggregation factor of seventy-five to smooth out the terrain surface. We then resampled the simulated DTM to a spatial resolution of 30 cm for differencing with the 2022 DTM to estimate the total thaw subsidence associated with the evolution of the lake prior to its drainage. We performed an accuracy assessment of all three DTMs (2016, 2022, and simulated) by differencing each product inside what appeared to be an undisturbed 30 m × 30 m area between 2016 and 2022 ().
Figure 4. Assessing the accuracy of differencing the three digital terrain models (DTMs) used in our assessments of elevation change. The difference in elevation values was extracted from a 30 m x 30 m area that appeared to have remained stable and undisturbed between 2016 and 2022. Left, 2022 DTM versus 2016 DTM; middle, simulated DTM versus 2016 DTM; right, simulated DTM versus 2022 DTM.
Results
Local environmental observations of the sudden thermokarst lake drainage
On 29 June 2022, a sudden lake drainage event was reported on the LEO Network by Susan Schaeffer Tessier and Tim Tessier, who have their home on the allotment near the lake, which is located 5 km northeast of Kotzebue, Alaska (Tessier et al. Citation2022):
The event occurred on June 29th, on our native allotment (Illivak) near Kotzebue. We left home in the morning and when we came back around 8:00 PM in the evening the whole lake had drained! It looked like it was blown up with dynamite. (Susan Schaeffer Tessier, 29 June 2022)
The Tessiers observed that the drainage gully was 1 m wide on the north end of the lake and that it eroded downwards at least 6 to 7 m into ice-rich permafrost during the drainage event. Very high-resolution satellite images acquired on 24 June 2022 and 30 June 2022 also detected lake drainage in this same time span (). The Tessiers also noted the pattern of degraded ice wedges and intervening ice wedge polygon centers evident in the drained thermokarst lake basin bottom as well as accumulations of dead aquatic invertebrates that were providing forage for ducks. The week before the sudden lake drainage, Susan saw a beaver in the lake for the first time (). Following the sudden lake drainage, Tim also observed signs of beaver-chewed wood in the willow shrubs adjacent to where the lake drainage occurred ().
Figure 5. Evidence for beaver burrowing as a thermokarst lake drainage mechanism (red circles and ovals). (a) A beaver showed up in the lake a week before the lake drained for the first time in at least four years (photo credit: Susan Schaeffer Tessier). (b) An image acquired by the drone system during a flight down the drainage gully showing beaver-chewed wood (photo credit: Benjamin Jones). (c) and (d) Beaver chew on the bush near the location where the drainage gully formed (photo credit: Tim Tessier).
Decadal-scale thermokarst lake evolution prior to drainage
Historic aerial photographs and contemporary very high-resolution satellite image time series show a gradually expanding thermokarst lake between 1951 and 2021 (). In 1951, Schaeffer Lake consisted of two small waterbodies totaling an area of 0.13 ha (). Between 1951 and 1974, the two waterbodies coalesced, and the lake expanded at an average rate of 0.28 m/year, nearly doubling in surface water area (). From 1974 to 1993, lake expansion rates increased to 0.35 m/year, which added an additional 0.12 ha of surface water area to the lake. Between 1993 and 2007, lake expansion rates decreased slightly to 0.25 m/year, and the surface water area increased by 0.08 ha, for a total area of 0.44 ha. Lake expansion rates remained just below average (0.27 m/year) between 2007 and 2021, whereas the lake area increased to 0.54 ha. Over the most recent observation period, the lake expanded most rapidly toward the direction it eventually drained, northwards into Kotzebue Sound.
Figure 6. Remote sensing time series showing the evolution of Schaeffer Lake between 1951 and 2021. Historic photography is from 1951, 1974, and 1993. High-resolution commercial satellite imagery is from 2007 and 2021. The lake area increased by >300 percent between 1951 and 2021, prior to its drainage in 2022. The grid in the lower row measures 30 m × 30 m. ©2023 Maxar.
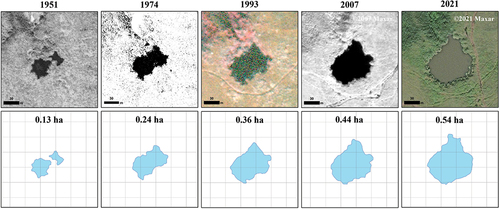
Table 2. Reconstructing the evolution of Schaeffer Lake between 1951 and 2021.
Differencing digital terrain models—Lake drainage and gully erosion
We differenced the pre- and post-drainage DTM products from 2016 and 2022 to assess changes in elevation associated with the loss of water in the lake basin as well as formation of a 125-m-long drainage gully (). The mean difference in elevations between the two DTMs in the undisturbed accuracy assessment area was 0.05 m, with a range from −0.34 m to 0.26 m (). We estimate that the lake was between 3 and 4 m deep on average prior to drainage, and microtopography associated with degrading sub-lake ice wedges was on the order of 0.6 to 1.0 m, indicating active sub-lake thermokarst processes prior to its drainage. Downcutting of ice-rich permafrost during the drainage event resulted in a thermo-erosional gully extending for 125 m and exceeding 13 m in depth adjacent to the old lake shoreline (). Further downstream, near the base of the ocean bluff, the depth of incision was on the order of 2 to 4 m. The estimated lake water volume lost through the drainage was 18,500 m3 and the estimated amount of material (sediment and ice) transported through erosion and thawing was 8,555 m3. The 2021 DTM was partially affected by lingering snow cover and limited spatial resolution relative to the other two DTMs, but it did provide an assessment of the perimeter near where the lake drained. It showed that the lake bank was more than 3 m tall and that the distance from the lake edge to an elevation equal to or lower than that of the lake surface exceeded 25 m, which allowed us to rule out bank overtopping as a likely drainage mechanism for Schaeffer Lake.
Figure 7. Elevation changes using DTMs acquired in 2016 and 2022. (a) A DTM derived from a point cloud based on structure-from-motion analysis of airborne digital photography acquired on 1 September 2016. (b) A DTM derived from a point cloud based on structure-from-motion analysis of drone system digital photography acquired on 22 August 2022. (c) Elevation changes exceeding 0.5 m for the thermokarst lake and drainage gully between the 2016 and 2022 DTMs. Elevation change values indicate subsidence, lake level lowering, and thermo-erosion.
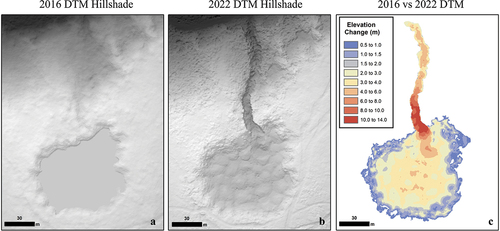
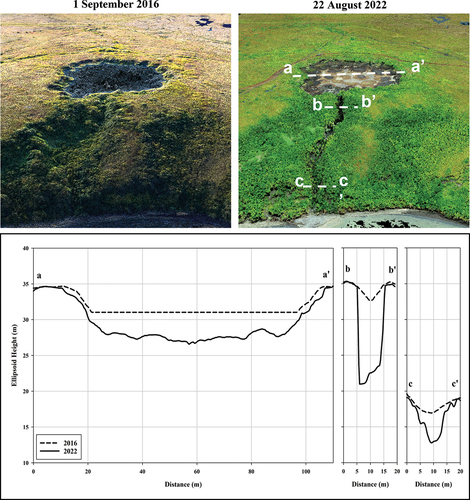
Figure 8. (top) Colorized point clouds developed using structure-from-motion techniques with imagery acquired from a plane (1 September 2016; Fairbanks Fodar Citation2019) and a drone system (22 August 2022). The thermo-erosional drainage gully is evident in the 22 August 2022, fifty-four days after the thermokarst lake drained. Note the patterned ground associated with melting ice wedges and degrading permafrost that was still present on the lake bottom. The dashed transect lines refer to the topographic plots shown below. DTM profiles showing the elevation differences associated with the lake drainage event. Transect a is a profile across the middle of the lake. It shows thermokarst lake expansion between 2016 versus 2022 as well as the drainage of the lake. Transect b is a profile across the upper portion of the gully that was formed during the drainage event. The maximum downcutting is estimated at 13 to 14 m. Transect c is a profile across the lower portion of the gully, ~100 m downslope of where the lake failure occurred. Note that the x-axis and y-axis are the same scale for each of the transects.
Differencing digital terrain models—Subsidence due to thermokarst lake development
We estimated the total subsidence due to thermokarst lake formation and drainage processes by differencing the simulated DTM that was developed to represent the ice-rich permafrost terrain prior to the formation of any thermokarst lake at the site with the postdrainage DTM from 2022 (). The mean difference in elevations in the undisturbed accuracy assessment area between the simulated DTM and the 2016 and 2022 DTMs was −0.06 m and 0.11 m, respectively, and the range was −0.47 m to 0.27 m and −0.49 m to 0.22 m, respectively (). The estimated mean permafrost thaw subsidence magnitude for the basin was 6.5 m, with a range of 1.9 m to 10.6 m, thus exceeding the estimated uncertainty in the DTM products. Drained lake basin microtopography associated with melting ice wedges and degrading polygon centers is on the order of 0.6 to 1.0 m, with troughs being between 8 and 10 m wide in some cases.
Figure 9. Estimating the magnitude of permafrost thaw subsidence using a simulated DTM and the drone system DTM acquired on 18 August 2022. (a) We simulated an “original surface” DTM by digitizing the predrainage lake perimeter, masking it from the 2016 DTM, replacing the values from an adjacent representative upland of the same slope, and then aggregating and resampling the gridded elevation data. (b) The drone system DTM clipped to the extent of Schaeffer Lake in 2021, prior to drainage. (c) Thaw subsidence estimated by differencing the simulated DTM and the drone system DTM. The white polygons in the image represent the lake perimeter at various times in the past. This was used to estimate thaw subsidence magnitude and rates over time.
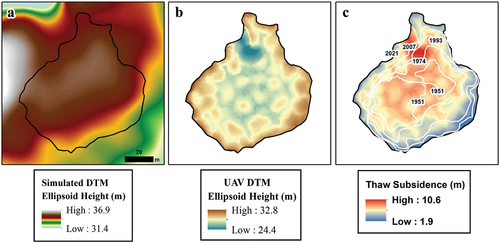
We further assessed subsidence rates over time by quantifying subsidence magnitudes using the time series of lake perimeters digitized from the aerial photography and very high-resolution satellite imagery (). For example, the mean estimated subsidence based on the perimeters of the two small ponds that already existed in 1951 was 7.4 m. Next, by isolating out the area of lake expansion that occurred between 1951 and 1974, we estimate that the mean subsidence of the land surface was 7.2 m. Isolating out the area of lake expansion and estimating the respective subsidence for each of the remaining three time periods showed that between 1974 and 1993 it was 6.3 m, between 1993 and 2007 it was 5.7 m, and between 2007 and 2021 it was 5.5 m. These data show that the mean rate of subsidence was initially quite rapid (0.78 m/year for the area that transitioned from tundra to lake between 2007 and 2021) but that it slowed over time (0.12 m/year for the area that transitioned from tundra to lake between 1951 and 1974).
Figure 10. Estimated mean terrain subsidence magnitude and rates based on the difference in elevation between the simulated DTM and the drone system DTM relative to the time periods of thermokarst lake expansion determined with the remote sensing time series imagery. As shown here, thermokarst processes led to rapid rates of subsidence in the first decade following disturbance but diminished over time as the lake deepened.
Discussion
The life cycle of a thermokarst lake on the Baldwin Peninsula
Major knowledge gaps still exist concerning the environmental factors that drive the initiation and long-term growth of permafrost-region lakes such that reliable projections of future lake formation remain limited despite several decades of research focused on these aspects of L-DLB systems (Jorgenson and Shur Citation2007; S. Wolfe et al. Citation2020; B. M. Jones et al. Citation2022). Our reconstruction of the evolution and drainage of the small thermokarst lake on the Schaeffer’s Native allotment provides a unique data set to assess rates of lake expansion relative to rates of sub-lake permafrost thaw subsidence. There are many similar small thermokarst lakes actively evolving in the ice-rich Yedoma uplands of the Baldwin Peninsula. In the case of Schaeffer Lake, we were lucky to have a historical image from 1951 of the site showing a very young thermokarst lake system that matured relatively quickly. The most rapid increase in lake surface area occurred in the first four decades of observation. The lake area more than tripled, increasing by 4.2 percent/year between 1951 and 1993, whereas lake area increases slowed to 1.8 percent/year from 1993 to 2021. Lake expansion rates were also higher in the first two time periods (0.28 and 0.35 m/year) relative to the latter time periods of observation (0.25 and 0.27 m/year). In addition, we were able to assess the rate of permafrost thaw subsidence between 2007 and 2021, estimated to be 0.78 m/year, which contrasts with the lateral rate of expansion of 0.27 m/year over that same time period.
The ability to visit the site during the same summer as the lake drainage event provided an opportunity to acquire data to create a high-resolution orthophoto mosaic, DSM, and derived DTM of the freshly drained lake basin. These data allowed us to use a simulated pre-thermokarst lake-affected land surface to estimate permafrost thaw subsidence rates below a thermokarst lake using our remote sensing time series, which is information that is not readily available in the literature. Our results showed the rapid nature of permafrost thaw subsidence in the first decade following the transition from tundra to lake through thermokarst but that the rate of permafrost thaw subsidence declined over time. These findings are similar to permafrost thaw subsidence rates as observed by Ulrich et al. (Citation2017) for Yedoma lakes in Central Yakutia where subsidence rates were nearly double the rate for younger lakes that had formed in the last thirty years relative to older lakes that formed more than seventy years ago. However, the rates that we measured most recently over the approximately fifteen-year period from 2007 to 2021 are nearly four times higher than thermokarst lake subsidence rates for the middle part of the Lena River basin in eastern Siberia (Fedorov et al. Citation2014). This difference in the rate of subsidence can likely be explained by differences in the near-surface ground ice content and the distribution of ice wedges in the upper permafrost between the two regions (Nitzbon et al. Citation2021).
Reassessing potential lake drainage mechanisms
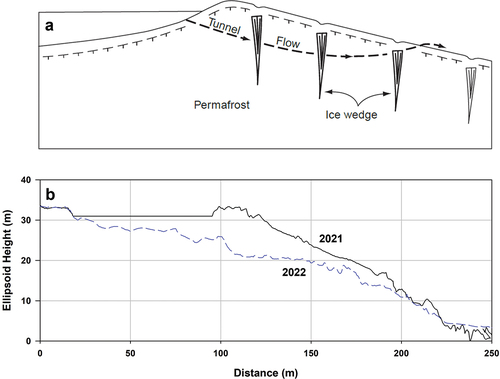
Common mechanisms that may lead to lake drainage in the continuous permafrost zone include ice wedge degradation (flow through ice wedge troughs), headward stream erosion, snow dam accumulation, bank overtopping, river channel migration, coastal erosion, underground piping or tunnel flow (drainage through open frost cracks or layers of permeable material), human disturbance, and expansion of a lake toward a drainage gradient (Mackay Citation1988; Hinkel et al. Citation2007; Grosse, Jones, and Arp, Citation2013; B. M. Jones, Arp, et al. Citation2020). In “first-order” lakes like Schaeffer Lake, Mackay (Citation1988) previously identified lateral, subsurficial drainage via underground tunnel flow, through a process known as ice wedge tunneling, as a frequent cause of thermokarst lake drainage in the northwestern Canadian Arctic. Lakes draining via this mechanism typically drain during the snowmelt period via tunnel flow through interconnected ice wedge cracks. However, in the case of Schaeffer Lake, it drained several weeks following the snowmelt period, so it is unlikely that snowmelt water triggered the underground erosion that caused the lake to drain (). Prior to drainage, Schaeffer Lake also lacked a drainage outlet and the banks around the lake perimeter were between 2 and 4 m tall (), so it is unlikely that bank overtopping triggered the lake drainage.
Figure 11. (a) from Mackay (Citation1988) depicting the process of lateral, subsurficial drainage via underground tunnel flow, through a process known as ice wedge tunneling, which happens through contraction cracks developed during the previous winter. This lake drainage process likely caused the drainage of Schaeffer Lake. (b) Topographic profiles extracted from the DTM created using the MACS overflights in June 2021 (black line), the year prior to the lake drainage, and in August 2022 (blue dashed line) after drainage. The lake bank was 2 to 3 m tall where the lake drainage occurred, and a drainage gradient extended away from the lake edge more than 25 m.
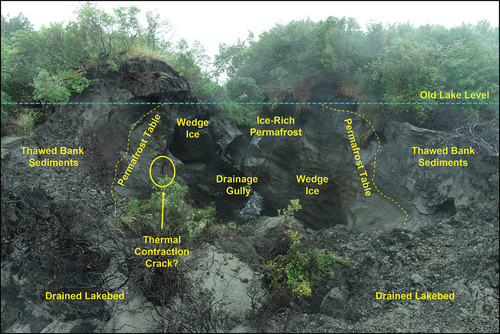
Though we can only speculate here, the direct observation by Susan Tessier of a beaver in the lake for the first time in the week prior to its drainage could point at a key factor contributing to the sudden lake drainage. Beavers are known to dig tunnels and burrows adjacent to waterbodies with bluffs and banks (Zurowski Citation1992; Rozhkova-Timina et al. Citation2018). The burrows are generally short (1–4 m long) but can have many underground branches and levels, with the entrance of the burrow generally being located underwater for protection against predators (Rozhkova-Timina et al. Citation2018). Observations at the recently drained lake basin on 18 August 2022 showed that the permafrost table was more than 3 m below the lake bed near where the drainage occurred, which could have provided thawed sediments that enabled burrowing (). Thus, we hypothesize that beaver burrowing in the banks of thermokarst lakes could promote underground tunnel flow and erosion of ice wedges, contributing to further increases in Arctic lake drainage. This valuable local observation made by the Tessiers provides a potentially new thermokarst lake drainage mechanism to be considered in regions where beavers also occur.
Figure 12. A photo taken by the drone system in August 2022 of the Schaeffer Lake drainage gully. Annotations have been added to the photo showing the lake level prior to drainage, the nearshore permafrost table and thawed bank sediments, a potential remnant contraction crack, wedge ice, and ice-rich permafrost exposed in the drainage gully. The lake likely drained because of tunnel flow through thermal contraction cracks in ice wedges. Thawed bank and sub-lake sediments could have permitted beaver burrowing near where the lake drained.
L-DLB systems in a warming climate
L-DLB systems are rapidly shifting toward one that is more heavily dominated by drained lake basins where the trajectory of the evolution of drained lake basins is also likely to be disrupted by a changing climate (B. M. Jones et al. Citation2022; Webb et al. Citation2022). Under a cold climate, following lake drainage, permafrost would typically form through top-down freezing (epigenetically) in the freshly exposed basin bottom as well as through quasi-syngenetic processes associated with peat accumulation in the basin (Kanevskiy et al. Citation2014). The thickness of ice-rich permafrost below DLBs tends to be restricted to the upper several meters of the land surface because epigenetic ice wedges tend to grow wider rather than deeper compared to their syngenetic counterparts (Mackay Citation1997). However, given a warmer climate and possibly one with more winter snowfall, there is likely to be a regime shift in drained lake basins in continuous permafrost regions such that near-surface permafrost no longer aggrades and new ice wedges do not form in the basin following drainage (B. M. Jones et al. Citation2022; Lantz, Zhang, and Kokelj Citation2022). The unique opportunity provided by the observations documented through the LEO Network demonstrate the value of the observation network in connecting local observers to researchers, which could potentially result in identifying long-term observation sites for future study. It also documents the mutual benefit from this type of rapid community-based observation and reporting by jointly helping with the interpretation of local events associated with rapid environmental change in the Arctic.
The local observations also add insights into the likely effects of a warming Arctic on the cascading effects on L-DLB landscapes and ecosystems. Range expansion of beaver has been reported as soil conditions change and warming allows for the growth of shrubs providing habitat for moose, muskrat, beaver, and other wildlife (Tape, Christie, et al. Citation2016; Tape, Gustine, et al. Citation2016). The expanding presence of beavers in the region, with more than 12,000 new ponds mapped in imagery since the early 1950s (Tape et al. Citation2022), offers unique opportunities to study the interactions between beavers, permafrost, and thermokarst lake dynamics (B. M. Jones, Tape, et al. Citation2020). In addition, from a public health standpoint, beaver range expansion in the Arctic has been associated with increased risk of waterborne illness, which may further compromise subsistence drinking water sources in the Arctic (DeMarban Citation2011).
The impact of lake drainage on drinking water sources
Lakes are a key subsistence resource in the Arctic (Berkes Citation1990; Brinkman et al. Citation2016; Arp et al. Citation2019). They provide important habitat for the subsistence harvest of fish, birds, and other wildlife resources (R. J. Wolfe and Walker Citation1987; Fauchald et al. Citation2017), are important transportation routes (Brinkman et al. Citation2016; Wrona et al. Citation2016), and serve as a source of year-round drinking water (Martin et al. Citation2007; White et al. Citation2007; Medeiros et al. Citation2017). Lakes and streams are often the only viable source of drinking water in permafrost regions due to the lack of access to groundwater resources (Martin et al. Citation2007; Alessa et al. Citation2008). In the winter, lakes are particularly important drinking water sources because freshwater ice may get harvested to provide water during the eight- to nine-month-long cold season (Crate Citation2012; Medeiros et al. Citation2017). The drainage of Schaeffer Lake has resulted in the loss of the Tessiers’ preferred wintertime source of drinking water. To them, the clear water and once reliable source provided an unlimited supply of freshwater ice that sustained their drinking water needs during the entire winter. Now that their local water source has drained, they will either need to melt snow for drinking, which is not as desirable, or travel further to access and harvest ice for their drinking water needs.
The importance of local observations in a changing Arctic
Despite widespread observations of lake drainage in Arctic Alaska using remote sensing data (Hinkel et al. Citation2007; B. M. Jones et al. Citation2011; Nitze et al. Citation2018, Citation2020; Swanson Citation2019; Lara, Chen, and Jones Citation2021), there are very few field-measured or eyewitness records of lake drainage events (Mackay Citation1997; Hinkel et al. Citation2007; B. M. Jones and Arp Citation2015; Burn Citation2020; Rozell Citation2022; Turner, Wolfe, and McDonald Citation2022). If the Tessiers had not documented the lake drainage event that occurred on their Native allotment on 29 June 2022 (Tessier et al. Citation2022), it is likely that the drainage of the small lake would have gone unnoticed and/or it would have taken time for it to be detected in remote sensing data. The rapid reporting associated with the LEO Network post along with the back-and-forth dialogue between the local observers and national and international scientists provided an opportunity to visit the site soon after the drainage event so that timely observations and data collection could take place in August 2022. The presence of historical remote sensing observations available for the site combined with the detailed local observations has provided new insights into thermokarst lake dynamics in the Arctic. For example, the presence of a beaver in the lake for the first time in the week prior to its drainage and the presence of beaver-chewed wood near the drainage outlet would have been overlooked as a possible drainage mechanism in the absence of local observations and a mechanism to connect communities in the Arctic through the LEO Network.
Since 2009, the Alaska Native Tribal Health Consortium has been developing a conversation with Arctic residents to facilitate sharing their experiences, better understand these event-based symptoms, and describe relationships between climate change, environmental impacts, and health effects through their Center for Climate and Health. In 2012, the LEO Network was launched as a tool to help the tribal health system and local observers to share information about climate and other drivers of environmental change. LEO serves as an almanac of first-person accounts of unusual environmental events, which are often the first signals of significant and systemic changes occurring in their environment. The LEO Network itself is part observation system, part social and consultation network, and part publishing platform. This approach works because people who have intimate knowledge about their local environment share their observations on the platform and, by doing so, share information with people in other communities and countries. The LEO Network now has approximately 3,600 members from 700 different communities worldwide. The drainage of Schaeffer Lake has undoubtedly sparked the most in terms of observations and contributions from local observers being connected to national and international scientists. The example of the sudden lake drainage event documented by the Tessiers’ is evidence that the LEO Network is effective at connecting with others in the community, sharing observations, raising awareness, and discussing the significance of environmental events. It also provides that often missing link between local environmental observations and engaging with topic experts in different organizations and from different disciplinary backgrounds that serves to strengthen the broader Arctic community.
Conclusions
In this study, we combine local environmental observations and remote sensing data to reconstruct the evolution and drainage of a small thermokarst lake formed in ice-rich permafrost on the Baldwin Peninsula in northwestern Arctic Alaska. The lake drained on 29 June 2022 as observed and documented by the LEO Network. The LEO Network provided a valuable platform for local observers and national and international scientists to exchange observations and information. The online discussion prompted a site visit invitation to the local observer’s Native allotment that resulted in the collection of valuable scientific data that has provided new insights into the evolution of thermokarst lakes in the Arctic and this collaborative study. In particular, new information on sub-lake permafrost thaw subsidence rates was made possible as well as observations that led to the hypothesis that beaver burrowing may facilitate tunnel erosion of ice wedges and lead to the sudden drainage of Arctic lakes. This study highlights the importance of local environmental observations for better understanding and addressing changes occurring in the Arctic in a more timely and collaborative manner.
Acknowledgments
We thank Associate Editor Duane Froese (University of Alberta) and two reviewers, Kevin Turner (Brock University) and Trevor Lantz (University of Victoria), for providing a thorough review and assessment of our article that has improved this published version. We would also like to thank the National Science Foundation Research Support and Logistics Program for field support provided through contracts with Battelle Arctic Research Operations and Polar Field Services.
Disclosure statement
No potential conflict of interest was reported by the author(s).
Additional information
Funding
References
- Alessa, L., A. Kliskey, R. Lammers, C. Arp, D. White, L. Hinzman, and R. Busey. 2008. The Arctic water resource vulnerability index: An integrated assessment tool for community resilience and vulnerability with respect to freshwater. Environmental Management 42, no. 3: 523–16. doi:10.1007/s00267-008-9152-0.
- Arp, C. D., M. S. Whitman, B. M. Jones, D. A. Nigro, V. A. Alexeev, A. Gädeke, S. Fritz, et al. 2019. Ice roads through lake-rich Arctic watersheds: Integrating climate uncertainty and freshwater habitat responses into adaptive management. Arctic, Antarctic, and Alpine Research 51, no. 1: 9–23. doi:10.1080/15230430.2018.1560839.
- Bergstedt, H., B. M. Jones, K. Hinkel, L. Farquharson, B. V. Gaglioti, A. D. Parsekian, M. Kanevskiy, et al. 2021. Remote sensing-based statistical approach for defining drained lake basins in a continuous permafrost region, North Slope of Alaska. Remote Sensing 13, no. 13: 2539. doi:10.3390/rs13132539.
- Berkes, F. 1990. Native subsistence fisheries: A synthesis of harvest studies in Canada. Arctic 43, no. 1: 35–42. doi:10.14430/arctic1588.
- Bouchard, F., D. Fortier, M. Paquette, V. Boucher, R. Pienitz, and I. Laurion. 2020. Thermokarst lake inception and development in syngenetic ice-wedge polygon terrain during a cooling climatic trend, Bylot Island (Nunavut), eastern Canadian Arctic. The Cryosphere 14, no. 8: 2607–27. doi:10.5194/tc-14-2607-2020.
- Brinkman, T. J., W. D. Hansen, F. S. Chapin, G. Kofinas, S. BurnSilver, and T. S. Rupp. 2016. Arctic communities perceive climate impacts on access as a critical challenge to availability of subsistence resources. Climatic Change 139, no. 3–4: 413–27. doi:10.1007/s10584-016-1819-6.
- Brosius, L. S., K. M. W. Anthony, C. C. Treat, J. Lenz, M. C. Jones, M. S. Bret-Harte, and G. Grosse. 2021. Spatiotemporal patterns of northern lake formation since the Last Glacial Maximum. Quaternary Science Reviews 253:106773. doi:10.1016/j.quascirev.2020.106773.
- Burn, C. 2020. The Illisarvik drained-lake field experiment: A legacy of J. Ross Mackay. In Curious about nature: A passion for fieldwork, ed. D. Thompson and T. Burt, 156–60. Cambridge: Cambridge University Press.
- Crate, S. A. 2012. Climate change and ice dependent communities: Perspectives from Siberia and Labrador. The Polar Journal 2, no. 1: 61–75. doi:10.1080/2154896X.2012.679560.
- DeMarban, A. 2011. In Arctic, climate-change threats include giardia, food poisoning [online]. http://www.thearcticsounder.com/article/1109in_arctic_climate-change_threats_include (accessed November 15, 2022).
- ESRI. 2022. ArcGIS Desktop. Redlands, CA: Environmental Systems Research Institute.
- Fairbanks Fodar. 2019. Digital mapping of coast between Cape Thompson and Cape Prince of Wales [online]. https://elevation.alaska.gov/ (accessed August 21, 2022).
- Farquharson, L. M., D. H. Mann, G. Grosse, B. M. Jones, and V. E. Romanovsky. 2016. Spatial distribution of thermokarst terrain in Arctic Alaska. Geomorphology 273:116–33. doi:10.1016/j.geomorph.2016.08.007.
- Fauchald, P., V. Hausner, J. Schmidt, and D. Clark. 2017. Transitions of social-ecological subsistence systems in the Arctic. International Journal of the Commons 11, no. 1: 275–329. doi:10.18352/ijc.698.
- Fedorov, A. N., P. P. Gavriliev, P. Y. Konstantinov, T. Hiyama, Y. Iijima, and G. Iwahana. 2014. Estimating the water balance of a thermokarst lake in the middle of the Lena River basin, eastern Siberia. Ecohydrology 7, no. 2: 188–96. doi:10.1002/eco.1378.
- Grosse, G., B. Jones, C. Arp. 2013. 8.21 Thermokarst lakes, drainage, and drained basins. In Treatise on geomorphology, and J. F. Shroder, 325–53. San Diego: Academic Press.
- Himmelstoss, E. A., R. E. Henderson, M. G. Kratzmann, and A. S. Farris. 2021. Digital Shoreline Analysis System (DSAS) version 5.1 user guide. Open-File Report. U.S. Geological Survey, No. 2021–1091.
- Hinkel, K. M., R. C. Frohn, F. E. Nelson, W. R. Eisner, and R. A. Beck. 2005. Morphometric and spatial analysis of thaw lakes and drained thaw lake basins in the western Arctic Coastal Plain, Alaska. Permafrost and Periglacial Processes 16, no. 4: 327–41. doi:10.1002/ppp.532.
- Hinkel, K. M., B. M. Jones, W. R. Eisner, C. J. Cuomo, R. A. Beck, and R. Frohn. 2007. Methods to assess natural and anthropogenic thaw lake drainage on the western Arctic coastal plain of northern Alaska. Journal of Geophysical Research: Earth Surface 112 (F2). doi:10.1029/2006JF000584.
- Jones, B. M. 2023. Geospatial Data Documenting the Expansion and Drainage of Schaeffer Lake, Northwestern Arctic Alaska, 1951-2022. Arctic Data Center. doi:10.18739/A2930NW7W.
- Jones, B. M., and C. D. Arp. 2015. Observing a catastrophic thermokarst lake drainage in Northern Alaska. Permafrost and Periglacial Processes 26, no. 2: 119–28. doi:10.1002/ppp.1842.
- Jones, B. M., C. D. Arp, G. Grosse, I. Nitze, M. J. Lara, M. S. Whitman, L. M. Farquharson, et al. 2020. Identifying historical and future potential lake drainage events on the western Arctic coastal plain of Alaska. Permafrost and Periglacial Processes 31, no. 1: 110–27. doi:10.1002/ppp.2038.
- Jones, B. M., G. Grosse, C. D. Arp, M. C. Jones, K. M. Walter Anthony, and V. E. Romanovsky. 2011. Modern thermokarst lake dynamics in the continuous permafrost zone, northern Seward Peninsula, Alaska. Journal of Geophysical Research: Biogeosciences 116:G2. doi:10.1029/2011JG001666.
- Jones, B. M., G. Grosse, L. M. Farquharson, P. Roy-Léveillée, A. Veremeeva, M. Z. Kanevskiy, B. V. Gaglioti, et al. 2022. Lake and drained lake basin systems in lowland permafrost regions. Nature Reviews Earth & Environment 3, no. 1: 85–98. doi:10.1038/s43017-021-00238-9.
- Jones, M. C., G. Grosse, B. M. Jones, and K. Walter Anthony. 2012. Peat accumulation in drained thermokarst lake basins in continuous, ice-rich permafrost, northern Seward Peninsula, Alaska. Journal of Geophysical Research: Biogeosciences 117, no. G2: G2. doi:10.1029/2011JG001766.
- Jones, B. M., K. D. Tape, J. A. Clark, I. Nitze, G. Grosse, and J. Disbrow. 2020. Increase in beaver dams controls surface water and thermokarst dynamics in an Arctic tundra region. Baldwin Peninsula, Northwestern Alaska 15, no. 7: 75005.
- Jorgenson, M. T., and Y. Shur. 2007. Evolution of lakes and basins in northern Alaska and discussion of the thaw lake cycle. Journal of Geophysical Research: Earth Surface 112, no. F2: F2. doi:10.1029/2006JF000531.
- Kanevskiy, M., T. Jorgenson, Y. Shur, J. A. O’Donnell, J. W. Harden, Q. Zhuang, and D. Fortier. 2014. Cryostratigraphy and permafrost evolution in the lacustrine lowlands of West-Central Alaska. Permafrost and Periglacial Processes 25, no. 1: 14–34. doi:10.1002/ppp.1800.
- Lantz, T. C., Y. Zhang, and S. V. Kokelj. 2022. Impacts of ecological succession and climate warming on permafrost aggradation in drained lake basins of the Tuktoyaktuk Coastlands, Northwest Territories, Canada. Permafrost and Periglacial Processes 33, no. 2: 176–92. doi:10.1002/ppp.2143.
- Lara, M. J., Y. Chen, and B. M. Jones. 2021. Recent warming reverses forty-year decline in catastrophic lake drainage and hastens gradual lake drainage across northern Alaska. Environmental Research Letters 16, no. 12: 124019. doi:10.1088/1748-9326/ac3602.
- Mackay, J. R. 1988. Catastrophic lake drainage, Tuktoyaktuk peninsula area, District of Mackenzie. Current Research, Part D, Geological Survey of Canada, Paper 88:83–90.
- Mackay, J. R. 1997. A full-scale field experiment (1978–1995) on the growth of permafrost by means of lake drainage, western Arctic coast: A discussion of the method and some results. Canadian Journal of Earth Sciences 34, no. 1: 17–33. doi:10.1139/e17-002.
- Martin, D., D. Bélanger, P. Gosselin, J. Brazeau, C. Furgal, and S. Déry. 2007. Drinking water and potential threats to human health in Nunavik: Adaptation strategies under climate change conditions. Arctic 60, no. 2: 195–202.
- Medeiros, A. S., P. Wood, S. D. Wesche, M. Bakaic, and J. F. Peters. 2017. Water security for northern peoples: Review of threats to Arctic freshwater systems in Nunavut, Canada. Regional Environmental Change 17, no. 3: 635–47. doi:10.1007/s10113-016-1084-2.
- Nitzbon, J., M. Langer, L. C. P. Martin, S. Westermann, T. Schneider von Deimling, and J. Boike. 2021. Effects of multi-scale heterogeneity on the simulated evolution of ice-rich permafrost lowlands under a warming climate. The Cryosphere 15, no. 3: 1399–422. doi:10.5194/tc-15-1399-2021.
- Nitze, I., S. W. Cooley, C. R. Duguay, B. M. Jones, and G. Grosse. 2020. The catastrophic thermokarst lake drainage events of 2018 in northwestern Alaska: Fast-forward into the future. The Cryosphere 14, no. 12: 4279–97. doi:10.5194/tc-14-4279-2020.
- Nitze, I., G. Grosse, B. M. Jones, V. E. Romanovsky, and J. Boike. 2018. Remote sensing quantifies widespread abundance of permafrost region disturbances across the Arctic and Subarctic. Nature Communications 9, no. 1: 5423. doi:10.1038/s41467-018-07663-3.
- Nolan, M., C. Larsen, and M. Sturm. 2015. Mapping snow depth from manned aircraft on landscape scales at centimeter resolution using structure-from-motion photogrammetry. The Cryosphere 9, no. 4: 1445–63.
- PIX4D. 2022. Pix4dmapper: Release 4.7.5. Prilly, Switzerland: PIX4D S.A.
- QTM. 2022. Quick Terrain Modeler: Release 8.3.1. Baltimore, MD: Applied Imagery, John Hopkins University Applied Physics Laboratory.
- Rozell, N. 2022. If a lake drains in northern Alaska … [online]. https://uaf.edu/news/if-a-lake-drains-in-northern-alaska.php (accessed October 12, 2022).
- Rozhkova-Timina, I. O., V. K. Popkov, P. J. Mitchell, and S. N. Kirpotin. 2018. Beavers as ecosystem engineers – A review of their positive and negative effects. IOP Conference Series: Earth and Environmental Science. 201:012015.
- Swanson, D. K. 2019. Thermokarst and precipitation drive changes in the area of lakes and ponds in the National Parks of northwestern Alaska, 1984–2018. Arctic, Antarctic, and Alpine Research 51, no. 1: 265–79. doi:10.1080/15230430.2019.1629222.
- Tape, K. D., K. Christie, G. Carroll, and J. A. O’Donnell. 2016. Novel wildlife in the Arctic: The influence of changing riparian ecosystems and shrub habitat expansion on snowshoe hares. Global Change Biology 22, no. 1: 208–19. doi:10.1111/gcb.13058.
- Tape, K. D., J. A. Clark, B. M. Jones, S. Kantner, B. V. Gaglioti, G. Grosse, and I. Nitze. 2022. Expanding beaver engineering creates widespread disturbances in the Arctic. Scientific reports.
- Tape, K. D., D. D. Gustine, R. W. Ruess, L. G. Adams, and J. A. Clark. 2016. Range expansion of moose in Arctic Alaska linked to warming and increased shrub habitat. PloS one 11, no. 4: e0152636. doi:10.1371/journal.pone.0152636.
- Tape, K. D., B. M. Jones, C. D. Arp, I. Nitze, and G. Grosse. 2018. Tundra be dammed: Beaver colonization of the Arctic. Global Change Biology 24, no. 10: 4478–88. doi:10.1111/gcb.14332.
- Tessier, S., B. Forbes, G. Grosse, B. M. Jones, I. Nitze, and J. Schaeffer. 2022. Sudden lake draining event - Local Environmental Observer (LEO) Network [online]. https://www.leonetwork.org/en/posts/preview/DC4753BF-6270-46EE-816B-6B97C36B30D3 (accessed August 24, 2022).
- Turetsky, M. R., B. W. Abbott, M. C. Jones, K. W. Anthony, D. Olefeldt, E. A. G. Schuur, G. Grosse, et al. 2020. Carbon release through abrupt permafrost thaw. Nature Geoscience 13, no. 2: 138–43. doi:10.1038/s41561-019-0526-0.
- Turner, K. W., B. B. Wolfe, and I. McDonald. 2022. Monitoring 13 years of drastic catchment change and the hydroecological responses of a drained thermokarst lake. Arctic Science 8, no. 4: 1094–115.
- Ulrich, M., H. Matthes, L. Schirrmeister, J. Schütze, H. Park, Y. Iijima, and A. N. Fedorov. 2017. Differences in behavior and distribution of permafrost-related lakes in Central Yakutia and their response to climatic drivers. Water Resources Research 53, no. 2: 1167–88. doi:10.1002/2016WR019267.
- Webb, E. E., A. K. Liljedahl, J. A. Cordeiro, M. M. Loranty, C. Witharana, and J. W. Lichstein. 2022. Permafrost thaw drives surface water decline across lake-rich regions of the Arctic. Nature Climate Change 12, no. 9: 841–6. doi:10.1038/s41558-022-01455-w.
- White, D. M., S. C. Gerlach, P. Loring, A. C. Tidwell, and M. C. Chambers. 2007 Food and water security in achanging Arctic climate. Environmental Research Letters. 2, no. 4: 045018.
- Wolfe, S., J. Murton, M. Bateman, and J. Barlow. 2020. Oriented-lake development in the context of late Quaternary landscape evolution, McKinley Bay Coastal Plain, western Arctic Canada. Quaternary Science Reviews 242:106414. doi:10.1016/j.quascirev.2020.106414.
- Wolfe, R. J., and R. J. Walker. 1987. Subsistence economies in Alaska: Productivity, geography, and development impacts. Arctic Anthropology 24, no. 2: 56–81.
- Wrona, F. J., M. Johansson, J. M. Culp, A. Jenkins, J. Mård, I. H. Myers-Smith, T. D. Prowse, W. F. Vincent, and P. A. Wookey. 2016. Transitions in Arctic ecosystems: Ecological implications of a changing hydrological regime. Journal of Geophysical Research: Biogeosciences 121, no. 3: 650–74.
- Zurowski, W. 1992. Building activity of beavers. Acta Theriologica 37, no. 4: 403–11. doi:10.4098/AT.arch.92-41.