
 ?Mathematical formulae have been encoded as MathML and are displayed in this HTML version using MathJax in order to improve their display. Uncheck the box to turn MathJax off. This feature requires Javascript. Click on a formula to zoom.
ABSTRACT
Increased permafrost temperatures have been reported in the circum-Arctic, and widespread degradation of permafrost peatlands has occurred in recent decades. The timing of permafrost aggradation in these ecosystems could have implications for the soil carbon lability upon thawing, and an increased understanding of the permafrost history is therefore needed to better project future carbon feedbacks. In this study, we have conducted high-resolution plant macrofossil and geochemical analyses and accelerator mass spectrometry radiocarbon dating of active layer cores from four permafrost peatlands in northern Sweden and Norway. In the mid-Holocene, all four sites were wet fens, and at least three of them remained permafrost-free until a shift in vegetation toward bog species was recorded around 800 to 400 cal. BP, suggesting permafrost aggradation during the Little Ice Age. At one site, Karlebotn, the plant macrofossil record also indicated a period of dry bog conditions between 3300 and 2900 cal. BP, followed by a rapid shift toward species growing in waterlogged fens or open pools, suggesting that permafrost possibly was present around 3000 cal. BP but thawed and was replaced by thermokarst.
Introduction
Northern peatlands cover extensive areas and have been long-term net carbon sinks throughout the Holocene (Yu et al. Citation2010; Loisel et al. Citation2014). In subarctic and arctic regions, permafrost conditions prevail in many peatlands as a result of cold climate, thin snow cover, and insulating properties of dry peat in the summer (Zhang Citation2005; Seppälä Citation2011). Permafrost peatlands currently cover c. 1.7 million km2 and store approximately 185 Pg C, a substantial part of the total soil organic carbon stock (Hugelius et al. Citation2020). There are regional differences in the timing of permafrost formation (Treat and Jones Citation2018). In discontinuous permafrost in northeastern European Russia and west-central Canada, permafrost has been present in some peatlands since the mid-Holocene (Väliranta, Kaakinen, and Kuhry Citation2003; Sannel and Kuhry Citation2008). In sporadic permafrost in northern Fennoscandia, Kokfelt et al. (Citation2010) and Oksanen (Citation2006) suggested a first period of permafrost aggradation around 2700 to 2500 cal. BP, followed by thawing and renewed permafrost aggradation with formation of palsas around 600 to 150 cal. BP. In the same region, Kjellman et al. (Citation2018) and Sannel et al. (Citation2018) proposed that permafrost did not form in peatlands until the onset of the Little Ice Age (LIA), around 850 cal. BP (Grudd et al. Citation2002).
There are no distinct indicator species that only occur in the peat record when permafrost is present, but plant macrofossil assemblages suggesting rapid changes from wet fen conditions to xerophilic bog conditions can be used as an indicator of permafrost aggradation, particularly when this transition occurs close to the peat surface and permafrost is present today (Oksanen, Kuhry, and Alekseeva Citation2001; Oksanen Citation2006; Sannel and Kuhry Citation2008). Rapid shifts in the opposite direction, from dry bog to wet fen conditions with species indicative of collapse features, can indicate that permafrost likely was present prior to ground collapse and thermokarst formation (Zoltai Citation1993; Oksanen, Kuhry, and Alekseeva Citation2001). Perturbations in the peat sequence can also be detected by geochemical analyses, and the timing can be determined by radiocarbon dating (e.g., Krüger et al. Citation2017). Geochemical peat properties such as elemental and isotopic organic carbon (C) and nitrogen (N) content and ratios between them, representing changes in the degree of decomposition or changes in the vegetation, can be used as indicators of permafrost presence and aggradation (Vardy et al. Citation2000; Oksanen, Kuhry, and Alekseeva Citation2001; Sannel and Kuhry Citation2009; Alewell et al. Citation2011; Krüger, Leifeld, and Alewell Citation2014; Treat et al. Citation2016; Krüger et al. Citation2017; Kjellman et al. Citation2018). In a pan-Arctic synthesis, Treat et al. (Citation2016) found significantly lower nitrogen content in permafrost peatlands compared to non-permafrost peatlands, possibly as a result of denitrification and disturbance losses, and proposed that nitrogen content can be used as a permafrost marker in paleoecological studies. In permafrost-free peatlands the C/N ratio is generally low and decreases with peat depth as carbon loss occurs through anaerobic decay in the catotelm (Kuhry and Vitt Citation1996). In permafrost peatlands the decomposition is inhibited, and a high C/N ratio throughout the peat sequence has been put forward as an indicator of permafrost presence (Vardy et al. Citation2000; Sannel and Kuhry Citation2009; Treat et al. Citation2016). Following frost heave, aerobic conditions are established in the upper peat layers, causing a loss of isotopically light carbon and nitrogen and increased δ13C and δ15N values. This results in turning points (increasing values from the surface down to a certain depth, followed by decreasing values deeper in the profile) in the isotopic records (Alewell et al. Citation2011; Krüger, Leifeld, and Alewell Citation2014). Turning points in the profiles can also be the result of vegetation changes that occur with frost heave (Alewell et al. Citation2011). The relationship between δ15N and C/N has also been used to identify perturbation and permafrost aggradation in subarctic peatlands (Krüger et al. Citation2017).
Extensive landscape changes have taken place in Fennoscandian permafrost peatlands in recent decades. As a result of global warming, the area covered by palsas and peat plateaus has decreased by up to 70 percent since the 1950s in northern Norway (Borge et al. Citation2017). In northern Sweden, widespread palsa degradation and thermokarst lake drainage have occurred as a result of increasing air temperature and snowfall (Zuidhoff and Kolstrup Citation2000; Sannel and Kuhry Citation2011; Olvmo et al. Citation2020). In this region, permafrost temperatures are close to 0°C, and future warmer and wetter conditions as predicted by Lee et al. (Citation2021) are likely to accelerate permafrost degradation and active layer deepening (Åkerman and Johansson Citation2008; Johansson et al. Citation2011; Sannel et al. Citation2016; Sannel Citation2020). The degradation of permafrost and melting of ground ice trigger formation of thermokarst landforms such as ponds or collapse scar fens and bogs (e.g., Olefeldt et al. Citation2021). This type of abrupt permafrost thaw not only changes the landscape but also enhances climate-forcing trace gas emissions, accelerating carbon release and global warming (Schuur et al. Citation2015, Citation2021; Hugelius et al. Citation2020; Turetsky et al. Citation2020).
Earlier studies focusing on long-term Holocene peatland development and permafrost dynamics in northern Fennoscandia have shown partly contradictory results regarding late Holocene permafrost aggradation (Oksanen Citation2006; Kokfelt et al. Citation2010; Kjellman et al. Citation2018; Sannel et al. Citation2018; Treat and Jones Citation2018). The aim of this study is to increase our understanding of late Holocene permafrost dynamics in northern Fennoscandian peatlands and to provide more accurate dating of the permafrost onset at four study sites in Sweden and Norway. Previous investigations at these sites have mainly used plant macrofossil analysis for detecting long-term Holocene peatland development at a relatively course temporal scale (Kjellman et al. Citation2018; Sannel et al. Citation2018). In this study we only focus on the active layer, representing the time since the mid-Holocene, and use a high sample resolution and a combination of different proxy records. Detailed plant macrofossil analysis and accelerator mass spectrometry (AMS) radiocarbon dating are the main methods, but our study also includes data on geochemical properties, including stable carbon and nitrogen isotopes, that have been suggested as useful tools for determining the timing of permafrost aggradation in palsas (Alewell et al. Citation2011; Krüger, Leifeld, and Alewell Citation2014; Krüger et al. Citation2017). The results of this study will contribute to better understanding of permafrost dynamics and its implications for the carbon balance in northern peatlands since the mid-Holocene, which then can be used to project future carbon emissions from these climate-sensitive ecosystems.
Study area
The four study sites are located in Tavvavuoma, northernmost Sweden (Dávva and Riba), and Finnmark, northern Norway (Lakselv and Karlebotn; ). This part of northern Fennoscandia is characterized by Precambrian bedrock, which in continental areas is overlain by glacial and glaciofluvial sediments deposited during Pleistocene glaciations (Ulfstedt Citation1982; Geological Survey of Norway Citation2020). The landscape in this region is generally characterized by low mountains with a gentle relief, where peatlands cover extensive areas in low-lying terrain and depressions between moraine ridges or rocky outcrops (Ulfstedt Citation1982; Borge et al. Citation2017; Geological Survey of Norway Citation2020). In coastal locations, below the local marine limit, fine-grained glaciomarine sediments are widespread, providing good conditions for peatlands to establish and expand in lowland areas after land emergence (Geological Survey of Norway Citation2020). In Tavvavuoma, northern Sweden, peatlands started to form on sandy glaciofluvial and lacustrine sediments c. 10,000 cal. BP (Ivanova et al. Citation2011; Sannel et al. Citation2018), soon after deglaciation of the Fennoscandian Ice Sheet (Stroeven et al. Citation2016). At the two Norwegian coastal sites, isostatic uplift had to take place prior to peatland initiation. The basal peat is therefore much younger at these sites, around 6150 cal. BP in Lakselv and 5150 cal. BP in Karlebotn (Kjellman et al. Citation2018).
Figure 1. Map showing the four sampling sites in northern Fennoscandia. Dávva and Riba in Tavvavuoma, Sweden, and Lakselv and Karlebotn in Finnmark, Norway. Meteorological stations: N = Naimakka, B = Banak and V = Vardø Radio (d-maps.com Citation2022).
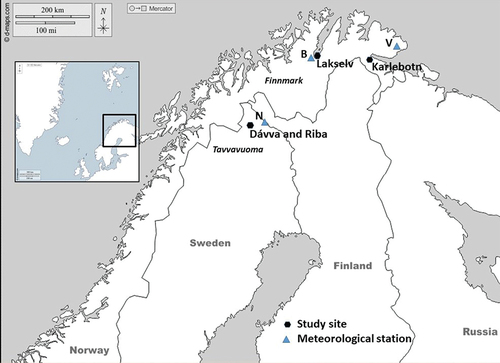
Permafrost is occurring sporadically throughout this region (Gisnås et al. Citation2017). Peat plateaus and palsas are covering extensive areas at more continental locations, both in northern Sweden and around the Finnmarksvidda plateau, but permafrost peatlands are also found almost down to sea level in coastal areas (Borge et al. Citation2017; Gisnås et al. Citation2017). The two sites in northern Sweden are located around 5 km apart, and the difference in elevation is around 70 m (). Dávva is located close to the margin of a c. 2 km2 large peat plateau complex (). At the sampling site the peat plateau is relatively low, around 1 to 2 m higher than the surrounding fens, and the peat depth is 1.05 m (Sannel et al. Citation2018). In Riba the peatland is characterized by up to 5-m-high palsas. The sampling site is located close to the margin of a c. 1 km2 large palsa complex, where the peat is ice rich and more than 2.3 m thick (Sannel et al. Citation2018). The climate in northern Sweden is continental with cold winters and relatively cool and dry summers. At Naimakka (402 m.a.s.l.), the meteorological station that is closest to Tavvavuoma located about 35 km northeast of the two sampling sites, the mean annual air temperature (MAAT) is −1.6°C and the mean annual precipitation (MAP) is 460 mm/year (1991–2020; Swedish Meteorological and Hydrological Institute Citation2022). Because of the altitudinal difference between Tavvavuoma and Naimakka, the MAAT can be expected to be around 1°C colder at Dávva and Riba compared to Naimakka (Sannel et al. Citation2016). The two Norwegian sites are located in coastal settings closer to the sea level c. 250 to 350 km northeast of the sites in Tavvavuoma (). Lakselv is situated in a c. 0.2 km2 small peat plateau complex with extensive fens and low peat plateaus found in a depression surrounded by bare bedrock outcrops. The peat depth at the sampling site is 0.85 m (Kjellman et al. Citation2018). In Karlebotn the peat plateau complex is much larger, around 3 km2, and characterized by extensive 1- to 2-m-high peat plateaus, fens, and streams. The sampling site is situated close to an adjacent fen and has a peat depth of 1.05 m (Kjellman et al. Citation2018). Along the coast the climate is maritime. Because of influence from the Gulf Stream, the winters are relatively mild, whereas the summers are cool. The precipitation is generally high during both the winter and the summer. In Banak, 7 km south of Lakselv, the MAAT is +1.6°C and the MAP is 391 mm/year (1991–2020). At Vardø Radio, c. 100 km east of Karlebotn, the MAAT is +2.5°C and the MAP is 623 mm/year (1991–2020; Norwegian Centre for Climate Services Citation2022).
Figure 2. Images showing the landscape and vegetation at the four sampling sites: (a) Dávva, (b) Riba, (c) Lakselv, and (d) Karlebotn.
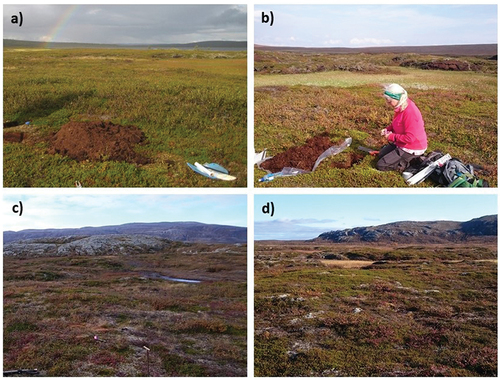
Table 1. General information about the four sampling sites in northern Fennoscandia.
The vegetation on top of the dry peat plateaus and palsas is similar at all four sites and mainly consists of low dwarf shrubs such as Betula nana, Andromeda polifolia, Vaccinium vitis-idaea, V. uliginosum, and Empetrum nigrum ssp. hermaphroditum. Rubus chamaemorus and mosses and lichen, such as Dicranum sp., Polytrichum sp., and Cladonia spp., are also common. Patches with sparse vegetation and exposed peat occur frequently, particularly in wind-exposed areas or where the peat is actively eroding with ongoing block collapse (downward transport of peat blocks from uplifted peat plateaus into thermokarst lakes or collapse fens and bogs as the permafrost thaws). In the surrounding fens and collapse features near the peat plateaus and palsas Carex spp., Eriophorum spp. and Sphagnum mosses are dominating, growing together with, for example, Menyanthes trifoliata and Potentilla palustris.
Methods
Field sampling
Field sampling was performed in late August to early September 2019. Global Positioning System coordinates and field photographs were used so that exactly the same locations could be revisited as described in Kjellman et al. (Citation2018) and Sannel et al. (Citation2018). One peat core (12 × 10 × 46–57 cm) per location was cut out from the active layer by saw 20 to 30 cm away from the former sampling sites. The cores were stored in plastic containers and transported to Stockholm University, where they were kept in a freezer storage. The cores were thawed and cut in ~1-cm-thick slices for the analyses.
AMS radiocarbon dating and age–depth models
Four to six samples from each peat core were submitted for AMS radiocarbon dating at the Tandem Laboratory, Uppsala University. Where possible, terrestrial plant macrofossils (such as Vaccinium spp. leaves, seeds from B. nana and Carex spp., and twigs) were hand-picked for the analyses. Because the degree of decomposition was high in many sections of the profiles, particularly around the transition from fen peat to surface bog peat, bulk fen peat samples had to be submitted for many depths. The majority of roots were removed from the bulk fen peat samples to avoid erroneous dates. We feel confident that these bulk samples accurately represent peat layer ages based on the results of Holmquist et al. (Citation2016), who in a circum-Arctic study found that there is no statistically significant difference between dated bulk peat and terrestrial plant macrofossil samples. The radiocarbon dated samples were initially evenly distributed across the profiles. Additional samples were submitted throughout the project to enhance the temporal resolution around shifts in the botanical sequence. To infer the timing of permafrost aggradation, samples both above and below the contact between fen peat and xerophilic peat were dated, in accordance with Seppälä (Citation2005). The ages were calibrated in OxCal v.4.4 (Bronk Ramsey Citation2021).
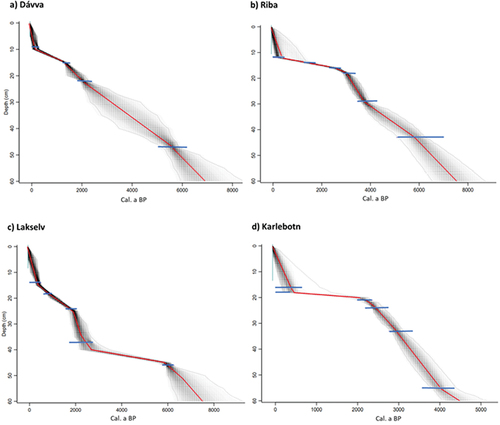
Age–depth models were constructed with Bacon, an application within the open-source statistical environment R i386 v.4.1.2. (Blaauw and Christen Citation2011; R Core Team Citation2018; ). The age–depth models used for the plant macrofossil and geochemical data diagrams () were based on linear interpolation between the mean ages of 2σ calibrated age ranges. For Karlebotn the radiocarbon date at 15.5 cm was excluded from the age–depth model to avoid reversed mean ages. We think this exclusion is appropriate considering that the linear interpolation between 0 and 17.5 cm depth was within the 95 percent probability age range of the dated sample at 15.5 cm depth. Calibrated ages are presented as cal. BP, referring to AD 1950. The surface peat age was set to −69 cal. BP, because the cores were collected in 2019.
Figure 3. Age-depth models for a) Dávva, b) Riba, c) Lakselv and d) Karlebotn. Blue horizontal lines show the sample ages with 95 perfect probability ranges. Darker gray shade indicates more likely calibrated ages, the central red lines show the median age based on the model and the outer dotted gray lines show the 95 percent confidence interval.
Plant macrofossil analysis
Samples of approximately 5 cm3 were analyzed for plant macrofossils every third centimeter following Mauquoy and van Geel (Citation2007). Throughout the analyses, supplementary sample depths were added (every 1–2 cm) around fen to bog transitions to provide higher temporal resolution. Coverage of dark or transparent epidermis, wood, roots, and mosses was estimated as volume percentages. Seeds and leaves were identified, counted, and recalculated to represent a fixed volume of exactly 5 cm3. All plant macrofossils were first analyzed using stereo binoculars, at 6× to 40× magnification. Leaves of Sphagnum (stained with crystal violet) and brown mosses were also examined under a microscope at 100× to 400× magnification for reliable identification to species level. The plant macrofossil identification was based on Mossberg, Stenberg, and Ericsson (Citation1992, Citation2008), Hallingbäck et al. (Citation2006, Citation2008), Birks (Citation2007), Mauquoy and van Geel (Citation2007), Laine et al. (Citation2009, Citation2018), Hedenäs, Reisborg, and Hallingbäck (Citation2014), and Lönnell, Hallingbäck, and Reisborg (Citation2019).
The samples were categorized according to an estimated degree of decomposition, on a scale of 1 to 5, where 1 represents almost intact plant remains and 5, highly degraded, remains difficult to classify. Identified plant macrofossil coverages and counts were plotted using C2 v.1.7.7 (Juggins Citation2014).
Geochemical analyses
Dry bulk density and organic matter
Samples for analyses of dry bulk density and organic matter were assembled by combining 1 cm3 bulk peat from each centimeter depth of the cores into 5 cm3 samples, representing 5 cm depth intervals. Nine samples were prepared for each of the sites Dávva, Riba and Lakselv, and eleven samples from Karlebotn. All samples were weighed, dried at 95°C for 48 hours, and weighed again to calculate dry bulk density. To determine the organic matter (OM) content, the samples were burned at 550°C for 2 hours and weighed again. Because earlier studies by Kjellman et al. (Citation2018) and Sannel et al. (Citation2018) showed that the inorganic carbon content is negligible at the four sites, no additional loss on ignition at higher temperatures was included.
C/N analysis and stable isotopes
To determine the elemental and isotopic organic carbon (C, δ13C) and nitrogen (N, δ15N) content, samples of 0.5 cm3 were cut out from each peat core every third centimeter. The sixty-one samples (fifteen samples from Dávva, fourteen samples each from Riba and Lakselv, and eighteen samples from Karlebotn) were freeze-dried for two days, ground in an agate mortar, and dried at 60°C for 2 hours. The samples were put in tin capsules, weighed (2–3 µg), and shipped to UC Davis Stable Isotope Facility, University of California for analysis in a PDZ Europa ANCA-GSL elemental analyzer interfaced to a PDZ Europa 20–20 isotope ratio mass spectrometer.
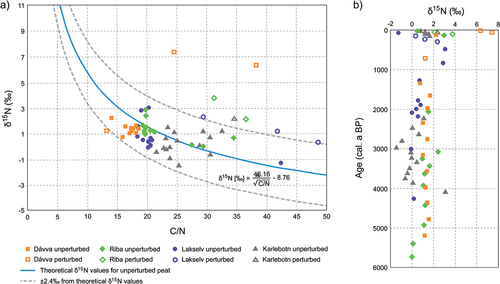
C/N ratios were determined and related to δ15N values to infer peat perturbation as a result of permafrost aggradation, because uplift of peat plateaus and palsas through frost heave likely results in aerobic conditions for decay and thereby a loss of isotopically lighter nitrogen (14N) compared to 15N (Krüger et al. Citation2017). Theoretical δ15N values of unperturbed peat were calculated from the recorded C/N ratios according to the following equation, originally developed for oxic mineral soils (Conen et al. Citation2013) but suggested to be valid also for subarctic organic soils (Krüger et al. Citation2017):
This correlation is used as a baseline for calculating the envelope of uncertainty. Samples for which measured δ15N values deviate more than ±2.4 per mill from the calculated values were defined as perturbed according to Conen et al. (Citation2013).
Results and interpretation
AMS radiocarbon dating and age–depth models
Radiocarbon ages, calibrated age intervals, and mean ages for all four peat profiles are presented in . The Bayesian age–depth models show variable net peat accumulation rates at the study sites since the mid-Holocene (). According to the age–depth model for Karlebotn, the calibrated ages at 15.5 and 17.5 cm depth were within the 95 percent probability age range, although the mean ages at these depths were reversed. Between 17.5 and 20.5 cm depth there was probably a hiatus in this profile because the net peat accumulation was very low, around 0.01 mm/year, between 2200 and 100 cal. BP (, ).
Table 2. AMS radiocarbon dates from the four peat profiles collected in Dávva, Riba, Lakselv, and Karlebotn.
Plant macrofossil analysis
All four study sites showed a similar vegetation succession, with wet fen conditions dominant in the mid-Holocene, followed by a shift toward drier surface conditions in the late Holocene, as indicated by occurrence of mosses such as Polytrichum juniperinum and Dicranum elongatum. This vegetation change has been interpreted as an indication of permafrost aggradation, triggering frost heave and formation of palsas or peat plateaus at all four sites. The degree of decomposition was relatively high throughout the analyzed peat cores and was in many cases found to be particularly high around the transition from fen to bog peat, making the precise distinction between these stratigraphic units difficult. For more detailed information about plant macrofossil assemblages at the study sites, see .
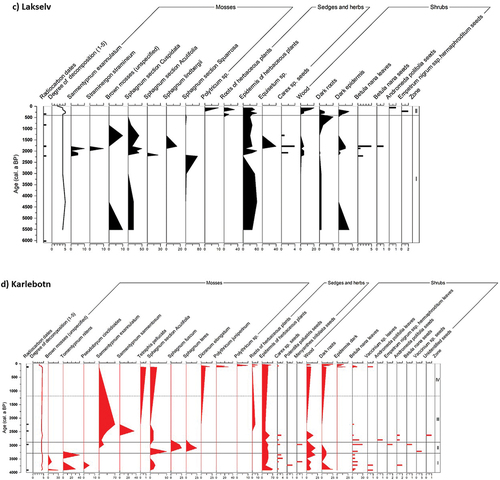
Figure 4. Plant macrofossil diagrams for (a) Dávva, (b) Riba, (c) Lakselv, and (d) Karlebotn. The values represent volume percentages (silhouette contours), except for seeds and leaves, which are presented as counts per 5 cm3 analyzed material (bars). Zone I = fen, Zone II = bog, Zone III = fen, and Zone IV = bog. The dashed line between zones III and IV in (d) is imprecise due to a hiatus in the peat sequence around this depth.
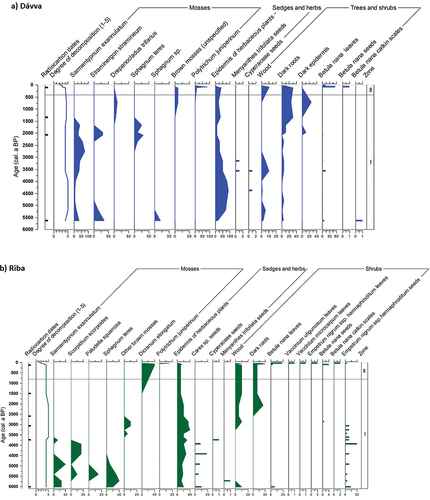
Figure 4. (Continued).
Dávva
Zone I (c. 5600 until c. 400 cal. BP): This zone was characterized by mosses and herbs growing in wet fen environments, such as Sarmentypnum exannulatum, Straminergon stramineum, and seeds of Menyanthes trifoliata and Cyperaceae. Sphagnum teres that occurred around 2500 to 1500 cal. BP suggests eutrophic conditions and was higher up in this zone replaced by Drepanocladus trifarius, indicating lower nutrient levels in the fen.
Zone II (c. 400 cal. BP until present): This zone showed a shift toward species typical of dry bog or peat plateau environments. Close to the present surface Polytrichum juniperinum was dominant and occurred together with dark roots and epidermis of shrubs. Wood and Betula nana leaves were also commonly found in this zone.
Riba
Zone I (c. 6000 until c. 800 cal. BP): From 6000 to 3700 cal. BP the plant macrofossil assemblage mainly comprised species growing in eutrophic and wet fen environments, including mosses such as Sarmentypnum exannulatum, Scorpidium scorpioides, and Sphagnum teres. Seeds from Carex sp. were also frequently found. A relatively high occurrence of Empetrum nigrum ssp. hermaphroditum seeds was recorded during this time period. These seeds have most likely been transported to the sampling site from the nearby surroundings, possibly by winds, because shrubs indicative of dry surface conditions cannot be expected to grow alongside local indicators of wet fen conditions such as the mosses listed above. From around 3700 cal. BP onwards the degree of decomposition was very high, and from around 2800 cal. BP only wood, dark roots, and epidermis of herbaceous plants could be identified.
Zone II (c. 800 cal. BP until present): Dicranum elongatum was found in the plant macrofossil record from around 800 cal. BP, indicating drier surface conditions. The transition between wet fen and bog environments, proposing permafrost aggradation and subsequent frost heave, was difficult to date with high accuracy at this site because of sparse findings of undecomposed material. In the last 250 cal. BP more plant macrofossils could be identified. Close to the present-day surface, Polytrichum juniperinum occurred together with leaves of Vaccinium spp., Empetrum nigrum ssp. hermaphroditum and leaves and seeds of Betula nana, all indicative of dry peat plateau conditions.
Lakselv
Zone I (c. 6000 until c. 400 cal. BP): Throughout this zone there was a high abundance of epidermis from herbaceous plants. Brown mosses (e.g., Sarmentypnum exannulatum and Straminergon stramineum) and Sphagnum mosses (particularly S. section Cuspidata) occurred frequently, all indicating wet fen conditions. Around 2200 cal. BP S. section Acutifolia appeared in the macrofossil record for a short time period, possibly suggesting drier surface conditions (Laine et al. Citation2009). The peak in S. section Acutifolia was followed by abundant occurrence of S. section Cuspidata, including S. lindbergii, which grows in open pools (Laine et al. Citation2009). This botanical sequence in the peat record could possibly suggest permafrost aggradation around 2200 cal. BP followed by rapid thaw and a collapse scar phase. However, because S. section Acutifolia was not so abundant, occurring only for a short period of time and together with Sarmentypnum exannulatum, the signal of dry surface conditions was not so clear. It is just as likely that the occurrence of S. section Acutifolia was a part of the natural succession in the peatland without permafrost being present.
Zone II (c. 400 cal. BP until present): This zone was characterized by a shift in botanical composition toward species growing in dry bog environments. Occurrence of Polytrichum sp., Andromeda polifolia, and Empetrum nigrum ssp. hermaphroditum seeds and dark epidermis and wood has been interpreted to represent the peat plateau phase following permafrost aggradation.
Karlebotn
Zone I (c. 4000 until c. 3300 cal. BP): This zone was dominated by indicators of wet and nutrient-rich fen conditions, such as Tomentypnum nitens, Pseudobryum cinclidioides, and seeds of Carex sp., along with abundant occurrence of epidermis of herbaceous plants.
Zone II (c. 3300 until 2900 cal. BP): The species composition in this zone suggests a shift to drier surface conditions. Brown mosses that were common in the zone below completely disappeared and were replaced by abundant occurrence of Sphagnum fuscum and a distribution peak in S. section Acutifolia. Furthermore, leaves and seeds of dwarf shrubs such as Andromeda polifolia, Empetrum nigrum ssp. hermaphroditum, and Betula nana occurred in large numbers. The dry conditions suggested by the plant macrofossils indicate that permafrost possibly was present in the peatland during this time period.
Zone III (c. 2900 until c. 2200–100 cal. BP): This zone was characterized by abundant occurrence of Sarmentypnum exannulatum and S. sarmentosum, growing submerged in wet pools in fens (Hedenäs, Resinborg, and Hallingbäck Citation2014), suggesting a pronounced shift in the local surface hydrology toward much wetter conditions. This transition could possibly indicate ground subsidence as a result of permafrost thaw and formation of a collapse scar feature with high water table. The upper age limit of this zone was difficult to establish because the age–depth model suggests a hiatus in the peat sequence, and therefore very slow net peat accumulation, between 2200 and 100 cal. BP.
Zone IV (c. 2200–100 cal. BP until present): In the uppermost zone there was an alteration in the vegetation, as indicators of dry surface conditions such as Polytrichum juniperinum, Dicranum elongatum, dark epidermis and roots, and leaves of Betula nana and Vaccinium sp. became dominant. Because the vegetation comprised similar species as at the present-day surface, this zone was interpreted to represent the ombrotrophic peat plateau phase following uplift by frost heave. The exact timing of permafrost aggradation was, however, difficult to determine because of the hiatus.
Geochemical analyses
Dry bulk density and organic matter
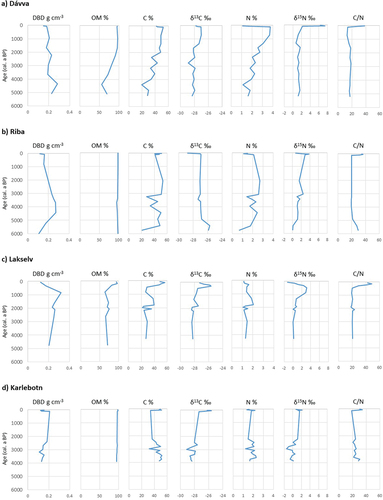
The dry bulk density at the four study sites was between 0.11 and 0.32 g cm−3. The highest value, 0.32 g cm−3, was recorded in Lakselv around 800 cal. BP, probably due to a higher proportion of minerogenic material. During the plant macrofossil analysis, grains of sand were identified in this layer.
The organic matter content varied between 56 and 99 percent. In Riba and Karlebotn the organic matter was ˃95 percent throughout the entire profiles (). The lowest OM (56 percent) was recorded in Dávva around 4400 cal. BP. In Lakselv the OM was generally around 60 to 80 percent throughout the profile, apart from the uppermost two samples where the OM was >90 percent. The lower OM values below the surface layers in Dávva and Lakselv could be explained by a higher fraction of minerogenic material in the cores at these sites.
Figure 5. Geochemical data: Dry bulk density (g cm−3), organic matter content (%), carbon content (%), isotopic carbon signal (‰), nitrogen content (%), isotopic nitrogen signal (‰), and carbon-to-nitrogen ratio in (a) Dávva, (b) Riba, (c) Lakselv, and (d) Karlebotn.
C/N analysis and stable isotopes
The carbon content at the four sites was between 19.4 and 56.2 percent and the nitrogen content was 0.7 to 3.7 percent. The isotopic carbon (δ13C) values ranged between −29.1 and −25.6 per mill, and the isotopic nitrogen (δ15N) values were between −1.4 and 7.4 per mill (). Elemental and isotopic carbon and nitrogen values can vary as a result of changing conditions for decomposition throughout the profile (anaerobic vs. aerobic) or because of shifts in the vegetation type and species composition at different depths (Alewell et al. Citation2011; Treat et al. Citation2016). Turning points (or peaks) in the δ13C and δ15N records were identified at all sites and dated to around 700 to 100 cal. BP, apart from in Riba, which lacked a distinct turning point for δ13C. The C/N ratio at the four sites was 13.2 to 48.6. At all sites, higher C/N ratios were reported from the upper samples. Turning points in the C/N ratios were detected in Riba, Lakselv, and Karlebotn around 100 cal. BP ().
Perturbed samples (indicated by the differ between theoretical and measured δ15N values plotted against recorded C/N ratios, according to Conen et al. Citation2013) were recorded at all four sites in some, but not all, of the upper samples younger than c. 700 cal. BP (). In Riba and Karlebotn, all samples below the δ15N turning point were unperturbed. In Dávva, one perturbed sample was found below the turning point. In Lakselv, the turning point consisted of unperturbed peat samples, and perturbed samples were only found higher up in the peat sequence ().
Figure 6. (a) Correlation between assessed δ15N values and C/N ratios for the four study sites. Unperturbed samples are within the uncertainty range of ±2.4 mill (gray dashed lines) from the theoretical δ15N values (blue solid line), whereas perturbed samples fall outside this range according to the relationship stated by Conen et al. (Citation2013). (b) δ15N values for the four study sites plotted against age. The same relationship as in (a) is applied to identify perturbed samples.
Discussion
Peatland development since the mid-Holocene
The active layer peat cores in this study represent the time since around 6000 cal. BP (4000 cal. BP for Karlebotn). In the mid-Holocene, all four study sites were characterized by species growing in wet fens. The vegetation mainly consisted of mosses such as Sarmentypnum exannulatum and Straminergon stramineum and herbaceous plants, identified through plant macrofossil findings of epidermis and seeds of, for example, Cyperaceae and Menyanthes trifoliata. Site-specific changes in species composition at the study sites throughout the fen stage can be attributed to natural variability and normal peatland succession. A gradual transition from nutrient- and mineral-rich fen conditions toward more intermediate fen conditions, as seen in Dávva, Riba, and Lakselv, can be expected over time in these environments before bog development can take place (e.g., Oksanen, Kuhry, and Alekseeva Citation2001; Oksanen Citation2006). In Lakselv, occurrence of S. section Acutifolia around 2200 cal. BP suggested that the fen stage could partly have been interrupted by somewhat drier surface conditions for a short period of time (). The peatland in Karlebotn showed a different succession in the mid- to late Holocene compared to the other sites. According to the plant macrofossil analysis results, the wet fen stage was interrupted by a period of drier surface conditions around 3300 to 2900 cal. BP, when Sphagnum fuscum and S. section Acutifolia occurred together with abundant findings of Betula nana remains and seeds of other dwarf shrubs (). After 2900 cal. BP, all dry bog environment indicators disappeared in the macrofossil record and were replaced by Sarmentypnum exannulatum and S. sarmentosum, which grow submerged in wet pools in nutrient-poor to intermediate fens (Hedenäs, Resiborg, and Hallingbäck Citation2014).
In the late Holocene, around 800 cal. BP in Riba and around 400 cal. BP in Dávva and Lakselv, there was a distinct shift in the vegetation to species growing in xerophilic bog habitats, including mosses like Polytrichum juniperinum and Dicranum elongatum and shrubs (e.g., Betula nana, Vaccinium spp., and Empetrum nigrum ssp. hermaphroditum; ). The same signal with dry surface indicator species was seen in the upper layers of the peat sequence in Karlebotn. However, because of a hiatus and/or very slow net peat accumulation between 2200 and 100 cal. BP (), there was a lack of material available for radiocarbon dating and therefore it was not possible to infer the exact timing of this vegetation change.
Permafrost development and dynamics
Most earlier studies of permafrost dynamics in Fennoscandian peatlands have suggested that permafrost did not form until during the last 1,000 years as a result of climate cooling during the LIA (Vorren Citation1979; Malmer and Wallén Citation1996; Zuidhoff and Kolstrup Citation2000; Seppälä Citation2005; Oksanen Citation2006; Kokfelt et al. Citation2010; Kjellman et al. Citation2018; Sannel et al. Citation2018; Treat and Jones Citation2018). However, Oksanen (Citation2006) and Kokfelt et al. (Citation2010) also proposed an earlier period of permafrost aggradation in northernmost Finnish and Swedish peatlands around 2600 to 2500 cal. BP. Studies from similar latitudes but c. 1,000 km east of our study sites concluded that permafrost aggradation in East European Russian peatlands probably took place already around 3300 to 3200 cal. BP (Oksanen, Kuhry, and Alekseeva Citation2001; Väliranta, Kaakinen, and Kuhry Citation2003). MacDonald et al. (Citation2006) proposed that neoglacial cooling started in northern Eurasia between 4000 and 3000 cal. BP, and there was a peak in cold and wet conditions in Northern Europe around 3500 cal. BP (Seppä et al. Citation2009). This cold period could explain our findings in Karlebotn, where the plant macrofossil record consisted of Sphagnum fuscum and S. section Acutifolia along with leaves and seeds of Betula nana and seeds of other dwarf shrubs around 3300 to 2900 cal. BP (), indicating dry bog conditions. Because these species can exist both in permafrost-free bogs and on peat plateaus and palsas, it is difficult to establish with certainty whether permafrost was present at the site at this time or not. However, a rapid shift in the peat sequence from a Sphagnum-dominated to a Sarmentypnum-dominated plant community suggests that ground subsidence occurred and that the site experienced a high water table, possibly following permafrost thaw and collapse scar fen formation. If this interpretation is correct, permafrost was likely present in the bog phase around 3300 to 2900 cal. BP. A decrease in N content at this site around 3000 cal. BP further supports this interpretation. On the other hand, a core taken by Kjellman et al. (Citation2018) only 20 to 30 cm away from our core shows a different pattern. Though they found a high occurrence of S. fuscum (around 2200 cal. BP), they did not see signs of ground collapse or saturated surface conditions following the dry bog phase, leading them to conclude that permafrost was not present at this site at that time. In addition, it is difficult to explain why permafrost would have existed in Karlebotn around 3000 cal. BP when it was not found at the Davva and Riba sites, which currently experience around 4°C to 5°C colder MAAT compared to the Karlebotn site.
It has been suggested that multiproxy analyses combining plant macrofossil records, degree of decomposition, and peat geochemistry (including elemental and isotopic C and N data) are most reliable for dating permafrost development in peatlands (Treat and Jones Citation2018). In our study, we used plant macrofossils as the key proxy for determining the timing of permafrost aggradation and verified the results with geochemical proxies. In the late Holocene there was a shift in botanical composition at all four study sites from species growing in wet fens to species characteristic of dry bog environments (). Based on the macrofossil records, we conclude that permafrost developed around 800 cal. BP in Riba and around 400 cal. BP in Dávva and Lakselv. This means that permafrost inception at these three sites possibly took place around 100 to 300 years earlier than previously suggested by Kjellman et al. (Citation2018) and Sannel et al. (Citation2018; see ). Because of a hiatus in Karlebotn between 2200 and 100 cal. BP, our study cannot establish the exact timing of permafrost development at this site, proposed by Kjellman et al. (Citation2018) to have experienced permafrost aggradation around 950 cal. BP. When also using turning points in the δ13C, δ15N, and C/N records for the interpretation, our study implies that permafrost did not develop in Karlebotn until around 100 cal. BP (). Then all four study sites were subject to frost heave c. 800 to 100 cal. BP, which fits well with LIA cooling after 850 cal. BP (Grudd et al. Citation2002) and typical permafrost aggradation in Fennoscandian peatlands after 750 cal. BP (Treat and Jones Citation2018). Lower nitrogen content and higher C/N ratios at all four sites in the uppermost bog peat compared to in the fen peat below () further support permafrost development after the onset of the LIA. The plant macrofossil records and geochemical proxy results generally suggest relatively similar timing of permafrost development (). Some of the inconsistencies can be explained by the fact that turning points (peaks) in the isotopic and C/N records are recorded at specific analyzed sample depths (transferred into ages using age–depth models), whereas for plant macrofossil records the mean age between two analyzed sample depths is used for determining the fen–bog transition timing, often resulting in slightly older dates (, ). Other reasons for variable ages proposed by the different proxies could be that radiocarbon dates have relatively wide uncertainty intervals and that peat archives do not have a very high temporal resolution because of slow net accumulation rates, particularly in the upper aerobic bog peat layers, making exact dating of permafrost aggradation problematic. Still, our results corroborate earlier findings that chemical peat properties (N content, C/N ratio, δ13C and δ15N patterns) can indicate ecosystem type and permafrost aggradation in peatlands (Alewell et al. Citation2011; Krüger, Leifeld, and Alewell Citation2014; Treat et al. Citation2016; Krüger et al. Citation2017). Based on the relationship between δ15N and C/N, perturbed samples indicating permafrost aggradation only occurred in the upper peat layers (), which were identified by the plant macrofossil analysis to have developed into peat plateaus and experienced frost heave. However, not all of the samples at proposed peat plateau ages showed signs of perturbation, and in Dávva perturbed samples also occurred in the upper fen peat (). Because the signal from this method was not always coherent, the relationship between δ15N and C/N should not be used as the only indicator but rather as a supplement to plant macrofossil analysis and other geochemical proxies when interpreting the timing of permafrost aggradation.
Table 3. Timing of LIA permafrost aggradation based on different proxy records.
Although the higher resolution in radiocarbon dating and sample interval and the stable isotope analyses used in our study were valuable for providing more information about permafrost development and dynamics in these subarctic peatlands, it is still difficult to know with certainty whether permafrost was present and to provide precise dating for the aggradation. One obstacle is that there are no distinct differences in species composition between permafrost peatlands and permafrost-free bogs (Oksanen, Kuhry, and Alekseeva Citation2001; Oksanen Citation2006; Sannel and Kuhry Citation2008; Treat and Jones Citation2018). Another important problem is the uncertainty ranges in the radiocarbon dating and in the age–depth models. Furthermore, it is difficult to know which proxy to trust when different methods suggest different ages for permafrost development, particularly when the proposed ages are outside the uncertainty ranges of the radiocarbon dates. In our study, we also encountered problems because of a high degree of decomposition at all four sites (). Although attempts were made to date samples just above and below the fen–bog transition, as proposed by Seppälä (Citation2005), this was not always possible because the high degree of decomposition made it difficult to find good plant macrofossils for radiocarbon dating and because of very slow net peat accumulation around the transition. The latter was particularly evident at Karlebotn, where the age–depth model showed that there was probably a hiatus between 2200 and 100 cal. BP (). Interrupted sequences around permafrost aggradation depths have also been reported by Seppälä (Citation2005) and Sannel et al. (Citation2018). Seppälä (Citation2005) suggested that wind abrasion after frost heave is the main reason for missing peat layers. In addition, the uplift results in a shift from saturated anaerobic to dry aerobic surface conditions, which can allow more extensive decay in the upper peat following permafrost aggradation and thereby lower peat accumulation rates.
Conclusions
This study provides high-resolution analyses of plant macrofossil assemblages and geochemical parameters in the active layer at four permafrost peatlands in northern Fennoscandia, demonstrating that
In the mid-Holocene, all four study sites were wet fens without permafrost.
In Karlebotn the vegetation succession displayed a period of dry bog conditions between 3300 and 2900 cal. BP, followed by a rapid shift toward species growing in waterlogged fens or open pools. Although this botanical sequence suggests that permafrost possibly was present in the bog around 3000 cal. BP, before it thawed and was replaced by thermokarst and saturated conditions, there is no absolute evidence of permafrost occurrence at this time.
A shift in vegetation toward bog species, indicative of permafrost aggradation and peat plateau or palsa formation, was recorded at all sites and was dated to c. 800–400 cal. BP at three of the sites, coinciding with the LIA. Turning points in the stable isotope (δ13C and δ15N) records and high C/N ratios in the uppermost peat layers further support that permafrost development and frost heave took place at all sites during the LIA.
To further improve our understanding of permafrost dynamics in northern Fennoscandian peatlands, particularly after the neoglacial cooling, more studies are needed. A better knowledge of permafrost dynamics during the Holocene and its implications for the carbon lability upon thawing is also important for projecting future carbon emissions from subarctic peatlands.
Data availability
Data is available in the Bolin Centre Database: https://bolin.su.se/data/.
Acknowledgments
Dr. Claire Treat and an anonymous reviewer provided valuable comments that improved the article. We also thank Dr. Lars Hedenäs at The Swedish Museum of Natural History for valuable assistance with identification of mosses, Dr. Simon Larsson at Stockholm University for assistance with the age–depth model, and Freya Sykes, Brittany Tarbier, and Professor Stefan Wastegård, Stockholm University, for assistance during field sampling.
Disclosure statement
No potential conflict of interest was reported by the authors.
Additional information
Funding
References
- Åkerman, J., and M. Johansson. 2008. Thawing permafrost and thicker active layers in sub-Arctic Sweden. Permafrost and Periglacial Processes 19, no. 3: 279–17. doi:10.1002/ppp.626.
- Alewell, C., R. Giesler, J. Klaminder, J. Leifeld, and M. Rollog. 2011. Stable carbon isotopes as indicators for environmental change in palsa peats. Biogeosciences 8: 1769–78. doi:10.5194/bg-8-1769-2011.
- Birks, H. H. 2007. Plant macrofossil introduction. In Encyclopedia of Quaternary science, and S. A. Elias, vol. 3, 2266–88. Amsterdam: Elsevier.
- Blaauw, M., and J. A. Christen. 2011. Flexible paleoclimate age-depth models using an autoregressive gamma process. Bayesian Analysis 6, no. 3: 457–74. doi:10.1214/11-BA618.
- Borge, A. F., S. Westermann, I. Solheim, and B. Etzelmüller. 2017. Strong degradation of palsas and peat plateaus in northern Norway during the last 60 years. The Cryosphere 11, no. 1: 1–16. doi:10.5194/tc-11-1-2017.
- Bronk Ramsey, C. 2021. OxCal version 4.4 (Computer program). University of Oxford Radiocarbon Accelerator Unit. https://c14.arch.ox.ac.uk/oxcal.html.
- Conen, F., M. V. Yakutin, N. Carle, and C. Alewell. 2013. δ15N natural abundance may directly disclose perturbed soil when related to C:N ratio. Rapid Communications in Mass Spectrometry 27, no. 10: 1101–4. doi:10.1002/rcm.6552.
- d-maps.com. 2022. Scandinavian arctic. https://d-maps.com/pays.php?num_pay=3759&lang=en.
- Geological Survey of Norway. 2020. Løsmassekart. Quaternary Deposit Map. https://www.ngu.no/emne/kvartærgeologiske-kart-løsmassekart.
- Gisnås, K., B. Etzelmüller, C. Lussana, J. Hjort, A. B. K. Sannel, K. Isaksen, S. Westermann, et al. 2017. Permafrost map for Norway, Sweden and Finland. Permafrost and Periglacial Processes 28: 359–78. doi:10.1002/ppp.1922.
- Grudd, H., K. R. Briffa, W. Karlén, T. S. Bartholin, P. D. Jones, and B. Kromer. 2002. A 7400-year tree-ring chronology in northern Swedish Lapland: Natural climatic variability expressed on annual to millennial timescales. The Holocene 12, no. 6: 657–65. doi:10.1191/0959683602hl578rp.
- Hallingbäck, T., N. Lönnell, H. Weibull, L. Hedenäs, and P. von Knorring. 2006. Nationalnyckeln till Sveriges flora och fauna. Bladmossor: Sköldmossor – Blåmossor. Bryophyta: Anoectangium – Orthodontium. Uppsala: ArtDatabanken, SLU.
- Hallingbäck, T., N. Lönnell, H. Weibull, L. Hedenäs, P. von Knorring, M. Korotynska, C. Reisborg, and M. Birgersson. 2008. Nationalnyckeln till Sveriges flora och fauna. Bladmossor: Kompaktmossor – kapmossor. Bryophyta: Buxbaumia – Leucobryum. Uppsala: ArtDatabanken, SLU.
- Hedenäs, L., C. Reisborg, and T. Hallingbäck. 2014. Nationalnyckeln till Sveriges flora och fauna. Bladmossor: Skirmossor – baronmossor. Bryophyta: Hookeria – Anomodon. Uppsala: ArtDatabanken, SLU.
- Holmquist, J. R., S. A. Finkelstein, M. Garneau, C. Massa, Z. Yu, and G. M. MacDonald. 2016. A comparison of radiocarbon ages derived from bulk peat and selected plant macrofossils in basal peat cores from circum-Arctic peatlands. Quaternary Geochronology 31: 53–61. doi:10.1016/j.quageo.2015.10.003.
- Hugelius, G., J. Loisel, S. Chadburn, R. B. Jackson, M. C. Jones, G. MacDonald, M. Marushchak, et al. 2020. Large stocks of peatland carbon and nitrogen are vulnerable to permafrost thaw. Proceedings of the National Academy of Sciences 117, no. 34: 20438–46. doi:10.1073/pnas.1916387117.
- Ivanova, N. V., I. L. Kuznetsova, I. S. Parmuzin, F. M. Rivkin, and V. A. Sorokovikov. 2011. Geocryological conditions in Swedish Lapland. Proceedings of the 4th Russian Conference on Geocryology, 7–9 June 2011, Moscow State University, 77–82, Moscow, Russia.
- Johansson, M., J. Åkerman, F. Keuper, T. R. Christensen, H. Lantuit, and T. V. Callaghan. 2011. Past and present permafrost temperatures in the Abisko area: Redrilling of boreholes. Ambio 40, no. 6: 558–65. doi:10.1007/s13280-011-0163-3.
- Juggins, S. 2014. C2 version 1.7.7. Software for ecological and palaeoecological data analysis and visualisation. Newcastle upon Tyne, UK: Newcastle University.
- Kjellman, S. E., P. E. Axelsson, B. Etzelmüller, S. Westermann, and A. B. K. Sannel. 2018. Holocene development of subarctic permafrost peatlands in Finnmark, northern Norway. The Holocene 28: 1855–69. doi:10.1177/0959683618798126.
- Kokfelt, U., N. Reuss, E. Struyf, M. Sonesson, M. Rundgren, G. Skog, P. Rosén, and D. Hammarlund. 2010. Wetland development, permafrost history and nutrient cycling inferred from late Holocene peat and lake sediment records in subarctic Sweden. Journal of Paleolimnology 44, no. 1: 327–42. doi:10.1007/s10933-010-9406-8.
- Krüger, J. P., F. Conen, J. Leifeld, and C. Alewell. 2017. Palsa uplift identified by stable isotope depth profiles and relation of δ15N to C/N ratio. Permafrost and Periglacial Processes 28: 485–92. doi:10.1002/ppp.1936.
- Krüger, J. P., J. Leifeld, and C. Alewell. 2014. Degradation changes stable carbon isotope depth profiles in palsa peatlands. Biogeosciences 11: 3369–80. doi:10.5194/bg-11-3369-2014.
- Kuhry, P., and D. H. Vitt. 1996. Fossil carbon/nitrogen ratios as a measure of peat decomposition. Ecology 77, no. 1: 271–5. doi:10.2307/2265676.
- Laine, J., K. I. Flatberg, P. Harju, T. Timonen, A. Laine, E.-S. Tuittila, K. Minkkinen, and H. Vasander. 2018. Sphagnum mosses – The stars of European mires. Helsinki: University of Helsinki, Department of Forest Sciences.
- Laine, J., P. Harju, T. Timonen, A. Laine, E.-S. Tuittila, K. Minkkinen, and H. Vasander. 2009. The intricate beauty of Sphagnum Mosses – A Finnish guide to identification. Helsinki: University of Helsinki, Department of Forest Ecology.
- Lee, J.-Y., J. Marotzke, G. Bala, L. Cao, S. Corti, J. P. Dunne, F. Engelbrecht, et al. 2021. Future global climate: Scenario-based projections and near-term information. In Climate change 2021: The physical science basis. Contribution of Working Group I to the Sixth Assessment Report of the Intergovernmental Panel on Climate Change, ed. V. Masson-Delmotte, P. Zhai, A. Pirani, S. L. Connors, C. Péan, S. Berger, N. Caud, et al., 553–672. United Kingdom and New York: Cambridge University Press. doi:10.1017/9781009157896.006.
- Loisel, J., Z. Yu, D. W. Beilman, P. Camill, J. Alm, M. J. Amesbury, D. Anderson, et al. 2014. A database and synthesis of northern peatland soil properties and Holocene carbon and nitrogen accumulation. The Holocene 9: 1028–42. doi:10.1177/0959683614538073.
- Lönnell, N., T. Hallingbäck, and C. Reisborg. 2019. Nationalnyckeln till Sveriges flora och fauna. Bladmossor: Vitmossor – Knappnålsmossor. Bryophyta: Sphagnum – Tetrodontium. Uppsala: ArtDatabanken, SLU.
- MacDonald, G. M., D. W. Beilman, K. V. Kremenetski, Y. Sheng, L. C. Smith, and A. A. Velichko. 2006. Rapid early development of circumarctic peatlands and atmospheric CH4 and CO2 variations. Science 314: 285–8. doi:10.1126/science.1131722.
- Malmer, N., and B. Wallén. 1996. Peat formation and mass balance in subarctic ombrotrophic peatlands around Abisko, northern Scandinavia. Ecological Bulletins 45: 79–92.
- Mauquoy, D., B. van Geel. 2007. Mire and peat macros. In Encyclopedia of Quaternary science, and S. A. Elias, vol. 3, 2315–36. Amsterdam: Elsevier.
- Mossberg, B., L. Stenberg, and S. Ericsson. 1992. Den Nordiska Floran. Turnhout: Wahlström & Widstrand.
- Mossberg, B., L. Stenberg, and S. Ericsson. 2008. Fjällflora. Värnamo: Wahlström & Widstrand.
- Norwegian Centre for Climate Services. 2022. Observations and weather statistics. https://seklima.met.no/observations/.
- Oksanen, P. O. 2006. Holocene development of the Vaisjeäggi palsa mire, Finnish Lapland. Boreas 35, no. 1: 81–95. doi:10.1080/03009480500359103.
- Oksanen, P. O., P. Kuhry, and R. N. Alekseeva. 2001. Holocene development of the Rogovaya River peat plateau, European Russian Arctic. Holocene 11, no. 1: 25–40. doi:10.1191/095968301675477157.
- Olefeldt, D., L. Heffernan, M. C. Jones, A. B. K. Sannel, C. C. Treat, and M. R. Turetsky. 2021. Permafrost thaw in northern peatlands: Rapid changes in ecosystem and landscape functions. In Ecosystem collapse and climate change, ed. J. G. Canadell and R. B. Jackson, 27–67. Switzerland: Springer Nature.
- Olvmo, M., B. Holmer, S. Thorsson, H. Reese, and F. Lindberg. 2020. Sub-Arctic palsa degradation and the role of climatic drivers in the largest coherent palsa mire complex in Sweden (Vissátvuopmi), 1955–2016. Scientific Reports 10: 8937. doi:10.1038/s41598-020-65719-1.
- R Core Team. 2018. R: A language and environment for statistical computing. Vienna, Austria: R Foundation for Statistical Computing. https://www.R-project.org/.
- Sannel, A. B. K. 2020. Ground temperature and snow depth variability within a subarctic peat plateau landscape. Permafrost and Periglacial Processes 31: 255–63. doi:10.1002/ppp.2045.
- Sannel, A. B. K., L. Hempel, A. Kessler, and V. Prėskienis. 2018. Holocene development and permafrost history in sub-Arctic peatlands in Tavvavuoma, northern Sweden. Boreas 47: 454–68. doi:10.1111/bor.12276.
- Sannel, A. B. K., G. Hugelius, P. Jansson, and P. Kuhry. 2016. Permafrost warming in a subarctic peatland – Which meteorological controls are most important? Permafrost and Periglacial Processes 27: 177–88. doi:10.1002/ppp.1862.
- Sannel, A. B. K., and P. Kuhry. 2008. Long-term stability of permafrost in subarctic peat plateaus, west-central Canada. The Holocene 18, no. 4: 589–601. doi:10.1177/0959683608089658.
- Sannel, A. B. K., and P. Kuhry. 2009. Holocene peat growth and decay dynamics in sub-Arctic peat plateaus, west-central Canada. Boreas 38: 13–24. doi:10.1111/j.1502-3885.2008.00048.x.
- Sannel, A. B. K., and P. Kuhry. 2011. Warming-induced destabilization of peat plateau/thermokarst lake complexes. Journal of Geophysical Research – Biogeosciences 116: G03035. doi:10.1029/2010JG001635.
- Schuur, E. A. G., R. Bracho, G. Celis, E. F. Belshe, C. Ebert, J. Ledman, M. Mauritz, et al. 2021. Tundra underlain by thawing permafrost persistently emits carbon to the atmosphere over 15 years of measurements. Journal of Geophysical Research – Biogeosciences 126. doi:10.1029/2020JG006044.
- Schuur, E. A. G., A. D. McGuire, C. Schädel, G. Grosse, J. W. Harden, D. J. Hayes, G. Hugelius, et al. 2015. Climate change and the permafrost carbon feedback. Nature 520: 171–9. doi:10.1038/nature14338.
- Seppä, H., A. E. Bjune, R. J. Telford, H. J. B. Birks, and S. Veski. 2009. Last nine-thousand years of temperature variability in Northern Europe. Climate of the Past 5: 523–35. doi:10.5194/cp-5-523-2009.
- Seppälä, M. 2011. Synthesis of studies of palsa formation underlining the importance of local environmental and physical characteristics. Quaternary Research 75, no. 2: 366–70. doi:10.1016/j.yqres.2010.09.007.
- Seppälä, M. 2005. Dating of palsas. In Quaternary studies in the northern and Arctic regions of Finland: Proceedings of the workshop organized within the Finnish national committee for quaternary research (INQUA), ed. A. E. K. Ojala (Special Paper 40, Kilpisjärvi Biological Research Station, Finland, 13–14 January), 79–84. Espoo: Geological Survey of Finland.
- Stroeven, A. P., C. Hättestrand, J. Kleman, J. Heyman, D. Fabel, O. Fredin, B. W. Goodfellow, et al. 2016. Deglaciation of Fennoscandia. Quaternary Science Reviews 147: 91–121.
- Swedish Meteorological and Hydrological Institute. 2022. Data series with normal values for the period 1991–2020. https://www.smhi.se/data/meteorologi/dataserier-med-normalvarden-for-perioden-1991-2020-1.167775.
- Treat, C. C., and M. C. Jones. 2018. Near-surface permafrost aggradation in Northern Hemisphere peatlands shows regional and global trends during the past 6000 years. The Holocene 28, no. 6: 998–1010. doi:10.1177/0959683617752858.
- Treat, C. C., M. C. Jones, P. Camill, A. Gallego-Sala, M. Garneau, E. S. Klein, U. Kokfelt, et al. 2016. Effects of permafrost aggradation on peat properties as determined from a pan-Arctic synthesis of plant macrofossils. Journal of Geophysical Research – Biogeosciences 121: 78–94. doi:10.1002/2015JG003061.
- Turetsky, M. R., B. W. Abbott, M. C. Jones, K. Walter Anthony, D. Olefeldt, E. A. G. Schuur, G. Grosse, et al. 2020. Carbon release through abrupt permafrost thaw. Nature Geoscience 13: 138–43. doi:10.1038/s41561-019-0526-0.
- Ulfstedt, A.-C. 1982. Geomorphological maps 32J Treriksröset, 32K Kummavuopio, 31J Rastojaure, 31K Naimakka – Description and assessment of areas of geomorphological importance. Rapport SNV pm 1555. Stockholm: Naturvårdsverket.
- Väliranta, M., A. Kaakinen, and P. Kuhry. 2003. Holocene climate and landscape evolution east of the Pechora Delta, East-European Russian Arctic. Quaternary Research 59, no. 3: 335–44. doi:10.1016/S0033-5894(03)00041-3.
- Vardy, S. R., B. G. Warner, J. Turunen, and R. Aravena. 2000. Carbon accumulation in permafrost peatlands in the Northwest Territories and Nunavut, Canada. The Holocene 10: 273–80. doi:10.1191/095968300671749538.
- Vorren, K.-D. 1979. Recent palsa datings, a brief survey. Norsk Geografisk Tidsskrift 33, no. 4: 217–20. doi:10.1080/00291957908552057.
- Yu, Z., J. Loisel, D. P. Brosseau, D. W. Beilman, and S. J. Hunt. 2010. Global peatland dynamics since the Last Glacial Maximum. Geophysical Research Letters 37: L13402. doi:10.1029/2010GL043584.
- Zhang, T. 2005. Influence of the seasonal snow cover on the ground thermal regime: An overview. Reviews of Geophysics 43, no. 4: RG4002. doi:10.1029/2004RG000157.
- Zoltai, S. C. 1993. Cyclic development of permafrost in the peatlands of Northwestern Alberta, Canada. Arctic and Alpine Research 25, no. 3: 240–6. doi:10.2307/1551820.
- Zuidhoff, F., and E. Kolstrup. 2000. Changes in palsa distribution in relation to climate change in Laivadalen, Northern Sweden, especially 1960-1997. Permafrost and Periglacial Processes 11: 55–69. doi:10.1002/(SICI)1099-1530(200001/03)11:1<55::AID-PPP338>3.0.CO;2-T.