
ABSTRACT
We explored patterns of benthic diatom composition across sixty-two high-elevation alpine lakes spanning a wide range of nitrogen (N) concentrations due to atmospheric deposition and background variation in lake and watershed characteristics. Our goals were to (1) assess the effect of lake water N concentration on benthic diatom composition during late summer or fall conditions and (2) identify policy-relevant response thresholds. The analyses were carried out on a large set of diatom and water chemistry data, integrated with new data. Multivariate and correlation analyses revealed associations between pH, N concentration, and benthic diatom composition, but the effects of pH and N were confounded. However, partial correlation analysis allowed us to identify “N-responsive diatoms”; that is, diatom taxa with nonspurious associations with N. Focusing on these taxa, we detected a decline in the abundance of taxa preferring low N concentrations and an increase in the abundance of taxa preferring high N concentrations starting at NO3 concentrations of approximately 5 µmol L−1. We interpreted this shift as an effect of watershed N saturation due to atmospheric deposition. Based on the results, we suggest a late-summer or fall concentration threshold of 5 µmol NO3 L−1 to prevent change in benthic diatoms in high-elevation alpine lakes.
Introduction
A mid-twentieth-century acceleration of human activities started the era of global change, in which human-induced ecological change spread to the planetary scale. Global change is often understood as climate change, but it is a multidimensional concept that includes all human pressures whose footprint extends across the world, including atmospheric deposition, urbanization, and plastic pollution. The alteration of the global nitrogen (N) cycle is a key component of global change. Nitrogen frequently is a limiting nutrient in marine, terrestrial, and freshwater ecosystems, because its biological demand tends to exceed the natural supply (Vitousek and Howarth Citation1991; Elser et al. Citation2007). However, human activities including combustion of fossil fuels and use of fertilizers have caused exponential increases in N emissions and atmospheric N deposition (Galloway et al. Citation2003, Citation2004; Holtgrieve et al. Citation2011). For example, current rates of N deposition have been estimated to be up to an order of magnitude higher than preindustrial levels (i.e., more than 10 kg ha−1 yr−1 versus a preindustrial reference of 0.4–0.7 kg ha−1 yr−1; Holland et al. Citation1999). This vastly higher supply via atmospheric deposition can influence primary production and competitive interactions among species, ultimately changing the structures and functions of the recipient ecosystems (Pardo et al. Citation2011).
Among freshwater ecosystems, high-elevation (above treeline) lakes are regarded as sensitive sentinels of N atmospheric deposition (e.g., Lafrancois et al. Citation2004; Nydick et al. Citation2004; Lepori and Robin Citation2014; Meunier et al. Citation2016; Moser et al. Citation2019). High-elevation lakes are sensitive to N enrichment because they tend to be naturally N deficient (indicated by low N concentrations and low N:P ratios; Elser et al. Citation2009; Williams et al. Citation2016). In addition, these lakes are surrounded by scarcely developed and sparsely vegetated soils that have little capacity for N uptake (Baron et al. Citation1994; Bowman and Steltzer Citation1998). Consequently, even low levels of N atmospheric deposition can substantially increase the amount of N leaching into these lakes (Baron et al. Citation2011). Nitrogen leaching increases N availability to lake biota and shifts N:P ratios toward higher values (Elser et al. Citation2009). These chemical changes, in turn, trigger far-reaching biotic responses, especially among primary producers, comprising increased biomass, shifts in species composition, and changes in seasonal development (Lafrancois et al. Citation2004; Nydick et al. Citation2004; Lepori and Robin Citation2014).
Policy strategies to protect high-elevation lakes from N atmospheric deposition require knowledge of the biotic effects. Thresholds associated with these effects are particularly valuable because they could be used to estimate critical loads; that is, the N deposition level below which harmful effects are unlikely (Nilsson and Grennfelt Citation1988). Diatoms, a large group of algae in the class Bacillariophyceae, are useful indicator organisms to investigate nutrient-enriching effects because they have specific optima and tolerances along gradients of nutrient concentrations (Winter and Duthie Citation2000; Smol and Stoermer Citation2010). So far, most research on the effects of N atmospheric deposition on lake diatoms has focused on planktonic forms (Wolfe, Baron, and Cornett Citation2001; Saros et al. Citation2003; Lafrancois et al. Citation2004; Nydick et al. Citation2004; Baron Citation2006; Thies et al. Citation2012; Tolotti et al. Citation2012; Williams et al. Citation2016). Research from the Western United States has shown that certain planktonic species, especially Asterionella formosa Hassall and Fragilaria crotonensis Kitton, respond positively to N enrichment and serve as N-indicator taxa (Wolfe, Baron, and Cornett Citation2001; Saros et al. Citation2005).
In comparison, studies on the response of lake benthic diatoms to N enrichment are rare. The apparent neglect of this group is perplexing, but it may be related to the view that benthic algae are less sensitive to nutrient inputs than planktonic algae (Spaulding et al. Citation2015). Yet, in apparent contrast with this view, benthic diatoms are routinely used as indicators of phosphorus enrichment in lakes and rivers (Kelly et al. Citation1998; Bennion et al. Citation2014). In addition, research from streams and coastal systems indicates that some benthic diatoms respond predictably to N enrichment (Keithan, Lowe, and DeYoe Citation1988; Kafouris et al. Citation2019). Explorations of the response of high-elevation benthic diatoms to N enrichment could thus confirm their sensitivity and lay the foundations for their use as N indicators in future research and monitoring. The use of benthic diatoms as indicators would be particularly useful in high-elevation lakes of the European Alps, where planktonic diatoms tend to be scarce (Tolotti Citation2001; Tolotti et al. Citation2006, Citation2009) and, where more abundant, typically lack N-indicator taxa (Rühland, Paterson, and Smol Citation2015).
In high-elevation catchments with low buffering capacity, atmospheric deposition of nitrogen causes not only nutrient enrichment but also water acidification (Smol and Stoermer Citation2010; Lepori and Keck Citation2012). In this study, we focused on the effects on N as a nutrient because the effects of acidification have been comparatively studied more (e.g., Charles et al. Citation1990; Cameron et al. Citation1999; Kawecka and Galas Citation2003; Battarbee et al. Citation2005; Catalan et al. Citation2013). In addition, during the last decades, water acidification (which is caused not only by nitrogen deposition but also by sulfur deposition) has largely been reversed across the Northern Hemisphere thanks to reductions in S emissions (Nopmongcol et al. Citation2019; Forsius et al. Citation2021; Yamaga et al. Citation2021). N emissions and deposition have declined to a lesser degree. For example, between 1990 and 2015, in European forested research watersheds included in the International Cooperative Programme on Integrated Monitoring, the bulk deposition of sulfate declined more than twice as fast than that of nitrate and ammonium (–0.08 meq m–2 yr–1 versus −0.03 meq m–2 yr–1; Vuorenmaa et al. Citation2018). Therefore, the nutrient-enriching effect of N remains current and is even projected to increase globally due to higher N emissions (Galloway et al. Citation2004).
We used an existing data set (Marchetto et al. Citation2021), which we integrated with new data, to examine patterns of benthic diatoms in high-elevation alpine lakes spanning a wide range of N concentrations due to atmospheric deposition and background geographical variation. We asked whether we could (1) detect a response of diatoms to N and (2) identify policy-relevant response thresholds. The data set included water chemistry and benthic diatom data from sixty-two high-elevation lakes located in the European Alps sampled between 2000 and 2021. We examined the lakes’ N status by comparing their nitrate (NO3) and total nitrogen (TN) concentrations against literature-based benchmarks. Next, we investigated the association between nitrogen concentration and diatom community composition using multivariate analyses. Additionally, we identified N-responsive taxa (taxa strongly associated with N status) and examined their specific response, which is potentially more sensitive to N enrichment and less influenced by N-unrelated environmental variation. Based on the results, we discuss guidelines for protecting high-elevation lakes from N enrichment due to atmospheric deposition or other sources.
Methods
Study area and lakes
Based on data availability, we focused on sixty-two small (average area: 9 ha) high-elevation alpine lakes spanning the Central and Central-Eastern Alps across Italy, Switzerland, and Austria (, Table S1, ). The lakes are distributed into two longitudinal clusters, one central and one relatively eastern. Within these clusters, the lakes’ location further differs depending on which slope of the Alps they lie on (north or south slope), forming four groups of closely located lakes: The central north group, the central south group, the eastern north group, and the eastern south group. We used these groups (referred to by the acronyms CN, CS, EN, ES) to indicate the geographical position of the lakes within the Alpine region. These groups further differed by basin, country, and exposure to N emission, as indicated in and .
Figure 1. Geographical position of the study lakes (see Table S1 for coordinates). The colors represent the cumulative total N deposition for the period 1880 to 2020 (from Forsius et al. Citation2021).
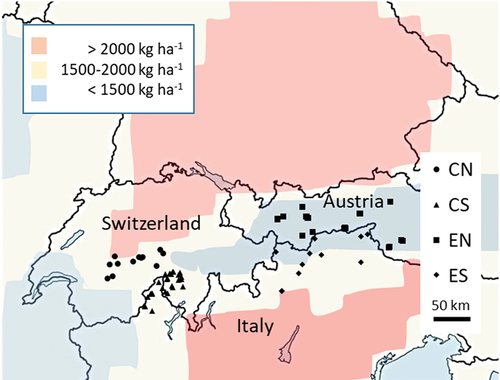
Table 1. Geographical, physical, and chemical characteristics of the study sites, by geographical group (see text).
The lakes are located above the treeline at elevations ranging from approximately 1,600 to 2,800 m.a.s.l. (). At the time of sampling, land cover was dominated by “bare ground” (rock and scree habitats) and “meadow” (mountain grassland), which, together, covered nearly 90 percent of the watersheds. The bedrock geology is predominantly composed by noncarbonate rocks (i.e., metamorphic, plutonic, volcanic, or detrital rocks), but extensive amounts of carbonate rocks occur in some watersheds of all groups except EN. Lake water composition showed relatively high variation in nitrogen concentration (NO3 range = 1–36 µeq L−1, average, 14 µeq L−1) and pH (range: 5.3–9.0, average: 7.1) versus a narrower range of phosphorus concentrations (range = 1–16 µg L−1, average, 4 µg L−1). Water transparency (Secchi depth), available for a subset of thirty-two lakes, ranged between 2 and 30 m (average, 8 m).
Direct anthropogenic disturbances within the watershed were limited to tourism (hiking), fish introductions, and grazing by domestic livestock in summer. No lake received sewage or mineral fertilizers. We assume that the main source of N was atmospheric deposition, which in the Alps is severe, locally exceeding 20 kg N ha−1 yr−1 (Rogora, Arisci, and Marchetto Citation2012; Rihm and Künzle Citation2023). For example, in 2014, across the Swiss Alps, N deposition ranged between 4.7 and 26.7 kg ha−1 (Kosonen et al. Citation2019). The atmospheric origin of surface water N in the Alps is supported by previously observed correlations between surface water N concentration and N deposition (Lepori, Barbieri, and Ormerod Citation2003) and between N deposition and exposure to emission sources (Della Lucia et al. Citation1996; Rogora et al. Citation2016; Kosonen et al. Citation2019). Other airborne pollutants affecting the lakes included sulfur, persistent organic compounds, and heavy metals (Marchetto et al. Citation2021).
Data sources
The main data source (for fifty-nine lakes) was the recently published data set of the research program EMERGE (“European Mountain lake Ecosystems: Regionalisation, diaGnostic & socio-economic Evaluation”; Marchetto et al. Citation2021). The EMERGE data set includes environmental and biological data collected in the year 2000. To this set we added data from one Swiss lake (Lago Leit, CS group) sampled in 2021 and two Italian lakes (Lago Scuro di Mandrone and Pozza del Maroccaro, ES group) sampled in 2018 and 2021. All samples were collected in late summer or early autumn (August–September), after the spring–summer snowmelt period, according to common protocols (Marchetto et al. Citation2021). Diatom nomenclature was updated and homogenized across sets based on the global algal database AlgaeBase (algaebase.org).
Water samples were collected at the lake surface, either above the deepest point of the lake (EMERGE lakes) or near shore (other lakes); therefore, they represent conditions in the surface, well-mixed lake layer (epilimnion). Benthic diatoms were collected from cobbles in shallow littoral areas (less than 1 m deep). Marchetto et al. (Citation2021) provided further details on the sampling and processing methods.
Nitrogen status
The analysis of lake N status focused primarily on NO3 concentration because this variable is a common currency in research on N enrichment in mountain lakes, facilitating between-study comparisons (Baron et al. Citation2011). We used a threshold of 5 µmol NO3 L−1 to classify lakes as minimally N enriched or N enriched (we assumed that there are no uncontaminated lakes in the Alps). This threshold is based on a saturation model according to which, in streams and lakes, substantial NO3 concentrations (i.e., > 5 µmol L−1) during low flows are a symptom of N saturation (Van Migroet Citation1994). We used analysis of variance to test whether NO3 concentrations differed significantly among geographical groups CN, CS, EN, and ES.
In addition, we examined lake water concentrations of total N (TN), which were available for fifty-six lakes: Concentrations were not available for two of the sixty-two lakes; for another four lakes, the TN concentrations reported were considered potential outliers because they were unusually high relative to NO3. A case for using TN instead of NO3 is that TN may better represent the total availability of nitrogen to algae throughout the growing season, from ice-out in early summer to fall, assuming that NO3 is progressively taken up by plankton and is integrated in the TN pool. Using empirical models, Smith, Alexander, and Schwarz (Citation2003) estimated that the median “background” TN concentration in streams and rivers of the United States is 0.14 mg N L−1. We used this value as an additional heuristic reference (in addition to the NO3 criterion) to evaluate the N status of the lakes.
Finally, for a subset of lakes with data (n = 48), we examined the relationship between lake water NO3 and the dissolved inorganic nitrogen:total phosphorus (DIN:TP) mass ratio (NO3 + NH4). The DIN:TP mass ratio has been shown to be a good predictor of nutrient limitation, with values < 1.5 indicating N limitation and values > 3.4 indicating P limitation (Morris and Lewis Citation1988; Bergström Citation2010).
Diatom analysis
We used an indirect gradient analysis to explore the effects on N on benthic diatom community composition in the study lakes. We ran a principal coordinate analysis (PCoA) to extract the main compositional patterns across the data set. In a second step, we used correlation analysis (Pearson’s r) to examine the relationships between these patterns and a set of environmental variables (namely, NO3 and TN concentration, the indicators of N status; elevation, a proxy for lake surface water temperature [Livingstone, Lotter, and Walkery Citation1999]; and pH; i.e., acid–base status). LOESS lines (locally estimated scatterplot smoothing) were fitted to explore the shape of the patterns between principal coordinates (PCos) and environmental variables (an attempt to use multiple regression was abandoned due to the nonlinear pattern of PCo1 versus pH; additionally, the pattern could not be linearized using common transformation methods). PCoA was performed on a matrix of Hellinger distances; that is, the Euclidean distances of Hellinger-transformed data (Legendre and Gallagher Citation2001). Prior to the analysis, we removed scarce species with maximum relative abundance < 2 percent, which, in addition to being scarce, showed highly restricted spatial ranges, often occurring at only one site. The results of this approach were compared to results obtained by (1) using genus-level instead of species-level identification and (2) using other ordination techniques including canonical correspondence analysis, redundancy analysis, and nonmetric multidimensional scaling (not shown). These approaches produced highly correlated first components or dimensions, and they could have been used interchangeably. Additionally, preliminary analyses using linear models showed that NO3 concentration to the second power and the interaction NO3× pH were not associated with PCoA scores. For simplicity, these results are also omitted.
N-responsive diatoms
We used correlation (Pearson’s r) and partial correlation analysis, in two sequential steps, to identify N-responsive benthic diatoms; that is, the diatom taxa associated with lake nitrogen status (NO3 or TN concentration). In the first step, we used correlation (Pearson’s r) to identify all of the taxa correlated with NO3 or TN. In the second step, we used partial correlation to correct each diatom–NO3 or diatom–TN correlation for any pH effect. This step was necessary because pH and NO3 (or TN) were slightly intercorrelated (see Results) and often were each associated with diatom abundance. Therefore, partial correlation analysis allowed us to identify taxa that were nonspuriously associated with NO3 or TN, after accounting for potentially confounding effects of pH. In the first step we focused on taxa that displayed a medium or strong correlation with NO3 or TN (r ≥ 0.3 or more r ≤ −0.3 or less; Cohen Citation1988) because weakly correlated taxa would have been removed anyway by the second step.
Results
Nitrogen status
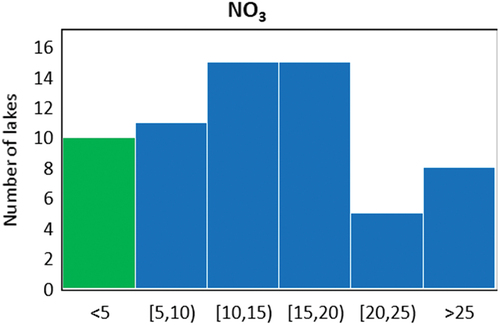
NO3 concentrations ranged from 0.93 to 36.14 µmol L−1 (average ± standard error: 14.25 ± 1.04 µmol L−1). Nine lakes (15 percent) had NO3 concentrations below 5 µmol L−1 and were considered as minimally N enriched (). Seven of these lakes belong to the EN group, one to the ES group, and one to the CS group. The majority of the lakes had NO3 concentrations between 5 and 25 µmol L−1 (forty-five lakes, 73 percent), and a further 13 percent (eight lakes) had concentrations > 25 µmol L−1 (). Among the eight most N-enriched lakes (NO3 > 25 µmol L−1), six belong to the CS group and two to the ES group. Average NO3 concentrations were relatively high and similar among the CN, CS, and ES groups (range = 14.74–18.49 µmol L−1) but were substantially lower in the EN group (8.04 µmol L−1; analysis of variance, df = 3, F = 9.266, p < .0001). Across the data set, NO3 was uncorrelated with elevation (r = −0.1, p > .1) or total phosphorus (r = −0.1, p > .1; phosphorus concentrations were available for forty-eight of the sixty-two lakes), whereas NO3 was moderately correlated with pH (r = −0.4, p < .001).
Figure 2. Frequency distribution of NO3 concentrations (in µmol L−1) across the study lakes. The green bar represents the lakes with NO3 concentration < 5 µmol L−1, which were considered minimally enriched with N.
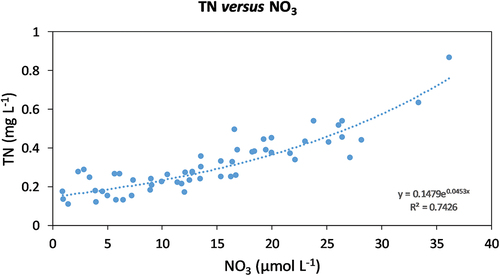
TN concentrations ranged from 0.11 to 0.87 mg L−1 (average ± standard error: 0.31 ± 0.02 mg L−1). Five lakes had TN concentrations below the reference 0.14 mg L−1, of which three were in the EN group and two were in the CS group. Across lakes, there was a strong correlation between TN and NO3 concentrations (r = 0.9, p < .001; ), and the relationship between TN and NO3 was well-described by an exponential function (TN = 0.1479 × e0.0453NO3; R2 = 0.74). Across the data set, TN was negatively correlated with elevation (r = −0.5, p < .001) and with pH (r = −0.3, p < .05), whereas TN was uncorrelated with total phosphorus (r = −0.1, p > .1).
Figure 3. Relationship between total N (TN) (mg L−1) and NO3 concentrations (µmol L−1) across the study lakes.
Across lakes, NO3 concentrations were positively correlated with the DIN:TP ratio (r = 0.7, p < .001; Figure S1). Only two lakes (of forty-eight) had DIN:TP ratios below 3.4. Based on a regression model (Figure S1), lakes with NO3 concentration of 5 µmol L−1 were predicted to have a DIN:TP ratio of 28, whereas lakes with DIN:TP ratio of 3.4 were predicted to have a NO3 concentration of approximately 1 µmol L−1.
Diatom communities
The first two PCos explained 28.1 percent and 8.9 percent of the overall variance in benthic diatom composition and were considered in further analyses. Visual examination of scatterplots suggested that the first PCo (PCo1) was associated with NO3 (nitrogen status) and pH (acid–base status; ), whereas PCo1 and elevation were unrelated (not shown). Specifically, based on the interpolated LOESS lines, PCo1 displayed an S-shaped (approximately sigmoidal) pattern with pH and an approximately linear pattern with NO3. As suggested by these plots, correlation analysis indicated that PCo1 was negatively correlated with pH and positively correlated with NO3 (). No environmental variable was correlated with PCo2. Moreover, TN, contrary to NO3, was not significantly correlated with any PCos. Correlation analysis indicated some associations between environmental variables, including a moderate correlation (r = 0.4) between NO3 and pH.
Figure 4. Principal coordinate (PCo1) representing benthic diatom community composition versus lake water (A) pH and NO3 (B) concentration. The lines interpolated are LOESS model fits (smoothing factor: 0.4).
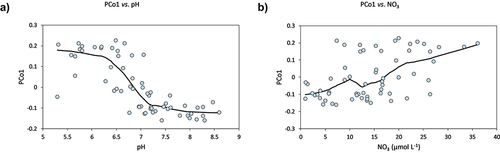
Table 2. Correlations between environmental variables (elevation, pH, NO3, TN) and principal coordinate scores (PCo1 and PCo2) representing patterns in benthic diatom composition.
We calculated a partial correlation between NO3 and PCo1 (partialling out the effects of pH) by correlating the residuals of the LOESS (nonlinear) regression of PCo1 versus pH and the residuals of a linear regression of NO3 versus pH. The resulting correlation was relatively weak (r = 0.3) and statistically nonsignificant, indicating that the effects of NO3 and pH on PCo1 could not be separated using this analysis.
N-responsive diatoms
Twelve diatom taxa had medium or strong correlations with NO3 (). Six of these taxa showed significant correlation with NO3 after controlling for the effects of pH using partial correlation analysis. In nearly all cases, the patterns between diatom relative abundance and NO3 were roughly linear (Figure S2). Brachysira brebissonii, Odontidium mesodon, Pinnularia microstauron var. nonfasciata, and Psammothidium marginulatum showed positive correlations (interpreted as preference for high NO3 concentrations), whereas Nitzschia alpina showed a negative correlation (interpreted as preference for low NO3 concentrations). Counter to these linear patterns, Brachysira neolexis morphotype II “capitata” had a dome-shaped relationship with NO3 and was considered to prefer intermediate NO3 concentrations (Figure S2). Plots of the collective abundance of taxa with preference for high or low NO3 versus NO3 () suggest the existence of three regions: in the < 5 µmol NO3 L−1 region, taxa preferring high NO3 were absent and taxa preferring low NO3 were relatively abundant; in the > 20 µmol NO3 L−1 region, taxa preferring low NO3 were absent and taxa preferring high NO3 could be numerically dominant (relative abundance > 50 percent); in the 5 to 20 µmol NO3 L−1 region, the two groups of taxa coexisted.
Figure 5. Proportion of diatoms with preference for high or low concentrations of nitrogen (A), (B) measured as NO3 or (C), (D) measured as total N (TN). Lines fitted by eye.
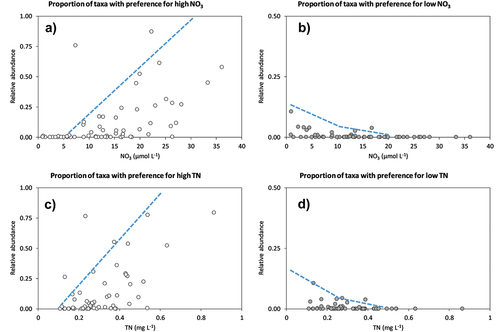
Table 3. Correlation and partial correlation analysis of diatom taxa versus NO3 (Table 3a) or TN (Table 3b) lake water concentration.
Nine diatom taxa had medium or strong correlations with TN, of which seven had significant correlations after controlling for pH (). Aulacoseira pfaffiana, Brachysira brebissonii, Eunotia intermedia, Odontidium mesodon, Psammothidium subatomoides, and Psammothidium marginulatum showed positive correlations (preference for high TN), whereas Nitzschia alpina showed a negative correlation (preference for low TN). Plots of the taxa with preference for high or low TN versus TN indicate that the relative abundance of the former increased from TN concentrations above 0.1 to 0.2 mg L−1 (corresponding to NO3 concentrations of 1–5 µmol NO3 L−1), whereas the latter disappeared at TN concentrations below 0.4 to 0.5 mg L−1 (roughly 20–25 µmol NO3 L−1).
Discussion
The majority of the study lakes were N enriched; that is, showed nitrate concentrations implying N saturation in watershed soils and consequent N leaching to surface waters. This result is unsurprising because the Alps are geographically wedged between regions of high N emission, including the Po Plain, Southern Germany, and the Swiss Plateau. Within the high average enrichment, the analysis also indicated the existence of strong regional differences. Lakes in the groups CN, CS, and ES, exposed to the highly populated and industrialized Po Plain (CN, ES) or the Swiss Plateau (CN), had NO3 concentrations approximately twice as high as the lakes in the EN group, which lies in an interior area shielded from major perialpine emission hotspots (Rogora et al. Citation2006; Camarero et al. Citation2009; Rihm and Achermann Citation2016). These differences suggest that the N concentrations observed in the study lakes were largely driven by differences in regional N deposition (Camarero et al. Citation2009). In addition, lake and watershed features such as land cover, bedrock geology, lake depth, lake size, and elevation may cause further variation in N status within regions by influencing lake specific sensitivity to N deposition (Burpee et al. Citation2022). Regardless of the reason, the regional and within-region differences provided the opportunity to examine the effects on N enrichment on benthic diatom assemblages over a wide gradient of N concentrations, ranging from values indicating minimal N enrichment (< 5 µmol NO3 L−1 or < 0.14 mg TN L−1) to values indicating moderate to high N enrichment for high-elevation lakes (> 20–30 µmol NO3 L−1 or > 0.4–0.5 mg TN L−1).
The PCo analysis indicated that benthic diatom composition was associated with pH—that is, acid–base status—and with NO3, an indicator of N status. In contrast to NO3, TN was not associated with benthic diatom composition (as quantified by the first two PCos). This result does not support the idea that TN represents the nitrogen available to benthic diatoms throughout the growing seasons, in which case we expected TN to have a stronger association with benthic diatom composition than late-summer or fall NO3. We suggest that TN had a weaker correlation with benthic diatom composition because it included a substantial organic fraction unavailable to algae (Lewis and Wurtsbaugh Citation2008; Bergström Citation2010). This unavailable fraction probably represents a background influx of N compounds resistant to biological degradation from watershed soils into lakes. This hypothesis is consistent with the negative correlation between TN and elevation, which suggests that organic nitrogen inputs increase as watershed soils become thicker and richer in organic matter at lower elevations. Therefore, we suggest that NO3 (or DIN) is a better proxy of bioavailable N and a better indicator of inorganic N deposition (Bergström Citation2010). For these reasons, in the rest of this section we focus on NO3 as the main indicator of lake N status.
The strong correlation between PCo1 and pH suggests that the acid–base status was the major driver of benthic diatom composition across the study lakes. This result is consistent with the idea that benthic diatoms include several species with either acidophilous or alkaliphilous character, which makes them excellent indicators of lake water pH (e.g., Battarbee Citation1984; ter Braak and van Dame Citation1989). In this study, variation in pH among lakes reflected variation in lake water alkalinity due to background differences in underlying rocks, which ranged from hard weathering (e.g., crystalline rocks) at one end to highly weatherable (e.g., sedimentary rocks) at the other end (Marchetto et al. Citation2021). Anthropogenic acidification due to atmospheric deposition, though occurring in sensitive regions (especially within the CS group; e.g., Marchetto et al. Citation1994), did not contribute substantially to the observed pH effect on PCo1, because the effect remained prominent even if we removed the most acidic lakes (pH < 6) from the analysis (results not shown).
The correlation between NO3 and PCo1 is difficult to interpret because of the confounding effect by pH (correlated to both PCo1 and NO3). The confounding effect may have two causes. First, pH and NO3 showed an unfortunate (from a data interpretation standpoint) overlap in spatial pH and NO3 patterns. For example, lakes in the CS group (high lake water NO3) tended to have lower pH due to hard-weathering geology, whereas lakes in the EN group (lower lake water NO3) tended to have higher pH due to a reactive sedimentary geology. Second, some of the diatom species that responded to pH (i.e., the acidophilous or alkaliphilous species) responded to both pH and NO3, suggesting that they were indicators for more than one environmental factor (again, not an ideal situation for interpretation). Because of these associations, the effects of pH had to be carefully accounted for before we could examine the effects of NO3.
Despite these difficulties, the identification of N-responsive taxa (i.e., taxa correlated with NO3 after removing any effect of pH) supported the idea that the benthic diatom community of the lakes contains taxa sensitive to nitrogen enrichment, including taxa preferring high or low NO3 concentrations. Although the number of N-responsive taxa identified is low (six taxa), the compositional effects caused by NO3 should not be considered minor. First, taxa with preference for high NO3 could be numerically dominant (relative abundance > 50 percent) in highly N-enriched lakes, causing major compositional change. Second, it is possible that the total number of taxa responding to NO3 was larger. For another six taxa, an association with NO3 could be neither proven nor disproven statistically due to confounding pH effects. Similarly, among the rare taxa with highly scattered occurrences (< 2 percent of maximum relative abundance, for which the data did not allow a reliable space for time analysis), at least some might have been responsive to N. The occurrence of N-responsive taxa indicates that, at least in the Alps, benthic diatoms can be used as effective indicators of N enrichment. The sensitivity to N, which was already noted for benthic diatoms in coastal systems and streams (Keithan, Lowe, and DeYoe Citation1988; Kafouris et al. Citation2019), clearly adds to the value of benthic diatoms as biological indicators. We suggest that benthic diatoms could be particularly useful indicators of N enrichment in lakes lacking planktonic indicators (e.g., Asterionella and Fragilaria sensu lato), like high-elevation lakes of the European Alps, or systems that lack planktonic diatoms altogether, like springs, streams, and small rivers.
Patterns of N-responsive taxa indicate a threshold at approximately 5 µmol NO3 L−1, marked by the appearance of taxa preferring high NO3 and a decline in taxa preferring low NO3. This result supports the idea that biological responses to environmental pressures are discontinuous and that the search for breakpoints in the relationship between biological responses and anthropogenic pressures is a fruitful approach for identifying objective policy targets. We suggest that the threshold of 5 µmol NO3 L−1 indicates a departure from nearly undisturbed benthic diatom assemblages caused by N enrichment. European and Swiss environmental laws prescribe that pollution of lakes and other freshwater habitats should not cause biological deviation from undisturbed conditions (Water Protection Ordinance Citation1998; Water Framework Directive 2000/60/EC Citation2000). Based on our results, compliance with this principle would require lake water NO3 concentrations of 5 µmol L−1 or less during late summer or early fall. This threshold aligns with the onset of N watershed saturation, defined as the stage when higher than natural nitrogen concentrations appear in surface waters during low flows (Aber et al. Citation1989; Van Migroet Citation1994). Therefore, in alpine high-elevation lakes, an NO3 concentration of 5 µmol L−1 can be seen as a threshold for both chemical and biological change.
Assuming that N deposition is the major source of lake water N in remote alpine lakes, the suggested 5 µmol L−1 threshold can be translated into a critical deposition load (CL) by using a deposition concentration model. For example, based on a global regression model developed by Bergström and Jansson (Citation2006), wet DIN deposition should not exceed 3 kg ha−1 yr−1 to keep lake water NO3 concentration below 5 µmol L−1. The value of 3 kg ha−1 yr−1 of wet N deposition (roughly 4–5 kg ha−1 yr−1 of total N deposition, using conversion factors of 1.3–1.7 derived from the literature; see Baron et al. (Citation2011)) aligns with other CLs proposed in the literature for similar environments. Based on an analysis of N lake water concentration and N deposition spatial patterns, Baron et al. (Citation2011) estimated that in high-elevation U.S. lakes, N leaching and biological effects of N enrichment occur at deposition levels of 1.5, 2.0, and 3.5 kg N ha−1 (wet deposition) depending on region (Sierra Nevada, the Rocky Mountains, and the Northeast, respectively). Expressed in terms of total N deposition (wet + dry), the corresponding CLs are 2, 3, and 6 kg N ha−1. By comparing “hindcasted” nitrogen deposition data with fossil diatom records, Baron (Citation2006) proposed a biologically based CL of 1.5 kg N·ha−1·yr−1 (wet deposition) for lakes in Rocky Mountain National Park. A similar value (1.4 kg N ha−1 yr−1 wet N deposition), derived using similar methods, was independently proposed for lakes in the Sierra Nevada and in Yellowstone National Park by Saros et al. (Citation2011). Based on a recent literature review, Bobbink, Loran, and Tomassen (Citation2022) proposed a CL of 2 to 4 kg N ha−1 yr−1 of total deposition for alpine clearwater lakes. The agreement of CL estimates for high-elevation lakes across regions and approach should not be surprising, because high-elevation watersheds share strong similarities in all of the major factors that determine the response of lake ecosystems to increased N deposition, including watershed topography, vegetation type, soil development, and lake water hydraulic residence time (Pardo et al. Citation2011).
The threshold of 3 kg N ha−1 yr−1 (wet deposition) or ~4 to 5 kg N ha−1 yr−1 (total deposition) identified in this study is low compared to current N deposition in certain alpine regions. Therefore, despite recent improvements in air quality, in large parts of the Alps, lake ecosystems are potentially still stressed by excess N deposition (e.g., Kosonen et al. Citation2019; Rihm and Künzle Citation2023). Additionally, we note that a CL of 4 to 5 kg ha−1 yr−1 is substantially lower than the CLs proposed for other ecosystem types (e.g., CLs ranging between 5 and 25 kg N ha−1 yr−1 have been suggested for woodland, grassland, and bogs; Rihm and Achermann Citation2016; Bobbink, Loran, and Tomassen Citation2022). The greater sensitivity to N deposition lends further support to the idea that high-elevation lakes are sensitive sentinels of global change (Moser et al. Citation2019). Because environmental protection should pay special attention to the most sensitive habitats, it stands to reason that high-elevation lakes should have a prominent place in environmental research for policy.
In this study, diatoms and water chemistry were only measured in late summer to early fall. This time window has advantages for monitoring purposes because earlier months (June–July) have highly variable conditions in water chemistry due to snowmelt. Another advantage is that, in principle, late summer is the period when nutrients tend to have greater biological effects because they reach the most depleted and limiting concentrations. Nonetheless, in high-elevation lakes, NO3 typically peaks in periods of high flows during the nongrowing season, particularly during early-summer snowmelt (Kuhn Citation2001). Thus, during snowmelt, even lakes that show no leaching during low-flow, late-summer conditions may be affected by NO3 pulses exceeding 20 µmol NO3 L−1 (Kaste, Stoddard, and Henriksen Citation2003). Therefore, CLs designed to avoid chemical and biological change from late summer onwards are not guaranteed to prevent alterations (albeit transient) during and following these pulses. Future analyses focusing on seasonal dynamics might help establish to what extent benthic diatoms are affected by NO3 pulses during snowmelt and whether any transient effect should also be accounted for in setting deposition targets.
Supplemental Material
Download Zip (402.5 KB)Acknowledgments
We thank Dr. Reto Meier of the Swiss Federal Office for the Environment for guidance and feedback throughout the project. Diatom and water chemistry data for Lago Leit were analyzed by AquaPlus (Zug, Switzerland) and the Chemistry laboratory Q2 of IRSA-CNR (Verbania, Italy).
Disclosure statement
No potential conflict of interest was reported by the authors.
Supplementary material
Supplemental data for this article can be accessed online at https://doi.org/10.1080/15230430.2023.2270821.
Additional information
Funding
References
- Aber, J.D., K.J. Nadelhoffer, P. Steudler, and J.M. Melillo. 1989. Nitrogen saturation in northern forest ecosystems. BioScience 39: 378–13. doi:10.2307/1311067.
- Baron, J.S. 2006. Hindcasting nitrogen deposition to determine ecological critical load. Ecological Applications 16: 433–9. doi:10.1890/1051-0761(2006)016[0433:HNDTDA]2.0.CO;2.
- Baron, J.S., C.T. Driscoll, J.L. Stoddard, and E.E. Richer. 2011. Empirical critical loads of atmospheric nitrogen deposition for nutrient enrichment and acidification of sensitive US lakes. BioScience 61: 602–13. doi:10.1525/bio.2011.61.8.6.
- Baron, J.S., D.S. Ojima, E.A. Holland, and W.J. Parton. 1994. Analysis of nitrogen saturation potential in Rocky Mountain tundra and forest: Implications for aquatic systems. Biogeochemistry 27: 61–82. doi:10.1007/BF00002571.
- Battarbee, R.W. 1984. Diatom analysis and the acidification of lakes. Philosophical Transactions of the Royal Society of London. B, Biological Sciences 305: 451–77.
- Battarbee, R.W., S. Patrick, M. Kernan, R. Psenner, H. Thies, J. Grimalt, B.O. Rosseland, et al. 2005. High mountain lakes and atmospherically transported pollutants. In Global change in mountain regions, ed. U.M. Huber, H.K.M. Bugmann, and M.A. Reasoner, 113–21. New York: Springer.
- Bennion, H., M.G. Kelly, S. Juggins, M.L. Yallop, A. Burgess, J. Jamieson, and J. Krokowski. 2014. Assessment of ecological status in UK lakes using benthic diatoms. Freshwater Science 33: 639–54. doi:10.1086/675447.
- Bergström, A.K. 2010. The use of TN:TP and DIN:TP ratios as indicators for phytoplankton nutrient limitation in oligotrophic lakes affected by N deposition. Aquatic Sciences 72: 277–81. doi:10.1007/s00027-010-0132-0.
- Bergström, A.K., and M. Jansson. 2006. Atmospheric nitrogen deposition has caused nitrogen enrichment and eutrophication of lakes in the Northern Hemisphere. Global Change Biology 12: 635–43. doi:10.1111/j.1365-2486.2006.01129.x.
- Bobbink, R., C. Loran, and H. Tomassen, eds. 2022. Review and revision of empirical critical loads of nitrogen for Europe. Dessau-Rosslau, Germany: German Environmental Agency. www.umweltbundesamt.de/publikationen.
- Bowman, W.D., and H. Steltzer. 1998. Positive feedbacks to anthropogenic nitrogen deposition in Rocky Mountain alpine tundra. Ambio 27: 514–7.
- Burpee, B.T., J.E. Saros, L. Nanus, J. Baron, J. Brahney, K.R. Christianson, T. Ganz, et al. 2022. Identifying factors that affect mountain lake sensitivity to atmospheric nitrogen deposition across multiple scales. Water Research 209: 117883. doi:10.1016/j.watres.2021.117883.
- Camarero, L., M. Rogora, R. Mosello, N.J. Anderson, A. Barbieri, I.V. Botev, M. Kernan, et al. 2009. Regionalisation of chemical variability in European mountain lakes. Freshwater Biology 54: 2452–69. doi:10.1111/j.1365-2427.2009.02296.x.
- Cameron, N.G., H.J.B. Birks, V.J. Jones, F. Berges, J. Catalan, R.J. Flower, J. Garcia, et al. 1999. Surface-sediment and epilithic diatom pH calibration sets for remote European mountain lakes (AL: PE Project) and their comparison with the Surface Waters Acidification Programme (SWAP) calibration set. Journal of Paleolimnology 22: 291–317. doi:10.1023/A:1008025928509.
- Catalan, J., S. Pla-Rabés, A.P. Wolfe, J.P. Smol, K.M. Rühland, N.J. Anderson, J. Kopáček, et al. 2013. Global change revealed by palaeolimnological records from remote lakes: A review. Journal of Paleolimnology 49: 513–35. doi:10.1007/s10933-013-9681-2.
- Charles, D.F., R.W. Battarbee, I. Renberg, H. van Dam, and J.P. Smol. 1990. Paleoecological analysis of lake acidification trends in North America and Europe using diatoms and chrysophytes. In Acidic precipitation: Soils, aquatic processes, and lake acidification, ed. S.A. Norton, S.E. Lindberg, and A.L. Page, 207–76. New York: Springer.
- Cohen, J.1988. Statistical power analysis for the behavioral sciences. 2nd ed. Hillsdale, NJ: Erlbaum.
- Della Lucia, M., A. Marchetto, R. Mosello, and G.A. Tartari. 1996. Studies on a chemical gradient of atmospheric deposition from the Po Valley to the Alps. Water, Air, and Soil Pollution 87: 171–87. doi:10.1007/BF00696835.
- Elser, J.J., M.E. Bracken, E.E. Cleland, D.S. Gruner, W.S. Harpole, H. Hillebrand, J.T. Ngai, E.W. Seabloom, J.B. Shurin, and J.E. Smith. 2007. Global analysis of nitrogen and phosphorus limitation of primary producers in freshwater, marine and terrestrial ecosystems. Ecology Letters 10: 1135–42. doi:10.1111/j.1461-0248.2007.01113.x.
- Elser, J.J., M. Kyle, L. Steger, K.R. Nydick, and J.S. Baron. 2009. Nutrient availability and phytoplankton nutrient limitation across a gradient of atmospheric nitrogen deposition. Ecology 90: 3062–73. doi:10.1890/08-1742.1.
- Forsius, M., M. Posch, M. Holmberg, J. Vuorenmaa, S. Kleemola, A. Augustaitis, B. Beudert, et al. 2021. Assessing critical load exceedances and ecosystem impacts of anthropogenic nitrogen and sulphur deposition at unmanaged forested catchments in Europe. Science of the Total Environment 753: 141791. doi:10.1016/j.scitotenv.2020.141791.
- Galloway, J.N., J.D. Aber, J.W. Erisman, S.P. Seitzinger, R.W. Howarth, E.B. Cowling, and B.J. Cosby. 2003. The nitrogen cascade. Bioscience 53: 341–56. doi:10.1641/0006-3568(2003)053[0341:TNC]2.0.CO;2.
- Galloway, J.N., F.J. Dentener, D.G. Capone, E.W. Boyer, R.W. Howarth, S.P. Seitzinger, G.P. Asner, et al. 2004. Nitrogen cycles: Past, present, and future. Biogeochemistry 70: 153–226. doi:10.1007/s10533-004-0370-0.
- Holland, E.A., F.J. Dentener, B.H. Braswell, and J.M. Sulzman. 1999. Contemporary and pre-industrial global reactive nitrogen budgets. Biogeochemistry 46: 7–43. doi:10.1007/BF01007572.
- Holtgrieve, G.W., D.E. Schindler, W.O. Hobbs, P.R. Leavitt, E.J. Ward, L. Bunting, G. Chen, et al. 2011. A coherent signature of anthropogenic nitrogen deposition to remote watersheds of the Northern Hemisphere. Science 334: 1545–8. doi:10.1126/science.1212267.
- Kafouris, S., E. Smeti, S. Spatharis, G. Tsirtsis, A. Economou-Amilli, and D.B. Danielidis. 2019. Nitrogen as the main driver of benthic diatom composition and diversity in oligotrophic coastal systems. Science of the Total Environment 694: 133773. doi:10.1016/j.scitotenv.2019.133773.
- Kaste, Ø., J.L. Stoddard, and A. Henriksen. 2003. Implication of lake water residence time on the classification of Norwegian surface water sites into progressive stages of nitrogen saturation. Water, Air, and Soil Pollution 142: 409–24. doi:10.1023/A:1022015814800.
- Kawecka, B., and J. Galas. 2003. Diversity of epilithic diatoms in high mountain lakes under the stress of acidification (Tatra Mts, Poland). Annales de Limnologie - International Journal of Limnology 39: 239–53. doi:10.1051/limn/2003019.
- Keithan, E.D., R.L. Lowe, and H.R. DeYoe. 1988. Benthic diatom distribution in a Pennsylvania stream: Role of pH and nutrients. Journal of Phycology 24: 581–5. doi:10.1111/j.1529-8817.1988.tb04265.x.
- Kelly, M.G., A. Cazaubon, E. Coring, A. Dell’Uomo, L. Ector, B. Goldsmith, H. Guasch, et al. 1998. Recommendations for the routine sampling of diatoms for water quality assessments in Europe. Journal of Applied Phycology 10: 215–24. doi:10.1023/A:1008033201227.
- Kosonen, Z., E. Schnyder, E. Hiltbrunner, A. Thimonier, M. Schmitt, E. Seitler, and L. Thöni. 2019. Current atmospheric nitrogen deposition still exceeds critical loads for sensitive, semi-natural ecosystems in Switzerland. Atmospheric Environment 211: 214–25. doi:10.1016/j.atmosenv.2019.05.005.
- Kuhn, M. 2001. The nutrient cycle through snow and ice, a review. Aquatic Sciences 63: 150–67. doi:10.1007/PL00001348.
- Lafrancois, B.M., K.R. Nydick, B.M. Johnson, and J.S. Baron. 2004. Cumulative effects of nutrients and pH on the plankton of two mountain lakes. Canadian Journal of Fisheries and Aquatic Sciences 61: 1153–65. doi:10.1139/f04-053.
- Legendre, P., and E.D. Gallagher. 2001. Ecologically meaningful transformations for ordination of species data. Oecologia 129: 271–80. doi:10.1007/s004420100716.
- Lepori, F., A. Barbieri, and S.J. Ormerod. 2003. Causes of episodic acidification in Alpine streams. Freshwater Biology 48: 75–189. doi:10.1046/j.1365-2427.2003.00972.x.
- Lepori, F., and F. Keck. 2012. Effects of atmospheric nitrogen deposition on remote freshwater ecosystems. Ambio 41: 235–46. doi:10.1007/s13280-012-0250-0.
- Lepori, F., and J. Robin. 2014. Nitrogen limitation of the phytobenthos in Alpine lakes: Results from nutrient-diffusing substrata. Freshwater Biology 59: 1633–45. doi:10.1111/fwb.12370.
- Lewis, W.M., Jr, and W.A. Wurtsbaugh. 2008. Control of lacustrine phytoplankton by nutrients: Erosion of the phosphorus paradigm. International Review of Hydrobiology 93: 446–65. doi:10.1002/iroh.200811065.
- Livingstone, D.M., A.F. Lotter, and I.R. Walkery. 1999. The decrease in summer surface water temperature with altitude in Swiss Alpine lakes: A comparison with air temperature lapse rates. Arctic, Antarctic, and Alpine Research 31: 341–52. doi:10.1080/15230430.1999.12003319.
- Marchetto, A., A. Barbieri, R. Mosello, and G.A. Tartari. 1994. Acidification and weathering processes in high mountain lakes in Southern Alps. Hydrobiologia 274: 75–81. doi:10.1007/BF00014629.
- Marchetto, A., A. Boggero, D. Fontaneto, A. Lami, A.F. Lotter, M.M. Manca, J. Massaferro, et al. 2021. Living organisms and sedimentary remains from high mountain lakes in the Alps. Journal of Limnology 80: 2036.
- Meunier, C.L., M.J. Gundale, I.S. Sánchez, and A. Liess. 2016. Impact of nitrogen deposition on forest and lake food webs in nitrogen‐limited environments. Global Change Biology 22: 164–79. doi:10.1111/gcb.12967.
- Morris, D.P., and W.M. Lewis Jr. 1988. Phytoplankton nutrient limitation in Colorado mountain lakes. Freshwater Biology 20: 315–27. doi:10.1111/j.1365-2427.1988.tb00457.x.
- Moser, K.A., J.S. Baron, J. Brahney, I.A. Oleksy, J.E. Saros, E.J. Hundey, S. Sadro, et al. 2019. Mountain lakes: Eyes on global environmental change. Global and Planetary Change 178: 77–95. doi:10.1016/j.gloplacha.2019.04.001.
- Nilsson, J., and P. Grennfelt. 1988. Critical loads for sulphur and nitrogen. UNECE/Nordic Council workshop report. Sweden: Skokloster.
- Nopmongcol, U., R. Beardsley, N. Kumar, E. Knipping, and G. Yarwood. 2019. Changes in United States deposition of nitrogen and sulfur compounds over five decades from 1970 to 2020. Atmospheric Environment 209: 144–51. doi:10.1016/j.atmosenv.2019.04.018.
- Nydick, K.R., B.M. Lafrancois, J.S. Baron, and B.M. Johnson. 2004. Nitrogen regulation of algal biomass, productivity, and composition in shallow mountain lakes, Snowy Range, Wyoming, USA. Canadian Journal of Fisheries and Aquatic Sciences 61: 1256–68. doi:10.1139/f04-085.
- Pardo, L.H., M.E. Fenn, C.L. Goodale, L.H. Geiser, C.T. Driscoll, E.B. Allen, J.S. Baron, et al. 2011. Effects of nitrogen deposition and empirical nitrogen critical loads for ecoregions of the United States. Ecological Applications 21: 3049–82. doi:10.1890/10-2341.1.
- Rihm, B., and B. Achermann. 2016. Critical loads of nitrogen and their exceedances. Swiss contribution to the effects-oriented work under the convention on long-range transboundary air pollution (UNECE). Environmental studies no. 1642, 78. Bern: Federal Office for the Environment.
- Rihm, B., and T. Künzle. 2023. Nitrogen deposition and exceedances of critical loads for nitrogen in Switzerland 1990–2020. Bern, Switzerland: Meteotest AG.
- Rogora, M., S. Arisci, and A. Marchetto. 2012. The role of nitrogen deposition in the recent nitrate decline in lakes and rivers in Northern Italy. Science of the Total Environment 417: 214–23. doi:10.1016/j.scitotenv.2011.12.067.
- Rogora, M., L. Colombo, A. Marchetto, R. Mosello, and S. Steingruber. 2016. Temporal and spatial patterns in the chemistry of wet deposition in Southern Alps. Atmospheric Environment 146: 44–54. doi:10.1016/j.atmosenv.2016.06.025.
- Rogora, M., R. Mosello, S. Arisci, M.C. Brizzio, A. Barbieri, R. Balestrini, P. Waldner, et al. 2006. An overview of atmospheric deposition chemistry over the Alps: Present status and long-term trends. Hydrobiologia 562: 17–40. doi:10.1007/s10750-005-1803-z.
- Rühland, K.M., A.M. Paterson, and J.P. Smol. 2015. Lake diatom responses to warming: Reviewing the evidence. Journal of Paleolimnology 54: 1–35. doi:10.1007/s10933-015-9837-3.
- Saros, J.E., D.W. Clow, T. Blett, and A.P. Wolfe. 2011. Critical nitrogen deposition loads in high-elevation lakes of the western US inferred from paleolimnological records. Water, Air, and Soil Pollution 216: 93–202. doi:10.1007/s11270-010-0526-6.
- Saros, J.E., S.J. Interlandi, A.P. Wolfe, and D.R. Engstrom. 2003. Recent changes in the diatom community structure of lakes in the Beartooth Mountain Range, USA. Arctic, Antarctic, and Alpine Research 35: 18–23. doi:10.1657/1523-0430(2003)035[0018:RCITDC]2.0.CO;2.
- Saros, J.E., T.J. Michel, S.J. Interlandi, and A.P. Wolfe. 2005. Resource requirements of Asterionella formosa and Fragilaria crotonensis in oligotrophic alpine lakes. Canadian Journal of Fisheries and Aquatic Sciences 62: 1681–9. doi:10.1139/f05-077.
- Smith, R.A., R.B. Alexander, and G.E. Schwarz. 2003. Natural background concentrations of nutrients in streams and rivers of the conterminous United States. Environmental Science & Technology 37: 3039–47. doi:10.1021/es020663b.
- Smol, J.P., and E.F. Stoermer. 2010. The diatoms: Applications for the environmental and earth sciences. 2nd ed., 667. Cambridge, UK: Cambridge University Press.
- Spaulding, S. A., M. K. Otu, A. P. Wolfe, and J. S. Baron. 2015. Paleolimnological records of nitrogen deposition in shallow, high-elevation lakes of Grand Teton National Park, Wyoming, USA. Arctic, Antarctic, and Alpine Research 47: 703–17. doi:10.1657/AAAR0015-008.
- ter Braak, C.J., and H. van Dame. 1989. Inferring pH from diatoms: A comparison of old and new calibration methods. Hydrobiologia 178: 209–23. doi:10.1007/BF00006028.
- Thies, H., M. Tolotti, U. Nickus, A. Lami, S. Musazzi, P. Guilizzoni, N.L. Rose, and H. Yang. 2012. Interactions of temperature and nutrient changes: Effects on phytoplankton in the Piburger See (Tyrol, Austria). Freshwater Biology 57: 2057–75. doi:10.1111/j.1365-2427.2011.02661.x.
- Tolotti, M. 2001. Phytoplankton communities and littoral diatoms for classification of trophic status and acidification risk in high mountain lakes of the Adamello-Brenta Regional Park (Northern Italy). Journal of Limnology 60: 171–88. doi:10.4081/jlimnol.2001.1.171.
- Tolotti, M. L. Forsström, G. Morabito, B. Thaler, M. Stoyneva, M. Cantonati, M. Šiško, and A. Lotter. 2009. Biogeographical characterisation of phytoplankton assemblages in high altitude, and high latitude European lakes. Advances in Limnology 62: 55–75. doi:10.1127/advlim/62/2009/55.
- Tolotti, M., M. Manca, N. Angeli, G. Morabito, B. Thaler, E. Rott, and E. Stuchlik. 2006. Phytoplankton and zooplankton associations in a set of Alpine high altitude lakes: Geographic distribution and ecology. Hydrobiologia 562: 99–122. doi:10.1007/s10750-005-1807-8.
- Tolotti, M., H. Thies, U. Nickus, and R. Psenner. 2012. Temperature modulated effects of nutrients on phytoplankton changes in a mountain lake. Hydrobiologia 698: 61–75. doi:10.1007/s10750-012-1146-5.
- van Migroet, H. 1994. The relative importance of sulphur and nitrogen compounds in the acidification of freshwater. In Acidification of freshwater ecosystems: Implications for the future, ed. C.E.W. Steinberg and R.F. Wright, 33–49. Chichester, UK: Wiley.
- Vitousek, P.M., and R.W. Howarth. 1991. Nitrogen limitation on land and in the sea – How can it occur? Biogeochemistry 13: 87–115. doi:10.1007/BF00002772.
- Vuorenmaa, J., A. Augustaitis, B. Beudert, W. Bochenek, N. Clarke, H.A. de Wit, T. Dirnböck, et al. 2018. Long-term changes (1990–2015) in the atmospheric deposition and runoff water chemistry of sulphate, inorganic nitrogen and acidity for forested catchments in Europe in relation to changes in emissions and hydrometeorological conditions. Science of the Total Environment 625: 1129–45. doi:10.1016/j.scitotenv.2017.12.245.
- Water Framework Directive 2000/60/EC. 2000. https://eur-lex.europa.eu/legal-content/EN/TXT/?uri=celex:32000L0060.
- Water Protection Ordinance. 1998. https://www.fedlex.admin.ch/eli/cc/1998/2863_2863_2863/en.
- Williams, J.J., M. Beutel, A. Nurse, B. Moore, S.E. Hampton, and J.E. Saros. 2016. Phytoplankton responses to nitrogen enrichment in Pacific Northwest, USA Mountain Lakes. Hydrobiologia 776: 261–76. doi:10.1007/s10750-016-2758-y.
- Winter, J.G., and H.C. Duthie. 2000. Epilithic diatoms as indicators of stream total N and total P concentration. Journal of the North American Benthological Society 19: 32–49. doi:10.2307/1468280.
- Wolfe, A.P., J.S. Baron, and R.J. Cornett. 2001. Anthropogenic nitrogen deposition induces rapid ecological changes in alpine lakes of the Colorado Front Range (USA). Journal of Paleolimnology 25: 1–7. doi:10.1023/A:1008129509322.
- Yamaga, S., S. Ban, M. Xu, T. Sakurai, S. Itahashi, and K. Matsuda. 2021. Trends of sulfur and nitrogen deposition from 2003 to 2017 in Japanese remote areas. Environmental Pollution 289: 117842. doi:10.1016/j.envpol.2021.117842.