
 ?Mathematical formulae have been encoded as MathML and are displayed in this HTML version using MathJax in order to improve their display. Uncheck the box to turn MathJax off. This feature requires Javascript. Click on a formula to zoom.
ABSTRACT
The hydrological regulation function of glaciers in different watersheds is different. This study took the Yanggong River Basin (YRB) and Urumqi River Basin (URB) as two typical cases, to explore the runoff change differences and their responses to climate factors from 1979 to 2017. In the past 39 years, the YRB’s annual runoff showed an insignificant trend of increasing first and then decreasing, while the URB’s increasing trend was significant. From the 1980s to the 2010s, the YRB’s monthly runoff extremum occurred earlier than before, and the peak value decreased. The time of monthly runoff extremum in the URB has not changed, but the peak value is increasing. Both basins experienced an increase in annual temperatures from 1979 to 2017, with the rate of warming being more pronounced in the URB. The precipitation in the YRB had no significant trend from 1979 to 2017, and the significant increasing trend in annual precipitation extended in the URB from 1998 to 2010. The YRB’s runoff change was mainly influenced by the flood season precipitation, while the URB’s runoff increase was due to the temperature rise causing faster glacier and snow melt, and the summer precipitation change. In continental glacier basins with many glaciers, the regulation function of glaciers on total runoff is more significant.
Introduction
In addition to the Earth’s Antarctic and Arctic regions, mountain regions are the main distribution areas of glaciers, an essential component of the cryosphere, and the important global freshwater supply areas (Pörtner et al. Citation2019). Unlike ice-free basins, glacier runoff exhibits distinct seasonality, which means that glacier meltwater can compensate for low flow or droughts in downstream lowland areas adjacent to glacierized mountain regions (Barnett, Adam, and Lettenmaier Citation2005; Huss and Hock Citation2018; Radic and Hock Citation2014). Even in large European river basins with less than 1 percent ice cover area, the contribution of glaciers to seasonal runoff is significant when compared to total runoff (Bliss, Hock, and Radic Citation2014; Huss Citation2011). Due to the influence of varying climatic conditions and glacier types, differences in glacier runoff may exist (Han et al. Citation2023). The assessment of the impact of glacier runoff in eighteen large river basins worldwide shows that glacier runoff has a significant impact in seasonally arid areas, while it has a negligible impact in areas with a monsoon climate (Bliss, Hock, and Radic Citation2014; Gardelle et al. Citation2013; Kaser, Grosshauser, and Marzeion Citation2010;). Previous studies have compared temperate glaciers to continental glaciers and documented that the peak time of glacier runoff from continental glaciers occurs later than that of temperate glaciers (Han et al. Citation2023).
The Intergovernmental Panel on Climate Change Sixth Assessment Report and the Special Report on the Ocean and Cryosphere in a Changing Climate pointed out that in the context of climate change, the high mountains of the Northern Hemisphere, including the Alpine regions of Asia, the main distribution area of glaciers in China, face a series of changes. These changes include the surface temperature warming rate of (0.3 ± 0.2) °C/10a above the global average in recent decades, precipitation patterns exhibiting notable variations across regions and seasons, snow cover decreasing in most regions, and an acceleration in glacier mass loss rate (Pörtner et al. Citation2019; Veal Citation2021). Glaciers play a critical role as a significant source of surface water worldwide, particularly during the summer (Ayala et al., Citation2020; FariasBarahona et al. Citation2020), and they have experienced considerable mass and area loss in recent decades (Braun et al. Citation2019; Dussaillant et al. Citation2019; Farias-Barahona et al. Citation2019, Citation2020; Malmros et al. Citation2016). The global retreat of mountain glaciers and related runoff changes have attracted significant attention to the sustainability of global water resources (Barnett, Adam, and Lettenmaier Citation2005; Immerzeel, van Beek, and Bierkens Citation2010; Immerzeel et al. Citation2020; Kaser, Grosshauser, and Marzeion Citation2010). Previous studies have shown that sustained loss of mountain glacier quality may significantly reduce in runoff in some watersheds, especially in Central Asia and the Andes region (Huss and Hock Citation2018). Given the context of climate change and the accelerated melting of mountain glaciers, it is of utmost importance to examine the alteration of runoff characteristics in glacial basins.
In terms of global warming, the accelerated retreat of glaciers in China has profoundly impacted the hydrological and water resources process (Ding and Zhang Citation2015, Citation2018; Ding, Zhang, and Chen Citation2020). The Tianshan Mountains and the Qinghai–Tibet Plateau and their surrounding areas are China’s main distribution areas of glacier-bearing basins (Liu et al. Citation2015). In the arid region of northwest China, including the Tianshan Mountains and the northern Qinghai–Tibet Plateau, the proportion of glacier runoff gradually increases westward with droughts worsening and proportion glacier area expanding (Chen et al. Citation2008; Ding and Zhang Citation2015, Citation2018; Zhang, Gao, and Zhang Citation2015a; Zhang et al. Citation2019a, Citation2019b; Ding, Zhang, and Chen Citation2020). Remote sensing (Aizen, Aizen, and Kuzmichonok Citation2007; Kumar, Yang, and Sharma Citation2019) has shown a negative glacier mass balance in the Tianshan Mountains (Wang et al. Citation2020), leading to an initial rise then fall in glacier runoff, with a projected future decline (Ding and Zhang Citation2015; Jia et al. Citation2020; Jiang et al. Citation2022; Xu et al. Citation2023). Southern Tianshan has higher glacier runoff proportions than the north, reaching 50 percent in some basins (Chen et al. Citation2019; Gao et al. Citation2010; Wu et al. Citation2022; Zhang et al. Citation2016). In the northeast Qinghai–Tibet Plateau’s basins with very small glacier areas—like the Shiyang River Basin and the Beida River Basin—the glacier runoff is peaking or decreasing (Chen et al. Citation2008; Ding and Zhang Citation2015, Citation2018; Ding, Zhang, and Chen Citation2020; Wang et al. Citation2017; Zhang, Gao, and Zhang Citation2015a; Zhang et al. Citation2019a, Citation2019b). In the central Qinghai–Tibetan Plateau, the limited glacier coverage contributes insignificantly to the major rivers’ total runoff (include the upstream regimes of the Yellow, Yangtze, Mekong, Salween, and Brahmaputra rivers), remaining below 5 percent. The proportion is expected to decrease in the following decades (Zhao et al. Citation2019). In the southern Qinghai–Tibetan Plateau, numerous temperate glaciers generate significant runoff during the melting season. For instance, in the Nam Co Basin, the Hailuogou catchment, and the upper region of the Yarlung Zangbo River Basin, glacier runoff accounts for approximately 50 percent of the total runoff (Tanguang et al. Citation2015; Zhang et al. Citation2015b; Xin et al. Citation2021). Due to the higher rate of temperature rise, temperate glaciers are melting faster, which led to an increase in glacier runoff in many basins, but some small glacier basins are seeing a runoff decrease, such as the Niyang River Basin and the Kyanjing Basin (He et al. Citation2023; Wang et al. Citation2023; Yao, Li, and Chen Citation2023). After 2080, glacier runoff will be on a decreasing trend in most western China basins (Bliss, Hock, and Radic Citation2014), significantly reducing its contribution and regulatory functions to the total runoff.
The Yanggong River Basin (YRB), which is located in a typical temperate glacier basin in Southwest China and affected by the Southeast and Southwest monsoons, and the Urumqi River Basin (URB), which is located in a typical continental glacier basin in northwest China and affected by subpolar westerlies, were selected as the research sites of the present study. This study combined the Mann-Kendall test and correlation analysis methods to evaluate the impacts of climate and glacier change on runoff change. The study has the following objectives: (1) to statistically detect the trends and the abrupt change points of hydrological and climatic time series of the watersheds and to analyze its multitimescale characteristics; (2) to explore the influential mechanisms of impacts of temperature, precipitation, and glacier change on runoff change; and (3) to reveal the regulation services of glaciers on runoff in different regions of China. This study provides methodologies and data references for international counterparts for studying the impacts of climate and glaciers on runoff change in glacier basins. This study also provides a new understanding of balancing the security pattern of global water resources.
Study area
The YRB (26°46ʹ36ʹ–27°6ʹ5ʹN; 100°8ʹ13”–100°21ʹ10”E), with an area of 543 km2, is located in Yulong Snow Mountain, Yunnan Province, China, in which the Yanggong River is an important tributary of the Jinsha River in the upper reaches of the Yangtze River. The YRB is surrounded by mountains, with an elevation variation of 2,363 to 5,596 m. The YRB belongs to the warm temperate plateau mountain monsoon climate with large temperature differences and distinct dry and wet seasons. The YRB is located in the southern margin of China’s temperate glacier area, and there are five glaciers in the basin, accounting for about 0.1 percent of the basin area. The URB (43°07ʹ0”–43°26ʹ0”N; 86°56ʹ0”–87°14ʹ0”E) has an area of 924 km2, with an elevation range of 1,670 m to 4,479 m, and located between the north slope of the Tianshan Mountains and the Junga’er Basin in northwest China. The climate is continental arid with large temperature difference between day and night, long winters, low temperatures, and dry summers. The URB is located on the north slope of the middle Tianshan Mountains in the continental glacier area of China. There are 155 glaciers in the basin, accounting for about 5 percent of the basin area. In the study, the runoff data of URB and YRB are from Yingxiongqiao and Mujiaqiao hydrological stations (HSs), respectively ().
Figure 1. Location of Urmuqi River Basin, Yanggong River Basin, and hydrological/meteorological stations.
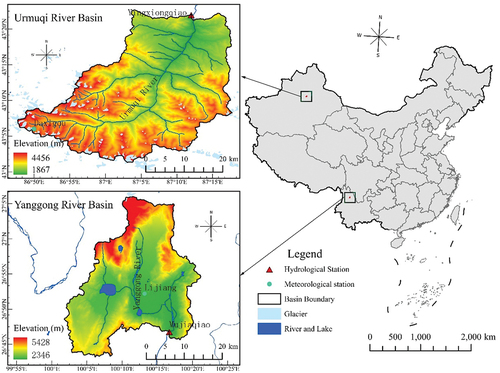
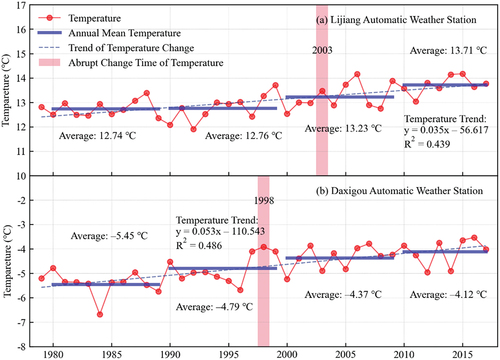
According to the meteorological observation data of the Lijiang and Daxigou automatic weather stations (AWSs) in the YRB and URB from 1979 to 2017 (), the annual average temperature in the two basins is 13.07°C and −4.72°C, and the highest and lowest temperatures are 24.6°C and 14°C, and −2.9°C and −31.8°C, respectively. The basins’ multiannual average, highest, and lowest precipitation are 958.52 and 255.23 mm, 1,283.4 and 380.8 mm, and 655 and 140.7 mm, respectively.
Data and methodology
Data sources
Considering the data availability, we used the following data to carry out the research (): (1) the measured annual and monthly runoff data of the Mujiaqiao HS in the YRB from 1979 to 2017; (2) the measured annual runoff data from 1979 to 2017 and monthly runoff data from 1979 to 2013 of the Yingxiongqiao HS in the URB; (3) the measured meteorological data of the Lijiang and Daxigou AWSs were used to represent the climate change of the YRB and URB, respectively, including daily precipitation and daily average temperature data of these two meteorological stations from 1979 to 2017; and (4) the mass balance data of the Baishui River Glacier No. 1 (BG1) on Yulong Snow Mountain and Urumqi Glacier No. 1 (UG1) from 1979 to 2017, the largest glaciers in the YRB and URB, were used as the glacier change data. The runoff data of the YRB are from the Lijiang Branch of Yunnan Hydrology and Water Resources Bureau and related articles (Fang et al. Citation2019); the runoff data of the URB are from the Yingxiongqiao HS and related articles (Ding et al. Citation2016); the meteorological data of the Lijiang and Daxigou AWSs are from the China Meteorological Data Network (http://data.cma.cn/), the mass balance data of the BG1 in the Yulong Snow Mountain were derived from the Yulong Snow Mountain Cryosphere and Sustainable Development Observation and Research Station (Yan et al. Citation2021), and the mass balance data of the UG1 were derived from the Tianshan Glacier Observation and Experiment Station of Chinese Academy of Sciences and related articles (Li et al. Citation2020).
Table 1. List of data sources in this study.
Methodology
Mann-Kendall test
Mann-Kendall test was used to analyze the runoff variability, climate factors, and glacier mass balance. Correlation analysis was used to study the relationship between runoff and climate factors. Among them, the Mann–Kendall method is a nonparametric statistical test method that can be used to test the change trend and the significance of the meteorological and hydrological data trend. For a time series x with n sample sizes, construct an order column:
(k = 2, 3, …, n)(1)
(j = 1, 2, …, i)
Under the assumption of random independence of the time series, the statistics are defined:
Where = 0,
,
are the mean and variance of the cumulative count
, when
,
, …,
is independent of each other and has the same continuous distribution, they can be calculated by the following formula:
is a standard normal distribution, which is distributed according to the time series x order
,
, …,
For the calculated statistic sequence, given the significance level α, check the normal distribution table, and if
, it shows that there is a significant trend change in the sequence.
In time series x reverse order ,
, …,
, and repeat the above process, while making
,
, n–1, …, 1,
.
Correlation analysis
In order to analyze the influences of climate and glacier factors on runoff, in this study we employed correlation test with the help of Statistical Package for Social Sciences Statistics 25 software. Since the influence factors are numerical type factors in the study, Pearson correlation coefficients are used to carry out the analysis. The formula is given below:
Where ρX, Y is the Pearson correlation coefficient of two continuous variables X and Y, cov (X,Y) is the covariance between the variables X and Y, and ơX and ơY are the standard deviations of the variables X and Y. The value of the correlation coefficient ρ is always between −1.0 and 1.0, close to 0 is called no correlation, and close to 1 or −1 is called strong correlation.
Results and analysis
Interannual runoff variation
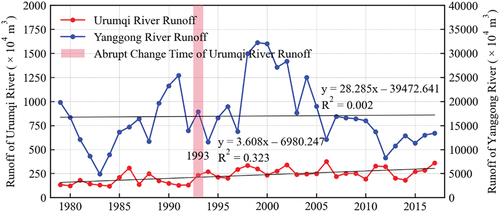
From 1979 to 2017, the average annual runoff in the YRB was about 1.69 × 10⁸ m3. The overall trend of annual runoff showed a nonsignificant increase, followed by a decrease, with the lowest value occurring in 1983 at 0.49 × 10⁸ m3 and the highest value reaching 3.22 × 10⁸ m3 in 1999 (Fang et al. Citation2019). After 2010, the Yanggong River’s runoff decreased to less than 1.5 × 10⁸ m3. The average annual runoff in the URB was approximately 0.02 × 10⁸ m3. The overall trend of annual runoff in the URB showed an increasing trend, with the minor value recorded in 1984 at 1.19 × 10⁶ m3 and the peak value registered in 2006 at 3.74 × 10⁶ m3. The results of the simple linear regression analysis indicate that from 1979 to 2016, the linear change rate of annual runoff in the YRB was about 0.028 × 10⁸ m3/10a (R2 = 0.002), and the linear change rate of annual runoff in the URB was about 0.004 × 10⁸ m3/10a (R2 = 0.323). According to the Mann–Kendall test, in the YRB, abrupt changes in annual runoff were not identified, and no significant overall increasing or decreasing trend was detected (Appendix Figure S1). Conversely, the URB experienced abrupt annual runoff changes in 1993, with a significant increasing trend observed from 1979 to 1990 and 1997 to 2017 (Appendix Figure S1). Overall, the URB shows a more pronounced increasing trend in annual runoff ().
Figure 2. Interannual variation of runoff in the Yanggong River Basin and Urmuqi River Basin from 1979 to 2017.
Inner year runoff change
The inner year allocation of runoff within the YRB displays unevenness, with a significant proportion of runoff during the flood season (from June to October), constituting over 70 percent of the total runoff. The monthly runoff showed a consistent fluctuating trend across different decades. From January through April, monthly runoff portrays a declining trajectory over different decades, succeeded by a substantial surge in runoff, peaking in August and September, and subsequently exhibiting a gradual descent. However, the timing of this peak monthly runoff varies among different decades. In the 1980s, the peak and trough occurred in September (0.24 × 10⁸ m3) and May (0.02 × 10⁸ m3). In the 1990s and 2000s, the highest values were observed from August to September (0.38 × 10⁸ m3 and 0.36 × 10⁸ m3), while the lowest values were recorded in April (0.05 × 10⁸ and 0.07 × 10⁸ m3). This suggests a recent shift of 1 month earlier for the occurrence of the minimum values. Furthermore, between 2010 and 2017, the trough of monthly runoff was observed in March (0.05 × 10⁸ m3). In contrast, the peak was recorded in July (0.21 × 10⁸ m3) (). The uneven distribution of runoff throughout the year and the progressively earlier occurrence of monthly runoff extremums may be related to the earlier melting of glacier and snow caused by rising temperatures (Fang et al. Citation2019; He et al. Citation2010).
Figure 3. Variations of monthly runoff in the Yanggong River Basin (a) and Urmuqi River Basin (b).
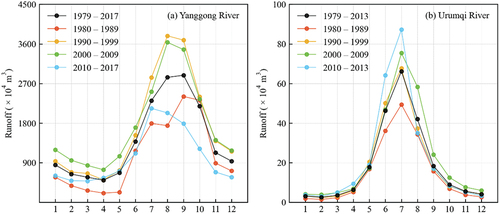
The inner year allocation of river runoff in the URB exhibits an unequal distribution, with the predominant flow occurring within the flood season (May to September), comprising more than 80 percent of the total runoff. As shown in , there is a consistent trend in runoff variation across different decades. There is a remarkable surge in monthly runoff observed from February to July during each decade, peaking in July and diminishing until the subsequent February, which represents the lowest point of the annual cycle. Furthermore, the peak monthly runoff values exhibit a persistent upward trend from the 1980s to 2010s. In the 1980s, the average July runoff stood at 49.41 × 10⁴ m3, whereas the average July runoff escalated to 87.20 × 10⁴ m3 from 2010 to 2013. Warming in the Tianshan Mountains has accelerated the melting of glaciers and snow in summer, consequently leading to an increasing trend in July runoff ().
Discussion
Impact of precipitation on runoff change
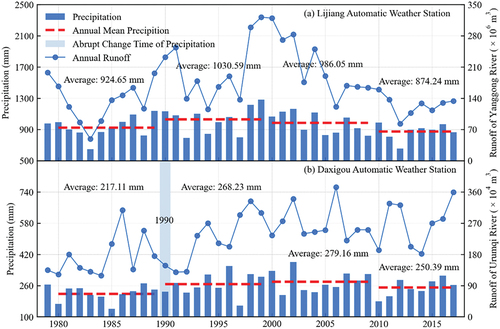
Precipitation is one of the main sources of watershed runoff, directly influencing its fluctuations. The annual precipitation from 1979 to 2017 at the Lijiang and Daxigou AWSs showed a nonsignificant trend of initial increase followed by a decrease (). The average annual precipitation of the Lijiang meteorological station stands at 958.52 mm, reaching its peak in 1999 at 1283.4 mm and hitting a minimum in 2012 at 655 mm. The average annual precipitation in the Daxigou AWS is 255.23 mm, with the highest value recorded in 2002 at 380.8 mm and the lowest in 1985 at 140.7 mm. The application of the Mann–Kendall test reveals that for the period between 1979 and 2017, the Lijiang AWS had no abrupt change in the annual precipitation, indicating no significant increasing or decreasing trend (Appendix Figure 2). Conversely, the abrupt changes in the annual precipitation of the Daxigou AWS occurred in 1990, and the significant increasing trend in annual precipitation extends from 1998 to 2010 (Appendix Figure 2).
Figure 4. Interannual variation of precipitation in the Lijiang and Daxigou automatic weather stations from 1979 to 2017.
The impact of precipitation on runoff is different in the YRB and URB. In the YRB, the variation trends of annual precipitation and runoff exhibit a remarkable concurrence (), accompanied by a significantly positive correlation (r = 0.84, p < .01). Monthly data analysis suggests a significant positive correlation between precipitation and runoff during the flood season of the YRB, spanning from May to October (r > 0.55, p < .01) (). This result underscores the pivotal role of precipitation, particularly during the flood season, in driving changes in runoff for the YRB. Conversely, in the URB, discernible distinctions appear in the trends of the annual precipitation and runoff (), with a very weak correlation observed between them (r = 0.173, p = .299). At the monthly level, a significant and meager positive correlation is detected solely between precipitation and runoff from July to September (flood season of the URB) and November (r < 0.45, p < .05) (). This suggests that, apart from precipitation, temperature may significantly influence runoff variations in the URB, thus implying that precipitation alterations may not be the primary driver of runoff changes in the URB.
Table 2. Pearson correlation coefficient between monthly runoff and meteorological factors in the Yanggong River Basin and Urmuqi River Basin.
Impact of temperature and glacier mass balance on runoff change
The impact of temperature on runoff change manifests through the increasing of runoff caused by the melting of glaciers and snow in the watershed due to rising temperatures. From 1979 to 2017, both stations showed an increasing trend in the annual average temperature (). The Lijiang AWS displayed a rate of change of 0.35°C/10a, while the Daxigou AWS experienced a higher rate of change at 0.53°C/10a. The average annual temperature at the Lijiang AWS stood at 13.07°C, reaching its minimum of 11.90°C in 1992, and its maximum of 14.17°C in 2015. The Daxigou AWS recorded an average annual temperature of −4.72°C, with the lowest temperature of −6.68°C occurring in 1984, and the highest temperature of −3.53°C in 2016. An abrupt change in the average annual temperature at the Lijiang AWS occurred in 2003, exhibiting a significant warming trend between 1979 and 2001, as well as 2005 and 2017 (Appendix Figure S3). The Daxigou AWS experienced an abrupt change in the average annual temperature in 1998, with a more significant warming trend observed from 1979 to 1995 and 2002 to 2017 (Appendix Figure S3). Remarkably, these two significant warming periods of the Daxigou AWS coincide closely with a significant increase in total runoff of the URB (from 1979 to 1990 and 1997 to 2017). This could mean that the accelerated melting of glaciers and snow caused by rising temperatures may significantly affect the increasing total runoff in the URB. In the YRB, temperature changes may not be the primary influence on runoff changes.
Figure 5. Interannual variation of temperature in the Lijiang and Daxigou automatic weather stations from 1979 to 2017.
Glaciers play an important role in replenishing and regulating watershed runoff. The liquid water resulting from glacier melting complements the watershed runoff affecting the change in watershed runoff. By utilizing data on the annual glacier mass balance changes of the BG1 and UG1, we investigated the impact of glacier changes on the YRB and URB runoff. Both the annual mass balances of the BG1 and UG1 show accelerated mass loss since 1979 ( and Appendix Figure 4S). The annual mass balance of the BG1 is about −778.16 mm/a, and the UG1 is about −487.5 mm/a. The mass balance of the BG1 has demonstrated more substantial annual fluctuations, and its melting was more vigorous than that of the UG1. Within the 1979 to 2002 period, the annual mass balance of the BG1 has shown an extremely substantial annual fluctuation, including glacier mass accumulation in some years. In 1979, the glacier mass loss in the BG1 totaled about 1,940.88 mm, representing the most significant loss from 1979 to 2017. In 1990, the glacier mass accumulation in the BG1 reached approximately 1,559.81 mm, indicating the most significant accumulation from 1979 to 2017. After 2003, the annual mass balance of the BG1 has shown negative values. In the UG1, starting around 1997, the accelerated melting caused a change rate of the annual mass balance to decrease from −246.59 mm/a from 1979 to 1996 to −694 mm/a from 1997 to 2017. The glacier mass loss increased to 1,327 mm in 2010,the highest for the period from 1979 to 2017. The cumulative mass balance of the BG1 and the UG1 from 1979 to 2017 reached −27,451.2 mm and −18,684.8 mm.
Figure 6. Interannual variation of mass balance in the Baishui River Glacier No. 1 and Urumqi Glacier No. 1 from 1979 to 2017.
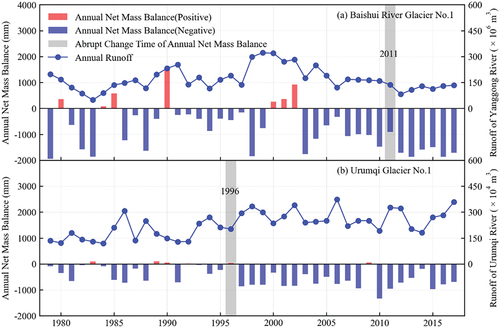
The impact of glacier mass balance on runoff differs significantly between the YRB and URB. The Mann–Kendall test indicates that abrupt change of annual mass balance in the BG1 occurred in 2011. It showed a more significant trend of mass loss from 1979 to 2008, as well as from 2016 to 2017. However, in the YRB, there was no noticeable trend of runoff increase or decrease. This result suggests that the replenishment and regulation effects of accelerated glacier melting on runoff in the YRB are minimal, and glacial meltwater does not play a dominant role in driving runoff changes. In contrast, the URB exhibits a consistent upward trend in runoff and glacier mass loss. The abrupt change of annual mass balance in the UG1 occurred in 1996; it showed a more significant trend of mass loss during 1979 to 1990, and from 2003 to 2017. These two time periods coincide very well with the periods of significant increasing runoff in the URB (from 1979 to 1990, and 1997 to 2017). It is evident that glacier melting plays a substantial role in driving changes in total runoff in the URB. The accelerated melting of glaciers may contribute significantly to the increased URB runoff.
To further substantiate the relationship between runoff and temperature/glacier mass balance, an analysis was conducted to examine the correlation between runoff and temperature/glacier mass balance in both the YRB and URB. In terms of annual data, there was a very weak correlation between runoff and temperature in the YRB (r = −0.12, p = .46), but there was a significant positive correlation between runoff in the YRB and mass balance of the BG1 at a low level (r = 0.38, p < .05). The decrease of runoff accompanies the accelerated melting of glaciers in the YRB. Typically, the accelerated melting of glaciers generally leads to increased runoff. In other words, as glacier mass loss intensifies, annual mass balance would decrease while runoff would increase, indicating a negative correlation between mass balance and runoff (Fang et al. Citation2019; He et al. Citation2010). This proves that, although the glacier melting in the YRB is more severe than that in the URB, due to the small glacier area, the dramatic glacier melting can no longer offset the runoff reduction effect caused by the decrease in precipitation. Consequently, the role of glaciers in replenishing and regulating runoff in the YRB has been lost.
The correlation analysis findings concerning the monthly average runoff and temperature in the YRB during the same period reveal (refer to ) that, in April, the driest month within the basin, a significant positive correlation exists between temperature and runoff (r = 0.42, p < .01). This indicates that the temperature change in April significantly influences runoff. It is speculated that this influence primarily stems from the elevated temperatures during this month, which result in increased glacier and snow melt, consequently leading to amplified runoff levels in April. This reflects the replenishing and regulating effects of glacier and snow melt water on runoff in the YRB, especially during dry periods. However, during the flood season in the YRB (from May to October), a significant negative correlation is observed between temperature and runoff, with correlation coefficients consistently exceeding 0.35. June and July display correlation coefficients that surpass the significance level of 0.01, while May, August, September, and October exhibit correlation coefficients surpassing the significance level of 0.05. The correlation between runoff and temperature is relatively weak in the remaining months. This once again confirms that the drastic glacier melting in the YRB can no longer offset the reduced runoff resulting from decreased precipitation, especially during the flood season. The capacity of glaciers to replenish and regulate runoff in the YRB has been lost.
Unlike the YRB, the URB displays a significant positive correlation between runoff and temperature (r = 0.493, p < .01), as well as a significant negative correlation between runoff and mass balance of the UG1 (r = −0.605, p < .01). It indicates that the accelerated melting of glaciers leads to an increase in runoff, and glacier mass balance is an essential factor in the URB’s runoff change. Glaciers’ replenishment and regulation effects on runoff in the URB are still markedly significant. The correlation analysis outcomes relating to the monthly runoff and temperature in the URB during the same period demonstrate () that there exists a significant positive correlation between temperature and runoff in April (r = 0.42, p < .01). This implies that the change in April temperature significantly influences runoff, possibly resulting from the rising temperatures during the month, which leads to increased glacier and snow melt, consequently leading to increasing runoff in April. In June and July (flood season), the URB shows a significant negative correlation between temperature and runoff (). This reflects continental glaciers’ replenishing and regulating effects on runoff in arid regions. Meanwhile, this also explains the reason for the increasing trend of summer runoff of the Urumqi River mentioned in Section 4.2; that is, accelerated glacier retreat has an important contribution to the increase of summer runoff of the Urumqi River.
Overall, precipitation change is the main factor affecting the runoff change in the YRB, especially the precipitation in the flood season. The effect of glaciers in replenishing and regulating runoff has been lost in the YRB. In the URB, increasing runoff is due to the combined contribution of increased precipitation, as well as accelerated melting of glacier and snow caused by rising temperatures. The effect of glaciers in replenishing and regulating runoff are still obvious in the URB.
Conclusions
This study took the YRB and the URB as the research sites, analyzed the change trends and abrupt change characteristics between 1979 and 2017 based on the Mann–Kendall test method, and researched the climate change and glacier change to runoff change by correlation analysis. The main conclusions were as follows:
1. From 1979 to 2017, the annual runoff in the YRB showed an insignificant trend of increasing first and then decreasing; the annual average runoff was about 1.69 × 10⁸ m3. The annual runoff in the URB showed a significant increasing trend; the average annual runoff was about 0.02 × 10⁸ m3. Overall, the URB showed a more pronounced increasing trend in annual runoff.
2. The annual allocation of runoff within the YRB and the URB displayed unevenness, with a significant proportion of runoff during the flood season (between May and October). Affected by glaciers and snow melting caused by climate warming, in the YRB, the extremal value of monthly runoff occurred earlier than before (minimum value from May of 1980s to March of 2010s, maximum value from September of 1980s to July of 2010s). The maximum value is decreased from 0.38 × 10⁸ m3 to 0.21 × 10⁸ m3. Compared with the YRB, the time of monthly runoff extremum in the URB did not change, but the peak value increased from 49.41 × 10⁴ m3 to 87.20 × 10⁴ m3.
3. In the global warming framework, both basins showed an increasing trend in annual average temperature; the temperature rise in the URB was faster than that in the YRB. The average annual temperature was about 13.07 and −4.72°C in the YRB and URB, respectively. The average annual precipitation was about 958.52 mm and 255.23 mm in the YRB and URB, respectively. The precipitation of the two basins did not show a significant increase or decrease trend.
4. Both annual and cumulative BG1 and UG1 mass balances showed accelerated mass loss since 1979. The mass balance of the BG1 showed a more substantial annual fluctuation, and the melting was more vigorous than the UG1. The effect of glacier melting on total runoff was weak in the YRB, while accelerated glacier melting may have a significant effect on total runoff in the URB.
5. The main influencing factor of runoff change in the YRB was the precipitation change during the flood season. The regulation function of the limited temperate glaciers on total runoff in the YRB may be very weak. The temperature rise caused the accelerated melting of the glacier and snow, which—in combination with the summer precipitation change—had a significant effect on the increase of runoff in the URB.
In light of the above, regarding continental glacial basins with many glaciers, the regulation function of glaciers on total runoff is still significant. In basins where glacier distribution is very limited, the effect of glacier regulation is very weak.
Supplemental Material
Download Zip (763.4 KB)Acknowledgments
The authors thank the editors and the anonymous reviewers for all their helpful discussions and advice. The authors also thank Dr. Yan Xingguo, Dr. Cheng Wenju, and Dr. Wu Rui of the Northwest Institute of Ecology and Environmental Resources, Chinese Academy of Sciences, for their many helpful suggestions during the revision of this article.
Disclosure statement
No potential conflict of interest was reported by the author(s).
Supplementary material
Supplemental data for this article can be accessed online at https://doi.org/10.1080/15230430.2024.2356671
Additional information
Funding
References
- Aizen, V. B., E. M. Aizen, and V. A. Kuzmichonok. 2007. Glaciers and hydrological changes in the Tien Shan: Simulation and prediction. Environmental Research Letters 2 (4):10. doi:10.1088/1748-9326/2/4/045019.
- Ayala, Á., D. Farías-Barahona, M. Huss, F. Pellicciotti, J. McPhee, and D. Farinotti. 2020. Glacier runoff variations since 1955 in the Maipo River Basin, in the semiarid Andes of central Chile. The Cryosphere 14 (6):2005–12. doi:10.5194/tc-14-2005-2020.
- Barnett, T. P., J. C. Adam, and D. P. Lettenmaier. 2005. Potential impacts of a warming climate on water availability in snow-dominated regions. Nature 438 (7066):303–9. doi:10.1038/nature04141.
- Bliss, A., R. Hock, and V. Radic. 2014. Global response of glacier runoff to twenty-first century climate change. Journal of Geophysical Research: Earth Surface 119 (4):717–30. doi:10.1002/2013jf002931.
- Braun, M. H., P. Malz, C. Sommer, D. Farías-Barahona, T. Sauter, G. Casassa, A. Soruco, et al. 2019. Constraining glacier elevation and mass changes in South America. Nature Climate Change 9 (2): 130–+. doi:10.1038/s41558-018-0375-7.
- Chen, H. Y., Y. N. Chen, W. H. Li, and Z. Li. 2019. Quantifying the contributions of snow/glacier meltwater to river runoff in the Tianshan Mountains, Central Asia. Global and Planetary Change 174:47–57. doi:10.1016/j.gloplacha.2019.01.002.
- Chen, R. S., E.-S. Kang, S.-H. Lu, X.-B. Ji, Z.-H. Zhang, Y. Yang, W.-W. Qing, et al. 2008. A distributed water-heat coupled model for mountainous watershed of an inland river basin in northwest China (II) using meteorological and hydrological data. Environmental Geology 55 (1):17–28. doi:10.1007/s00254-007-0960-y.
- Ding, Y., and S. Zhang. 2015. The hydrological impact of cryosphere water cycle on global-scale water cycle. Chinese Science Bulletin 60 (7):593–602.
- Ding, Y., and S. Zhang. 2018. Study on water internal recycle process and mechanism in typical mountain areas of inland basins, northwest China: Progress and challenge. Advances in Earth Sciences 33 (7):719–27. doi:10.11867/j.issn.1001-8166.2018.07.0719.
- Ding, Y., S. Zhang, and R. Chen. 2020. Cryospheric hydrology: Decode the largest freshwater reservoir on earth. Bulletin of the Chinese Academy of Sciences 35 (4):414–24.
- Ding, C. F., H.-F. Zhang, Y.-Q. Geo, Y.-L. Zhu, D. Baoerhan, W.-T. Li, and X. Li. 2016. Quantitative analysis of hydrological response to forestchanges in the middle of the Tianshan Mountains: A case study of the Urumqi River Basin. Journal of Natural Resources 31 (12):2034–46. doi:10.11849/zrzyxb.20160099.
- Dussaillant, I., E. Berthier, F. Brun, M. Masiokas, R. Hugonnet, V. Favier, A. Rabatel, et al. 2019. Two decades of glacier mass loss along the Andes. Nature Geoscience 12 (10):803. doi:10.1038/s41561-019-0432-5.
- Fang, J., T. Pu, X. Shi, S. Wang, and H. Niu. 2019. Runoff variation and its influence factors in the Yanggong River Basin of Mt. Yulong region due to climate change. Journal of Glaciology and Geocryology 41 (2):268–74. doi:10.7522/j.iss.1000-0240.2019.0312.
- Farias-Barahona, D., S. Vivero, G. Casassa, M. Schaefer, F. Burger, T. Seehaus, P. Iribarren-Anacona, et al. 2019. Geodetic mass balances and area changes of Echaurren Norte Glacier (Central Andes, Chile) between 1955 and 2015. Remote Sensing 11 (3):17. doi:10.3390/rs11030260.
- Farias-Barahona, D., R. Wilson, C. Bravo, S. Vivero, A. Caro, T. E. Shaw, G. Casassa, et al. 2020. A near 90-year record of the evolution of El Morado Glacier and its proglacial lake, Central Chilean Andes. Journal of Glaciology 66 (259):846–60. doi:10.1017/jog.2020.52.
- Gao, X., B. S. Ye, S. Q. Zhang, C. J. Qiao, and X. W. Zhang. 2010. Glacier runoff variation and its influence on river runoff during 1961-2006 in the Tarim River Basin, China. Science China Earth Sciences 53 (6):880–91. doi:10.1007/s11430-010-0073-4.
- Gardelle, J., E. Berthier, Y. Arnaud, and A. Kaab. 2013. Region-wide glacier mass balances over the Pamir-Karakoram-Himalaya during 1999–2011. Cryosphere 7 (4):1263–86. doi:10.5194/tc-7-1263-2013.
- Han, P. F., D. Long, F. Y. Zhao, and L. J. Slater. 2023. Response of two glaciers in different climate settings of the Tibetan Plateau to climate change through year 2100 using a hybrid modeling approach. Water Resources Research 59 (4):22. doi:10.1029/2022wr033618.
- He, Q. L., X. X. Kuang, E. Z. Ma, J. X. Chen, Y. Q. Feng, and C. Zheng. 2023. Reconstructing runoff components and glacier mass balance with climate change: Niyang River Basin, southeastern Tibetan plateau. Frontiers in Earth Science 11:18. doi:10.3389/feart.2023.1165390.
- He, Y. Q., T. Pu, Z. Li, G. Zhu, S. Wang, N. Zhang, S. Wang, et al. 2010. Climate change and its effect on annual runoff in Lijiang Basin-Mt. Yulong Region, China. Journal of Earth Science 21 (2):137–47. doi:10.1007/s12583-010-0012-5.
- Huss, M. 2011. Present and future contribution of glacier storage change to runoff from macroscale drainage basins in Europe. Water Resources Research 47 (7):14. doi:10.1029/2010wr010299.
- Huss, M., and R. Hock. 2018. Global-scale hydrological response to future glacier mass loss. Nature Climate Change 8 (2):135. doi:10.1038/s41558-017-0049-x.
- Immerzeel, W. W., A. F. Lutz, M. Andrade, A. Bahl, H. Biemans, T. Bolch, S. Hyde, et al. 2020. Importance and vulnerability of the world’s water towers. Nature 577 (7790):364–+. doi:10.1038/s41586-019-1822-y.
- Immerzeel, W. W., L. P. H. van Beek, and M. F. P. Bierkens. 2010. Climate change will affect the Asian water towers. Science 328 (5984):1382–5. doi:10.1126/science.1183188.
- Jia, Y. F., Z. Li, S. Jin, C. Xu, H. Deng, and M. Zhang. 2020. Runoff changes from Urumqi Glacier No. 1 over the Past 60 Years, Eastern Tianshan, Central Asia. Water 12 (5):15. doi:10.3390/w12051286.
- Jiang, P., Z. M. Wang, B. Y. Yan, S. T. Ai, and S. Jin. 2022. Changes in the Runoff of Urumqi Glacier No. 1 Under Climate Change: From Historical Observation to Future Prediction. Frontiers in Earth Science 10:13. doi:10.3389/feart.2022.920768.
- Kaser, G., M. Grosshauser, and B. Marzeion. 2010. Contribution potential of glaciers to water availability in different climate regimes. Proceedings of the National Academy of Sciences 107 (47):20223–7. doi:10.1073/pnas.1008162107.
- Kumar, A., T. Yang, and M. P. Sharma. 2019. Long-term prediction of greenhouse gas risk to the Chinese hydropower reservoirs. Science of the Total Environment 646:300–8. doi:10.1016/j.scitotenv.2018.07.314.
- Li, Z. Q., H. K. Li, C. H. Xu, Y. F. Jia, P. Y. Wang, and X. Y. Yue. 2020. 60-year changes and mechanisms of Urumqi Glacier No. 1 in the eastern Tianshan of China, Central Asia. Sciences in Cold and Arid Regions 12 (6):380–8. doi:10.3724/sp.J.1226.2020.00380.
- Liu, S., X. Y. Yao, W. Q. Guo, J. L. Xu, D. H. Shangguan, J. F. Wei, W. J. Bao, and L. Z. Wu. 2015. The contemporary glaciers in China based on the second Chinese Glacier Inventory. Acta Geographica Sinica 70 (1):3–16.
- Malmros, J. K., S. H. Mernild, R. Wilson, J. C. Yde, and R. Fensholt. 2016. Glacier area changes in the central Chilean and Argentinean Andes 1955-2013/14. Journal of Glaciology 62 (232):391–401. doi:10.1017/jog.2016.43.
- Pörtner, H.-O., D. C. R. V. Masson-Delmotte, P. Zhai, M. Tignor, E. Poloczanska, K. Mintenbeck, A. Alegría, et al., eds. 2019. IPCC, 2019: IPCC Special Report on the Ocean and Cryosphere in a Changing Climate. Cambridge, UK and New York: Cambridge University Press.
- Radic, V., and R. Hock. 2014. Glaciers in the earth’s hydrological cycle: Assessments of glacier mass and runoff changes on global and regional scales. Surveys in Geophysics 35 (3):813–37. doi:10.1007/s10712-013-9262-y.
- Tanguang, T. G., K. Shichang, L. Cuo, Z. Tingjun, Z. Guoshuai, Z. Yulan, and M. Sillanpää. 2015. Simulation and analysis of glacier runoff and mass balance in the Nam Co Basin, southern Tibetan Plateau. Journal of Glaciology 61 (227):447–60. doi:10.3189/2015JoG14J170.
- Veal, A. J. 2021. Climate change 2021: The physical science basis, 6th report. World Leisure Journal 63 (4): 443–4. doi:10.1080/16078055.2021.2008646.
- Wang, X. Y., T. Yang, C.-Y. Xu, L. Xiong, P. Shi, and Z. Li. 2020. The response of runoff components and glacier mass balance to climate change for a glaciated high-mountainous catchment in the Tianshan Mountains. Natural Hazards 104 (2):1239–58. doi:10.1007/s11069-020-04212-4.
- Wang, S., T. D. Yao, L. D. Tian, and J. C. Pu. 2017. Glacier mass variation and its effect on surface runoff in the Beida River catchment during 1957–2013. Journal of Glaciology 63 (239):523–34. doi:10.1017/jog.2017.13.
- Wang, L., F. Zhang, S. Nepal, Y. X. Xiang, H. D. Tang, X. N. Shi, C. Zeng, I. Ahmad, and Z. B. Yu. 2023. Response of runoff processes to temperature rise in basins with different glacier ratios in the monsoon-influenced southern Tibetan Plateau. Journal of Hydrology: Regional Studies 45:16. doi:10.1016/j.ejrh.2022.101299.
- Wu, H., M. Xu, Z. Y. Peng, and X. P. Chen. 2022. Quantifying the potential impacts of meltwater on cotton yields in the Tarim River Basin, Central Asia. Agricultural Water Management 269:14. doi:10.1016/j.agwat.2022.107639.
- Xin, J. L., X. Sun, L. Liu, H. Li, X. Liu, X. Li, L. Cheng, et al. 2021. Quantifying the contribution of climate and underlying surface changes to Alpine runoff alterations associated with glacier melting. Hydrological Processes 35 (3):26. doi:10.1002/hyp.14069.
- Xu, M., P. S. Wang, H. Wu, and S. C. Kang. 2023. Different patterns of changes in glacier mass balance and glacier runoff over the Tarim Basin, Central Asia. Hydrological Processes 37 (10):20. doi:10.1002/hyp.14997.
- Yan, X. G., J. Z. Ma, X. Y. Ma, S. J. Wang, P. Y. Chen, and Y. Q He. 2021. Accelerated glacier mass loss with atmospheric changes on Mt. Yulong, Southeastern Tibetan Plateau. Journal of Hydrology 603:13. doi:10.1016/j.jhydrol.2021.126931.
- Yao, R. Z., S. H. Li, and D. L. Chen. 2023. Runoff response to climate in two river basins supplied by small glacier meltwater in southern and northern Tibetan Plateau. Atmosphere 14 (4):16. doi:10.3390/atmos14040711.
- Zhang, Z. H., S. F. Deng, Q. D. Zhao, S. Q. Zhang, and X. W. Zhang. 2019a. Projected glacier meltwater and river run-off changes in the Upper Reach of the Shule River Basin, north-eastern edge of the Tibetan Plateau. Hydrol. Process 33, no. 7:1059–74. doi:10.1002/hyp.13384.
- Zhang, S. Q., X. Gao, and X. W. Zhang. 2015a. Glacial runoff likely reached peak in the mountainous areas of the Shiyang River Basin, China. Journal of Mountain Science 12 (2):382–95. doi:10.1007/s11629-014-3077-2.
- Zhang, Y., Y. Hirabayashi, Q. Liu, and S. Y. Liu. 2015b. Glacier runoff and its impact in a highly glacierized catchment in the southeastern Tibetan Plateau: Past and future trends. Journal of Glaciology 61 (228):713–30. doi:10.3189/2015JoG14J188.
- Zhang, Z. Y., L. Liu, X. L. He, Z. Q. Li, and P. Y. Wang. 2019b. Evaluation on glaciers ecological services value in the Tianshan Mountains, Northwest China. Journal of Geographical Sciences 29 (1):101–14. doi:10.1007/s11442-019-1586-1.
- Zhang, Y. Q., Y. Luo, L. Sun, S. Liu, X. Chen, and X. I. Wang. 2016. Using glacier area ratio to quantify effects of melt water on runoff. Journal of Hydrology 538:269–77. doi:10.1016/j.jhydrol.2016.04.026.
- Zhao, Q. D., Y. Ding, J. Wang, H. Gao, S. Zhang, C. Zhao, J. Xu, et al. 2019. Projecting climate change impacts on hydrological processes on the Tibetan Plateau with model calibration against the glacier inventory data and observed streamflow. Journal of Hydrology 573:60–81. doi:10.1016/j.jhydrol.2019.03.043.