
 ?Mathematical formulae have been encoded as MathML and are displayed in this HTML version using MathJax in order to improve their display. Uncheck the box to turn MathJax off. This feature requires Javascript. Click on a formula to zoom.
ABSTRACT
Glaciers in Afghanistan are crucial elements for water resource and summer river flows. They are also threatened by rapid climate warming. This study presents an up-to-date assessment of ice cover loss for the entire country over two periods, 2000–2008 and 2008–2020, using newly developed remote sensing indices that include a more reliable determination of changing debris cover. The results suggest an estimated ice-covered area of 2,684 ± 101 km2 in 2020, that was 75 ± 0.7% clean ice and 25 ± 3.0 percent debris-covered ice. Total ice-covered area retreated by −0.15 ± 0.01 percent yr−1 between 2000 and 2008 and −0.43 ± 0.05 percent yr−1 between 2008 and 2020. Notably, 60 percent of ice cover loss (2000–2020) related to ice cover extents with a size ≤ 2.5 km2, comprising 60 percent of the total ice-covered area in 2000. Higher altitude accumulation zones also exhibited mass loss. However, there was also substantial spatial variation in these rates of loss based on geographical region, glacier size, and climate zones. In the north-eastern regions that are geographically close to or part of the north-west Karakoram ice cover was declining at a substantially lower rate, stable, or even increasing slightly, as compared with the northern and central regions of Afghanistan.
Introduction
Glaciers play a crucial role in the hydrological cycle (Viviroli, Weingartner, and Messerli Citation2003; Kaser, Großhauser, and Marzeion Citation2010; Sorg et al. Citation2012; Yao et al. Citation2022), notably in arid environments where they provide water for irrigation during summer when it is most needed (Hagg et al. Citation2007; Sorg et al. Citation2012; Rounce, Hock, and Shean Citation2020). Global warming is leading to glacier retreat and enhanced summer runoff in the short-term, forecast to continue until glaciers become small enough that this “glacial subsidy” ends and summer runoff is reduced (Rees and Collins Citation2006; Scherler, Bookhagen, and Strecker Citation2011; Khanal et al. Citation2021). A decline and eventual end of glacier melt in the Hindu Kush Himalaya (HKH) region is likely to impact water supply to the 1.3 billion people living downstream (Williams Citation2013; Wahid et al. Citation2014; Quincey et al. Citation2018; Rowan et al. Citation2018; Pritchard Citation2019; Yao et al. Citation2022). This will particularly be the case for those not benefitting from the South Asian summer monsoon (Wahid et al. Citation2014; Pritchard Citation2019; Chowdhury et al. Citation2021). However, whilst it has been observed that most HKH glaciers retreated during the last century (Bolch et al. Citation2012; Azam et al. Citation2018; Shukla et al. Citation2020; Agarwal et al. Citation2023), there is substantial within-HKH variation in the response of glaciers to climate warming. For this reason, quantifying and explaining glacier change within different regions of the HKH is of paramount importance.
There are two broad reasons why a regional focus is needed. First, the response of HKH glaciers to climate change is regionally complex (Wiltshire Citation2014; You et al. Citation2017). Large-scale generalizations may overlook within-region differences in glacier mass balance and runoff which in turn may cause regional differences in water resource impacts (Garg et al. Citation2021). For instance, the eastern-most sites of the Himalaya are strongly influenced by the Indian and southeast Asian summer monsoons, and ice accumulation tends to be driven by summer precipitation (Ageta and Higuchi Citation1984; Fujita Citation2008). Monsoon-type glaciers are expected to be more sensitive to climate warming than winter-accumulation type glaciers as they may be more impacted by a rise in the rain/snow limit driven by an increase in temperature (Fujita Citation2008). This shift may be exacerbated by albedo feedback if reduced summer snow accumulation on glaciers then reduces summer albedo and so enhances melt (Gardelle et al. Citation2013). On the other hand, continuous retreat has been reported in the Central Himalaya (Ren et al. Citation2004, Citation2006) and for 65 percent of monsoon-influenced glaciers in the greater Himalaya (between 2000 and 2008; Scherler, Bookhagen, and Strecker Citation2011). Toward the northwest (the Pamirs, the Hindu Kush, and the Karakoram), the climate is dominated by westerly air masses and glaciers are of more of the winter-accumulation type. Westerly rainfall-influenced glaciers in the same region advanced or were stable in more than 50 percent of cases (Scherler, Bookhagen, and Strecker Citation2011; Azam et al. Citation2018; Garg et al. Citation2023a). In addition, there is increasing evidence that glacier response to climate change can be influenced by more local factors. It appears that smaller glaciers (<1 km2) are losing a higher percentage of area than larger glaciers for the same time-period, whereas longer valley glaciers covered with thick debris appear to be losing area more slowly (Racoviteanu et al. Citation2014). Chowdhury et al. (Citation2021) investigated glacier evolution in the Sikkim Himalaya, India, and found that the maximum glacier area shrinkage is associated with glaciers with lower terminus elevations and on the lower slopes of large valley glaciers compared to other glaciers. This emphasizes the need to consider regionally variable climate influences when quantifying climate warming impacts on HKH glaciers.
Second, HKH glacier response may be conditioned by the development of extensive debris-covered ice, notably in ablation zones, and associated with large volumes of ice avalanche and rock fall onto glacier surfaces from steep surrounding slopes (Rounce et al. Citation2018, Citation2021; McCarthy et al. Citation2022). Globally, 7.3 percent of mountain glacier areas are debris-covered rising to 12.6% in at the scale of south-west Asia (Scherler, Wulf, and Gorelick Citation2018; Herreid and Pellicciotti Citation2020). Knowledge of debris cover distribution on glaciers is important as glacier retreat tends to be most rapid for glaciers without debris cover (Marzeion, Jarosch, and Hofer Citation2012; Radìc et al., Citation2014; Huss and Hock Citation2015; Hock et al. Citation2019; Marzeion et al. Citation2020; Anderson et al. Citation2021). Although this is a complex process (Nicholson and Benn Citation2013; Gibson et al. Citation2017), debris accumulation alters the surface energy balance (Anderson and Mackintosh Citation2012; Collier et al. Citation2015) an effect that is strongly dependent on debris thickness (Kraaijenbrink et al. Citation2017; Mölg et al. Citation2018; Scherler, Wulf, and Gorelick Citation2018; Nie et al. Citation2021). Up until a few centimeters thick, debris cover reduces albedo and so enhances melt (Östrem Citation1959; Kayastha et al. Citation2000; Nicholson and Benn Citation2006; Kääb et al. Citation2012; Reid and Brock Citation2014; Evatt et al. Citation2015; Pratap et al. Citation2015; Anderson and Anderson Citation2016; Vincent et al. Citation2016). Above a certain thickness, debris cover begins to insulate the ice (Östrem Citation1959). Debris extent and thickness is dynamic in time and space (Mölg et al. Citation2018; Scherler, Wulf, and Gorelick Citation2018; Nie et al. Citation2021; Garg et al. Citation2023b). The formation of a substantial debris cover on glaciers has the capacity to extend their lifespan, thereby enhancing the sustained availability of water resources in the long term (Lardeux et al. Citation2016; Zhang et al. Citation2019), an issue that has not been fully addressed in studies on future water resources or glacier lifetimes (Zemp et al. Citation2006; Bates, Kundzewicz, and Wu Citation2008; Farinotti, Pistocchi, and Huss Citation2016; Shannon et al. Citation2019). It also may contribute to regional variation in glacier response to climate warming. For instance, Shokory and Lane (Citation2023) quantified systematic geographical variation in debris cover for Afghanistan glaciers and found that this variation was related to broad-scale climatological and geological influences. Information on changing debris extent needs to be included in large-scale glacier inventories (Kraaijenbrink et al. Citation2017; Mölg et al. Citation2018).
Given these two complexities, a comprehensive and methodologically consistent sub-regional analysis of changes in glacier size, altitude, debris-cover evolution, and glacier melt for all regions of the HKH in the early 21st century is so far missing (Scher, Steiner, and McDonald Citation2021). Here, we focus on Afghanistan in the northwestern HKH. In Afghanistan, the combination of conflict and political tensions has made field-based research difficult, long-term monitoring almost non-existent, and the curation of datasets describing glacier response to climate change very rare. Glacier down-wasting and retreat has been reported (Shroder and Bishop Citation2010; Bishop et al. Citation2014). However, only one glacier in Afghanistan, the Mir Samir located in the central part of the country, has ever had any mass balance work done on it (in 1965), and it has now retreated to the extent that it has divided into two distinct ice masses (Bishop et al. Citation2014). Maharjan et al. (Citation2018) initiated the first updated glacier inventory of Afghanistan with assessment of changes between 1990 and 2015 using remote sensing. They found that over a 25-year period, glacier cover decreased by 13.4% with an average decrease of 5.4% per decade. However, they did not undertake a systematic study of how both ice and debris-cover is changing in Afghanistan (Shokory and Lane Citation2023), nor did they report sub-regional variations in glacier response. Therefore, the aim of our study is to make use of a new method for deriving inventories of ice cover from remotely sensed data, that explicitly quantifies both bare and debris-covered ice (Shokory and Lane Citation2023), to quantify the regional decadal-scale patterns of ice loss and debris cover development in the entire area of the Afghanistan HKH (AHKH). Here, following Shokory and Lane (Citation2023), we refer to “ice cover” rather than “glacier” to reflect clear evidence that as glaciers retreat they can produce zones of debris-covered ice that are disconnected from a glacier. Whether or not such zones are glacier or not is a conceptual debate that is beyond this article.
The study uses datasets compiled for three dates (2000, 2008, and 2020) to test the following hypotheses:
The complexity of Afghanistan’s mountain regions is such that substantial variation in ice cover characteristics (altitude, debris cover etc.; Shokory and Lane Citation2023) translates into substantial variation in ice mass response to climate warming. For instance, local factors including ice cover extent, size, and altitude effects interact with local climate variability to drive the complexity of glacier response to climate change (Racoviteanu et al. Citation2014; Chowdhury et al. Citation2021; Shokory and Lane Citation2023).
Development of debris cover in response to negative mass balance is reducing the sensitivity of the cryosphere to climate change in Afghanistan through time (Bishop et al. Citation2014).
Study area
Afghanistan is a mountainous country () dominated by the Hindu Kush mountain range extending from the northeast to the southwest and covering one third of the country (Shroder Citation2014). Afghanistan has arid and semi-arid continental climates, characterized by temperature and precipitation regimes with distinct characteristic of deserts, steppe, and highland environments (Humlum, Køie, and Ferdinand Citation1959; Shroder Citation2014). Unlike other parts of the Himalaya, Afghanistan receives snowfall mainly in the winter from the westerlies that originate as Mediterranean cyclonic systems and that move eastwards (Shokory, Schaefli, and Lane Citation2023). Only the most center-east part of the country receives summer monsoon associated with the Intertropical Convergence Zone (ITCZ) (Shroder Citation2014; Shokory et al. Citation2017, Citation2023) causing occasional snowfall during summer over the highest mountain peaks.
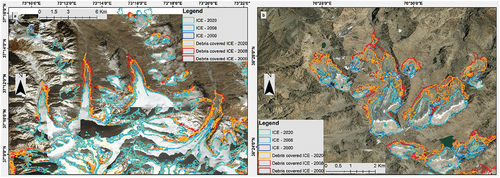
Figure 1. (a) The main glaciated regions (A – north-eastern, B – northern, C – central, and D – central-western) and sub regions (numbered from 1–18). (b) Elevation map with main ice cover regions in the dataset. (c) Gridded mean annual precipitation data extracted from the Climate Hazards Group InfraRed Precipitation with Station (CHIRPS) dataset https://www.chc.ucsb.edu/data/chirps). (d) Gridded daily mean temperature extracted from ERA5 dataset (the fifth generation European Centre for Medium-Range Weather Forecasts (ECMWF) atmospheric reanalysis of the global climate https://cds.climate.copernicus.eu/cdsapp#!/dataset/). The location of the main regions on the map of Afghanistan is referenced in Figure 1S (Supplementary materials).
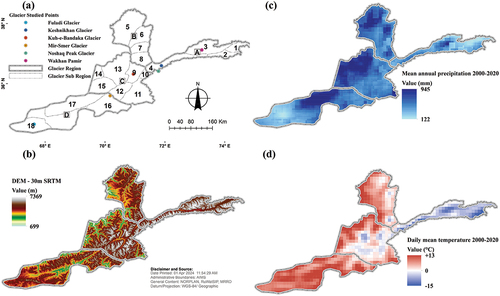
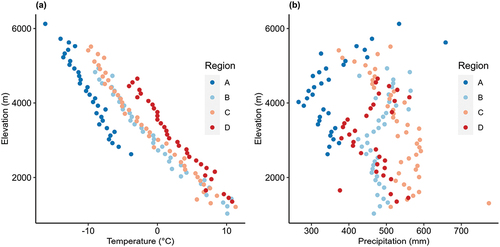
Zones of ice cover in Afghanistan are primarily centered on the north-east of the country (), and here we consider ice cover in four regions shown in : (A) north-eastern, (B) northern, (C) central, and (D) central-western Afghanistan, identified based on geographical locations and climates (Shokory and Lane Citation2023). Within the four focus regions, we also identified sub-regions within the main regions based on the difference in elevation range and topographic separation by valleys (), the sub-regions were utilized primarily as a means to visually and geographically illustrate the results of our study, facilitating a more comprehensive interpretation of the observed glacier changes (). The four distinct regions, each exhibiting unique precipitation and temperature characteristics as derived from gridded datasets segmented by elevation bands (). Region A is characterized by colder mean annual temperatures, consistently below zero degrees Celsius, indicative of its higher elevation and colder climate. Regions B and C exhibit progressively warmer temperatures compared to Region A, with Region D showing the warmest temperatures among the four regions (). Conversely, precipitation patterns vary across the study area. Region A is distinguished by lower mean annual precipitation levels, reflecting its colder and potentially drier climate due to higher elevations. In contrast, Regions B and C experience higher mean annual precipitation, likely influenced by their lower elevations and proximity to moisture sources.
Figure 2. (a) Daily mean temperature variations (°C) across elevation bands. (b) Mean annual precipitation variations (mm) across elevation bands. The variations are shown for the four glaciated regions of Afghanistan (see ).
Materials and methods
Datasets
Shokory and Lane (Citation2023) provide a full description of the datasets used and only a summary is provided here. The method uses Landsat data obtained from the United States Geological Survey (USGS) (http://earthexplorer.usgs.gov/) (the list of all Landsat scenes used in this study is provided as supplementary material ). The bands used were blue-B2, near infrared (NIR)-B5, shortwave Infrared (SWIR)-B6, panchromatic (PAN)-B8, and thermal (TIR)-B10. The B2 and B5 bands have 30 m resolution, the B8 band 15 m resolution, and the B10 band 100 m resolution (downscaled to 30 m by the provider). Digital elevation models (DEMs) were used to calculate geometrical parameters for the ice cover zones (elevation and length). Lengths were determined in ArcGIS as the largest value of the convex hull of each ice-covered zone. DEMs were provided by the Department of Statistics, Ministry of Agriculture Irrigation and Livestock of Afghanistan (MAIL Citation2020) with resolutions of 5 m or 10 m (according to region). In areas where no Afghan DEMs were available, we used 30 m resolution DEMs downloaded from the Advanced Land Observing Satellite (ALOS) global digital surface model (https://www.eorc.jaxa.jp/ALOS/en/aw3d30/data/index.htm).
Table 1. Area of bare ice and debris cover ice at different time steps and regions (undefined units are in km2).
Indices for mapping clean ice and debris-covered ice
This article applies the indices developed by Shokory and Lane (Citation2023) to determine the extent of clean ice and of debris-covered ice. Shokory and Lane (Citation2023) developed and tested them with field data and published clean ice and debris-covered ice outlines for all ice-covered zones in Afghanistan for 2016. They used the associated inventory to describe the broad geographical controls on the distribution of clean ice and debris-covered ice. This article applies the same methods but to a sequence of dates: 2000, 2008, and 2020. These dates were chosen based on the availability of data during the ablation season. For each year, visual testing was conducted to select images with minimal cloud coverage, no snow in the ablation zone (due to summer snowfall), and comprehensive spatial coverage of all glaciated regions.
The Shokory and Lane (Citation2023) approach () is pixel-based and only a summary is provided here. The Landsat 7 Scan Line Corrector (SLC) gaps were filled using ENVI v5.1 software, using a single file gap fill triangulation approach (https://yceo.yale.edu/how-fill-gaps-landsat-etm-images). For mapping clean ice, we used the NIR to SWIR band ratio that allows ice to be detected including under shadow (Paul et al. Citation2002; Taschner and Ranzi Citation2002; Paul Citation2003; Paul, Huggel, and Kääb Citation2004; Bolch and Kamp Citation2005; Shukla, Arora, and Gupta Citation2010; Bhardwaj et al. Citation2014; Kozhikkodan, Citation2014; Shokory and Lane et al. Citation2023). Following Shokory and Lane (Citation2023), a band ratio threshold of ≥ 3 was used to define clean ice. Two types of debris-covered ice are mapped based on two different thermal indices (Shokory and Lane Citation2023). The first (debris class 1, C1) is based upon combination of thermal (TIR) and panchromatic (PAN) bands (Equationeq. 1)(1)
(1) . The principle behind this combination is that the TIR band is most likely to have the temperature signal that is needed to allow identification of debris-covered ice. However, the TIR band is coarse (100 m, downscaled by the provider to 30 m). The PAN band is 15 m and, while it is theoretically less sensitive to thermal properties ice (Shokory and Lane Citation2023), it provides a means of downscaling the coarser TIR band to the resolution needed for mountain valley glaciers (Equationeq. 1)
(1)
(1) . In this article, a range of 0 to −0.37 is used to define debris-covered ice (Shokory and Lane Citation2023):
Figure 3. Methodological workflow used in this study.
Second, the NIR to Blue band ratio was used (Equationeq. 2)(2)
(2) for the second class of debris-covered ice (debris class 2, C2), with no TIR signal (at a specific threshold range) and commonly covered by detrital sedimentary rocks (mainly sandstone, siltstone, argillite, shale) (Shokory and Lane Citation2023):
Debris-covered ice was defined for the range 0.70 to 0.92 as used by Shokory and Lane (Citation2023).
Validation tests of the accuracy of these indices gave a 98 percent overall accuracy and a 0.92 Kappa coefficient (Shokory and Lane Citation2023).
Approach to analysis
This article focuses on ice cover change for two time periods 2000–2008 and 2008–2020. For change detection, we mapped ice covered zones onto 2,409 watersheds that were delineated in ArcGIS. As such, zones can change shape and area rapidly through time, using a watershed level accounted for fragmentation of individual zones of ice cover as ice mass was lost. Watersheds were then grouped into 18 sub-regions (), and basic statistics (mean, minimum, maximum) were calculated.
Sources of uncertainties
We used the omission and commission errors (±1% for clean ice and ±12 percent for debris-covered ice) as proportional uncertainties following the data quality assessment reported in Shokory and Lane (Citation2023). A second source of uncertainty was associated with zones covered by cloud as well as those affected by the Landsat image SLC gap area for images between 2000 and 2008. Zones that were visually identified as significantly affected by snow or cloud cover in any one year were excluded from consideration for all years (see discussion). Smaller snow patches that were incorrectly identified as ice were removed by assuming that all areas mapped as ice with a size smaller than 0.01 km2 were not truly ice cover. For all other zones, snow attached to ice was manually removed after visual inspection, and in some regions a different scene (with less snow but possibly more clouds) was chosen to improve results (following Mölg et al. Citation2018). Cloud-free scenes were available for most of the study region while in the few cases we used additional scenes from years close (±2 years) to the inventory years (following Paul et al. Citation2017; Mölg et al. Citation2018). Ice cover changes within the ±2 years difference to the target year are likely within the uncertainty of the ice cover outlines and should thus not matter (Mölg et al. Citation2018) (supplementary material ).
Results
Ice distribution and spatial changes of ice cover (clean and debris-covered)
The spatial distribution of ice and debris-covered ice in Afghanistan is shown in , with 64 percent of total ice area located in north-eastern Afghanistan (Region A, ), 21 percent in the central sub regions (Region C, ), 25 percent in the north (Region B, ), and the rest in the center-west (Region D, ). Debris-covered ice extent accounted for 22 percent of the total ice-covered area in 2020 but with the highest contribution in the north-eastern part (65 percent of the total debris-covered ice area). An example of ice cover outlines in 2020 is shown in for comparison with 2000 and 2008.
Figure 4. Colored background shows climatic zones (inset) based on the Köppen-Geiger climate classification (Peel, Finlayson, and McMahon Citation2007) modified to include Dsa – M (monsoonal influence) following Shroder (Citation2014); bubble points are clean ice and debris-covered ice by sub-region in 2020.
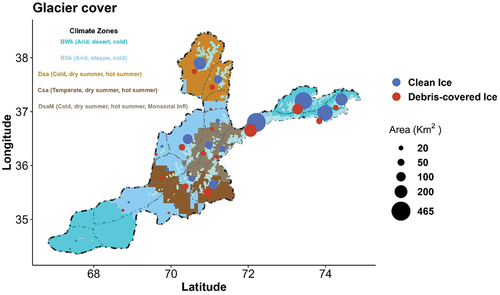
Figure 5. Ice cover outlines for the years 2000, 2008, and 2020 provided by this study, for example of (a) the north-east and (b) the northwest of Afghanistan. Background is the high resolution imagery (0.29 m) of 2016 obtained from the Ministry of Mines and Petroleum of Afghanistan (MoMP Citation2020).
In Afghanistan, the total ice-covered area shrunk by 38.3 ± 4.9 km2 between 2000 and 2008 and by 143.3 ± 4.5 km2 between 2008 and 2020 (). The latter period suggests a marked increase in the rate of area loss since 2008 by 0.46 ± 0.05 percent yr−1. Moreover, over the longer period of 2000 to 2020, the total ice cover area decreased by 181.6 ± 8.2 km2 (−6.32 ± 1.05 percent total, −0.33 ± 0.04 percent yr−1), in which almost 60 percent of the decreases were from zones of ice cover with a size ≤2.5 km2. A constant increase in debris-covered ice area was mapped using index C1; 0.8 ± 0.08 percent yr−1 for 2000–2008; and 0.48 ± 0.04 percent yr−1 for 2008–2020. The C2 debris-covered ice area increased by 0.77 ± 0.07% yr−1 for 2000 to 2008, but decreased (−1.02 ± 0.12 percent yr−1) from 2008 to 2020. Clean ice declined (−0.47 ± 0.003 percent yr−1) between 2000 and 2008 and also between 2008 and 2020 (−0.67 ± 0.005 percent yr−1) ().
We found differences in total ice cover change as a function of geographical location, and closely related both to climate characteristics () and the time period considered (). Therefore, we present the results based on each region shown in (). The distribution of ice-covered based on sub-catchments is provided in Table 2S, available as supplementary material.
Figure 6. Mean annual percentage changes in clean ice area (a, 2000–2008; b, 2008–2020), debris-covered ice area (c, 2000–2008; d, 2008–2020), and total ice cover area (ice and debris-covered ice) (e, 2000–2008; f, 2008–2020). Background shading is the climatic zonation shown in .
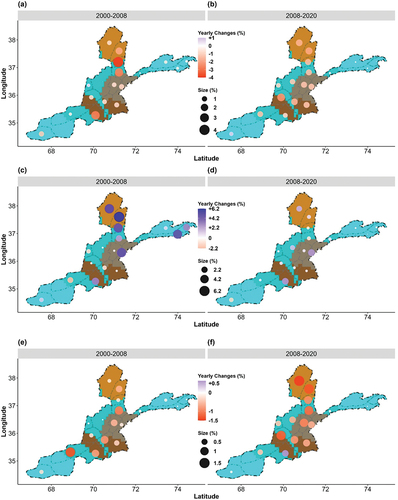
The most notable retreat rates were in Northern Afghanistan (Region B), associated with cold winters and dry and hot summers, where clean ice extent decreased from 2000 to 2008 (−2.3 ± 0.02% yr−1) and 2008 to 2020 (−1.7 ± 0.01 percent yr−1), while debris-covered ice increased (4.6 ± 0.5 percent yr−1 and 0.4 ± 0.04 percent yr−1) for the same periods (). Declining clean ice area and increasing debris-covered area partially compensated one another, although the total ice cover area still decreased from 2000 to 2008 (−0.52 ± 0.06 percent yr−1), and at a faster rate for 2008 to 2020 (−1.2 ± 0.1% yr−1).
In Central Afghanistan (Regions C and D, excluding sub-region 14), there are commonly dry and hot summers but with two distinct temporal variations: drier periods with cold conditions coming from the east; and more temperate periods with warmer and often wetter conditions coming from the south and west. In this region, clean ice cover decreased for both 2000 to 2008 (−0.53 ± 0.01 percent yr−1) and 2008 to 2020 (−1.4 ± 0.01 percent yr−1); and debris-covered ice increased (0.4 ± 0.04 percent yr−1 and 0.9 ± 0.1% yr−1 for these periods, respectively). The total ice cover area also declined (−0.33 ± 0.04 percent yr−1 and −0.80 ± 0.10 percent yr−1, respectively).
Despite having the highest percentage of ice cover, the north-eastern part of Afghanistan (Region A) had the lowest retreat rates. This region is located in an arid zone, comprising desert and steppe with a cold (mean annual temperature <0°C) climate. Clean ice cover decreased from 2000 to 2008 (−0.2 ± 0.00 percent yr−1) but increased slightly from 2008 to 2020 (0.06 ± 0.01 percent yr−1), except in sub-region 4 where it decreased slightly (−0.16 ± 0.00 percent yr−1). Debris-covered ice increased by 2.2 ± 0.20 percent yr−1 from 2000 to 2008 and decreased by −0.14 ± 0.01 percent yr−1 from 2008 to 2020, except for sub-region 4 where it increased (0.64 ± 0.07% yr−1). Taken together, this resulted in a decrease in total ice cover area of −0.06 ± 0.01 percent yr−1 from 2000 to 2008, but with a slight increase of 0.01 ± 0.00 percent yr−1 in sub-regions 1–3 from 2008 to 2020.
Changes in ice cover length and altitudinal limits
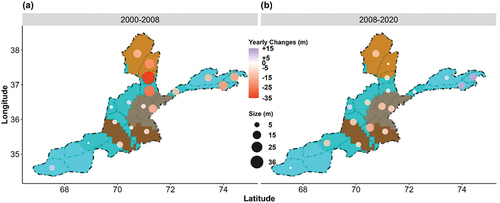
Ice cover length decreased at the highest rates for the more northerly regions (−24 m yr−1) from 2000 to 2008, but this rate of decrease declined for 2008–2020 (−5.5 m yr−1) (). The rate of decrease was lower in more central regions (−4.5 m yr−1) from 2000 to 2008 albeit more rapid from 2008 to 2020 (−7.79 m yr−1) (). In north-eastern Afghanistan, ice cover length declined from 2000 to 2008 (−15.0 m yr−1) () but increased from 2008 to 2020 (8.0 m yr−1).
Figure 7. Mean annual changes (m) in ice cover length for (a) 2000 to 2008 and (b) 2008 to 2020. Background shading is the climatic zonation shown in .
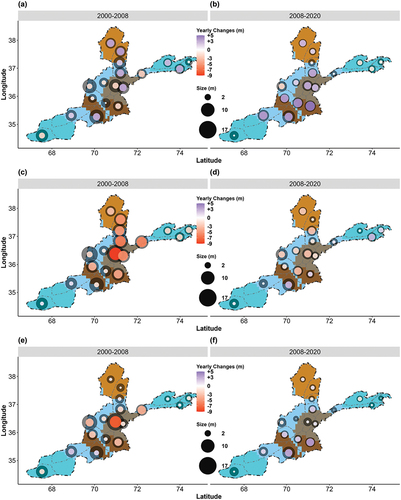
Zonal ice elevation characteristics, including minimum, maximum, and mean elevations, play a crucial role in understanding ice cover loss. Increases in minimum ice cover elevation suggest retreat; but decreases in maximum elevation may also be noted, especially if declining snow accumulation and ice formation matched by increased down valley ice flux occurs. In northern Afghanistan (Region B), minimum ice cover elevation increased for both 2000 to 2008 and 2008 to 2020 (2.70 ± 4.2 m yr−1; 1.72 ± 1.6 m yr−1; respectively). The maximum ice cover elevation declined (−4.63 ± 4.5 m yr−1, and −1.57 ± 1.9 m yr−1). In central Afghanistan (Region C), changes in minimum ice cover elevation from 2000 to 2008 differed sub-regionally with larger variation in standard deviation; however, it increased from 2008 to 2020 by an average of 2.50 ± 2.2 m yr−1. On the other hand, maximum elevation decreased by 3.68 ± 2.4 m yr−1 and −1.61 ± 4.7 m yr−1 from 2000 to 2008 and 2008 to 2020, respectively (). In north-eastern Afghanistan (Region A) minimum ice cover elevation increased from 2000 to 2008 (0.63 ± 4.3 m yr−1) but decreased from 2008 to 2020 (−0.67 ± 2.3 m yr−1), and maximum elevation declined (2000 to 2008; −2.22 ± 3.7 m yr−1) but then increased slightly (+0.99 ± 2.9 m yr−1, 2008 to 2020) (). Changes in mean elevation can also be indicative of alterations in the mass balance (). However, mean elevation can be biased by extreme changes in minimum and maximum elevations. A decrease in mean elevation cannot be solely attributed to ice moving toward lower elevations; rather, it may result from changes in ablation and accumulation areas (). Certainly, in Afghanistan, it seems that ice loss is occurring in accumulation zones as well as in ablation zones albeit to an extent that is likely dependent on accumulation zone altitudes.
Figure 8. Mean annual changes (m) in glacier ice minimum elevation for 2000–2008 (a) and 2008–2020 (b); maximum elevation for 2000–2008 (c) and 2008–2020 (d); and mean elevation for 2000–2008 (e) and 2008–2020 (f). Background shading is the climatic zonation shown in . Shaded circles show the standard deviation of the mean values.
Changes in ice area hypsometry
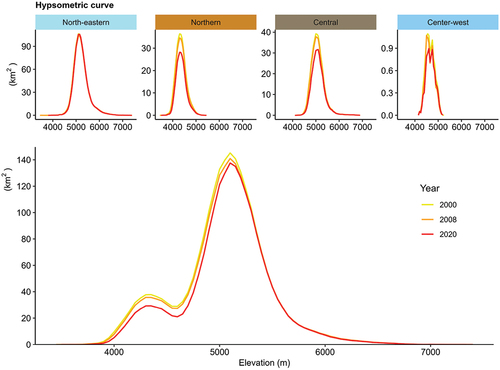
Here we present an ice area hypsometric curve constructed using a DEM based on ice outlines for the years 2000, 2008, and 2020 (see ). The hypsometric curve reveals notable changes over the study period. In the year 2000, the curve exhibited two prominent peaks of accumulated ice at approximately 4,300 m and 5,300 m elevations. However, by 2008, a decrease in ice extent was observed between 4,000 m and 5,300 m elevations. In the most recent assessment in 2020, the hypsometric curve has changed further, particularly at lower elevations, mainly between 4,000 m and 4,800 m (refer to ). The observed changes in the hypsometric curve at these lower elevations are more pronounced in the Northern and Central regions (see , Northern and Central), corresponding to dry and hot summer climate zones (see ).
Figure 9 illustrates the glacier hypsometric curves for the years 2000, 2008, and 2020 for all ice cover zones and separately for the four main regions. Sub-plots are hypsometric curves for the four individual regions ().
Size effects on ice cover loss
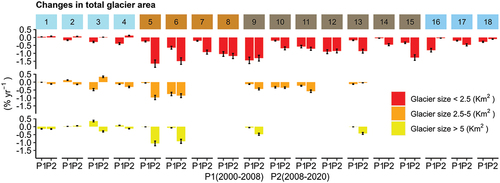
The rate of change of ice cover is not uniform across all ice cover extents but rather exhibits variability and varies systematically by region. Our results indicate that larger ice cover extents, characterized by extensive ice masses and vast surface areas, displayed a more gradual rate of change. In contrast, smaller ice cover extents tend to be more responsive to more immediate climatic change. Here, we present the changes in ice extent (total, clean ice, and debris cover ice) for three classes of size (<2.5 km2, 2.5–5 km2, and >5 km2).
The total area of smaller ice extents (<2.5 km2) declined more rapidly over all regions with highest rates in the north and lowest in the north-east (). In addition, the rates of change between 2008 and 2020 were higher than those between 2000 and 2008. In the north, from 2000 to 2008 the area of smaller ice extents (<2.5 km2) declined by −0.53 ± 0.06 percent yr−1, and this rate doubled from 2008 to 2020 (−1.30 ± 0.16 percent yr−1) (). In central regions, smaller ice extents (<2.5 km2) declined at a lower rate for 2000–2008 (−0.52 ± 0.06 percent yr−1) than 2008–2020 (−0.87 ± 0.11 percent yr−1). The north-eastern region had the lowest retreat rate for smaller ice extents for both 2000 to 2008 (−0.20 ± 0.02 percent yr−1), and smaller ice extents in this region actually grew from 2008 to 2020 (0.07 ± 0.009 percent yr−1) ().
Figure 10. Changes in total glacier area (clean ice and debris cover ice) for 2000–2008 and 2008–2020 by glacier size <2.5 km2 (red bar); 2.5–5 km2(Orange bar); and >5 km2(yellow bar). Numbers are the sub-regions (, 1–4 north-eastern, 5–8 northern, 9–15 central, and 16–18 center-west) with different colors indicating different climate zones ().
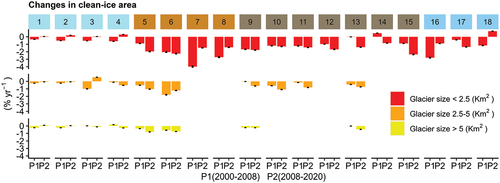
If this analysis is restricted to ice only, decreases of ice cover were highest in the northern region for the smallest ice extents for both 2000 to 2008 (−2.40 ± 0.31 percent yr−1) as compared to larger glaciers (−1.15 ± 0.14 percent yr−1, size 2.5–5 km2; and −0.45 ± 0.05 percent yr−1, size >5 km2) (). These rates of clean ice loss also slowed from 2008 to 2020 (−1.80 ± 0.23 percent yr−1, size <2.5 km2; −1.12 ± 0.14 percent yr−1, size 2.5–5 km2; and −0.77 ± 0.10 percent yr−1, size >5 km2). The central regions mirrored this size dependence for 2000 to 2008 (−0.79 ± 0.10 percent yr−1, size <2.5 km2; −0.29 ± 0.03 percent yr−1, size 2.5–5 km2; and −0.11 ± 0.01 percent yr−1, size >5 km2). However, in contrast to the north, the retreat rate in the central regions increases slightly from 2008 to 2020 even if it remains lower than the north (−1.53 ± 0.19 percent yr−1, size <2.5 km2; −0.81 ± 0.10 percent yr−1, size 2.5–5 km2; and −0.34 ± 0.04 percent yr−1, size >5 km2). In the north-eastern region, the size dependence was also found for 2000 to 2008, although the retreat rates were lower (−0.50 ± 0.06 percent yr−1, size <2.5 km2; −0.39 ± 0.05 percent yr−1, size 2.5–5 km2; and −0.06 ± 0.007 percent yr−1, size >5 km2). From 2008 to 2020, retreat rates were close to zero (+0.13 ± 0.01 percent yr−1, size <2.5 km2; −0.02 ± 0.002 percent yr−1, size 2.5–5 km2; and −0.06 ± 0.007 percent yr−1, size >5 km2) ().
Figure 11. Changes in clean-ice area for 2000–2008 and 2008–2020 by ice extent <2.5 km2 (red bar), 2.5–5 km2(Orange bar), and >5 km2(yellow bar). Numbers are the sub-regions () with different colors indicating different climate zones ().
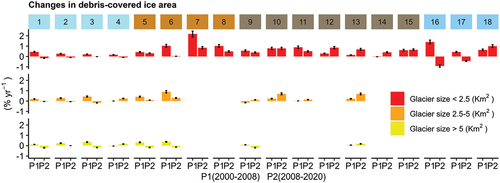
Debris-covered ice showed a different behavior temporally and by geographical region. Debris cover grew more rapidly for smaller ice extents (<2.5 km2) between 2000 and 2008 () than for larger ice extents (2.5–5 km2, >5 km2); from 2008 to 2020 the trend continued but with lower rates (). There was some evidence that these changes were geographically variable. In the central regions, ice extents had higher rates of increase in percentage debris cover for all size classes, although rates of changed decreases when ice extent size increased (+1.16 ± 0.15 percent yr−1, size <2.5 km2; +0.66 ± 0.08 percent yr−1, size 2.5–5 km2; and +0.34 ± 0.04 percent yr−1, size >5 km2) from 2000 to 2008. Although the size effect remained the same, the rates of change decreased from 2008 to 2020 (+0.47 ± 0.06 percent yr−1, size <2.5 km2; +0.15 ± 0.01 percent yr−1, size 2.5–5 km2; and +0.07 ± 0.01 percent yr−1, size >5 km2). The lowest rates of change in percentage debris cover were found in the north-eastern regions between 2000 and 2008 (+0.27 ± 0.03 percent yr−1, size <2.5 km2; +0.23 ± 0.02 percent yr−1, size 2.5–5 km2; and +0.16 ± 0.02 percent yr−1, size >5 km2). However, from 2008 to 2020, slightly negative changes in percentage debris cover were observed in north-eastern regions (−0.08 ± 0.01 percent yr−1, size <2.5 km2; −0.002 ± 0.0002 percent yr−1, size 2.5–5 km2; and −0.06 ± 0.01 percent yr−1, size >5 km2) and as well as for all ice extents >5 km2 (−0.16 ± 0.02 percent yr−1, in the north; −0.01 ± 0.001 percent yr−1, in the center). Ice extents >5 km2 seem to be undergoing a stable or slightly negative debris cover trend ().
Figure 12. Changes in debris-covered ice area for 2000–2008 and 2008–2020 by ice extent <2.5 km2 (red bar), 2.5–5 km2(orange bar), and > 5 km2(yellow bar). Numbers are the sub-regions () with different colors indicating different climate zones ().
Discussion
Ice cover loss in Afghanistan and surrounding regions
Comparison with previous studies
Our study provides an updated ice cover inventory covering the entire glaciated area of Afghanistan in the western Himalaya. We assessed ice cover evolution over three timespans, distinguishing between clean ice and debris-covered ice. Prior studies, including Mölg et al. (Citation2018), reported limitations in mapping debris-covered ice extent due to the absence of automated approaches; our study utilized a semi-automated method for distinct mapping of clean ice and debris-covered ice.
In comparing our results for the year 2000 with three other studies – Mahrajan et al. (Citation2018), Mölg et al. (Citation2018), and Randolph v6 (RGI Consortium 2017) – we found variations. The comparison revealed that Maharjan et al. (Citation2018) may have underestimated the total ice extent of Afghanistan by −15 percent in the north, −7 percent in the center, and −12 percent in the north-eastern region of the country. Similarly, in sub-regions 1, 2, and 5–8, our assessment showed underestimations of −7.2 percent, −7.0 percent, and −17 percent by Mölg et al. (Citation2018), Maharjan et al. (Citation2018), and Randolph v6 (RGI Consortium 2017), respectively. Notably, the underestimations were higher for sub-region 3, which has a high debris cover (see ). illustrates that the key underestimations in these inventories occurred in debris-covered areas, and our study may have more effectively mapped these areas based on the results in Shokory and Lane (Citation2023) where we presented and compared our method.
Figure 13. Comparison of ice cover extent for year 2000 showing at two different regions of this study with Mölg et al. (Citation2018), Maharjan et al. (Citation2018), and Randolph v6 (RGI Consortium 2017). Examples show region 3 (a and b) and region 1 (c and d) with RGB image in the background being from 2016 (MoMP Citation2020), while the false color images are Landsate-2000 (refer to supplementary material Table S2).
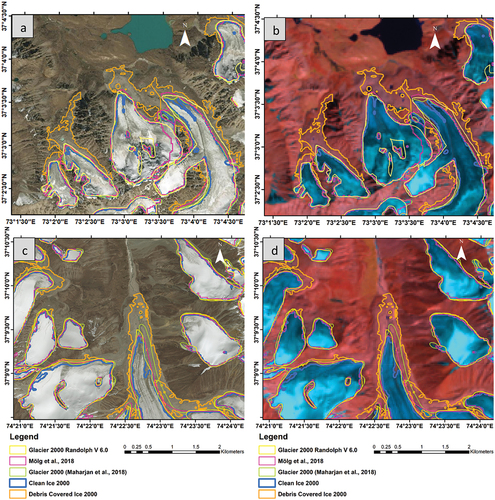
Table 2. Comparative results of the year 2000 glacier area (km2) at seven sub-regions based on data availability.
Maharjan et al. (Citation2018) employed the normalized difference snow index (NDSI) for ice cover mapping and a single slope threshold for mapping debris-covered ice. The underestimation of ice extent corresponds to the limitation that the NDSI may not detect ice cover under shadow (Shokory and Lane Citation2023). Additionally, Maharjan et al.’s (Citation2018) use of a slope threshold of <24° might not detect debris cover when a glacier tongue transitions gently to an unglaciated zone (Paul Citation2003; Bolch and Kamp Citation2005; Frey et al. Citation2012; Shokory and Lane Citation2023).
Mölg et al. (Citation2018) manually mapped debris-covered ice extent using ALOS-1 PALSAR-1 coherence images, while glacier ice areas were mapped using optical Landsat images. Challenges and issues reported include a time difference of up to 9 years between coherence and Landsat images, decreased method usability with decreasing ice cover size, and “fuzzy” images, especially in high-alpine terrain. The authors acknowledged a potential underestimation of debris-covered ice extent in cases where no clear boundaries were found (Mölg et al. Citation2018). Indeed, it is a debatable point whether debris-covered ice that becomes detached from a glacier is still part of the glacier this issue also addressed in Agarwal et al. (Citation2017). Comparison of inventories should therefore be sensitive to the steps after ice-cover mapping used to clean individual ice cover outlines.
Regional variations
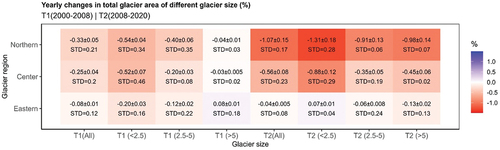
There is a clear regional variation in how Afghanistan ice cover is responding to climate change, both in space and time (). In the north-eastern regions, which are geographically close to or part of the north-west Karakoram, ice loss rates have been either substantially lower or near stable/increasing, as compared with the northern and central regions of Afghanistan. Researchers have observed that the more strongly westerly-influenced Karakoram has glaciers that were generally advancing or stable in the first decade of the 20th century (Scherler, Bookhagen, and Strecker Citation2011; Bhambri et al. Citation2013; Minora et al. Citation2016; Azam et al. Citation2018; Farinotti et al. Citation2020). The factors that have led to this condition are not fully understood, but they likely stem from the interaction between a broader regional warming, which enhances westerlies and increases precipitation, and more localized winter mass gain and summer cooling attributed to enhanced snowfall (Nie et al. Citation2021). However, regionally ice cover response is strongly heterogeneous (Bolch et al. Citation2019). Similar observations of increasing ice cover extent in the last two decades have been made for the eastern Pamir to the south-east of the north-eastern regions of Afghanistan (Lv et al. Citation2020); and the north-west Himalayan range of India (Pandey, Ghosh, and Nathawat Citation2011). The northern regions of Afghanistan are responding most sensitively to climate change and loss of ice cover seems to be accelerating (). This reflects observations of individual glaciers in the Pamir-Alay to the north (such as Abramov Glacier to the north, 1985 to 2015; Denzinger et al. Citation2021) but also generalized observations of negative mass balance for glaciers within the Pamir-Alay (1999–2011; Brun et al. Citation2017), the western Pamirs (2000–2018; Shean et al. Citation2020), and the Pamirs more widely (e.g., 2003–2008, Kääb et al. Citation2015, 2003–2009; Gardner et al. Citation2013). Ice cover in the central region was, as in the northern region, undergoing areal loss throughout the two periods considered, albeit at lower rates than in the northern region. The central region is part of the Hindu Kush and is partially summer monsoon-influenced. Reports indicate a weakening in the summer monsoon and reduced precipitation, which serves as the primary reason for ice cover loss in this area. Ice cover in such zones has been found to be more sensitive to temperature changes than to changes in accumulation (Salerno et al. Citation2015; Maurer et al., Citation2019). In addition, Joya et al. (Citation2021) recently reported significant loss of ice extent (c. −15 percent, or −0.75 percent per year) for the Kocha basin between 1990 and 2015 and this basin corresponds to a significant part of our central region. Our central region rates for less extensive zones of ice cover (<2.5 km2) are similar to this rate for both periods. Taken together, these observations mirror within Afghanistan a wider observation of strong intra-regional variability of ice cover response within the HKH region to climate warming (Brun et al. Citation2017; Scher, Steiner, and McDonald Citation2021); and potentially over spatial scales of only 10s of km (Huang et al. Citation2021). Thus, studies of individual glaciers can provide contradictory messages (e.g. Debnath, Sharma, and Syiemlieh Citation2019; Chowdhury et al. Citation2021).
Figure 14. Heat map for ice cover loss in three geographical locations of Afghanistan under two timespan T1--T2.
Overall, our results indicated an acceleration in ice cover loss for the decade (2008–2020) that match those of previous studies for overlapping time periods in the region (Brun et al. Citation2017; King et al. Citation2019; Maurer et al., Citation2019; Bhattacharya et al. Citation2021). Maurer et al. (Citation2019) explained it as an increase in temperature by 0.4°C to 1.4° in the HKH region. Moreover, the diversity of ice cover extent, types, morphological variables, extent of debris cover, and lake evolution are additional parameters that further influence glacier shrinkage (Nie et al. Citation2021; Agarwal et al. Citation2023).
Debris cover evolution
Observations suggest that long valley glaciers covered with thick debris are generally stagnant (Racoviteanu et al. Citation2014) and when ice flow decreases locally the debris thickness increases (McCarthy et al. Citation2022). It has been reported for the High Mountain Asia, that melt beneath debris-covered areas, on average, is reduced by 36 percent compared to clean ice (Rounce et al. Citation2021). This has been reported in the north-eastern part of Afghanistan which has the highest debris-covered ice area, and in long valley glacier settings where there is thick debris cover (Shroder, Citation1980). Such zones have the lowest rates of ice loss with more stagnant debris-covered termini (). On the other hand, in the northern and central glaciated regions of Afghanistan, we noted higher rates of ice cover loss () and increases in percentage debris cover (). This pattern was also confirmed by Bishop et al. (Citation2014) who observed that glaciers that were down-wasting and back-wasting were more debris-covered in northern Afghanistan than elsewhere in the country. However, this may not simply be a function of melt rate but also climate effects (McCarthy et al. Citation2022). These regions have drier and hotter summer climates that may lead to an increase in debris cover (Herreid and Pellicciotti Citation2020). Additionally, the relative percentage of debris cover areas systematically decreases with increasing ice cover extent, a pattern observed globally (Scherler, Wulf, and Gorelick Citation2018) as well as in Afghanistan (Shokory and Lane Citation2023). As smaller zones of ice cover shrink faster than larger glaciers (), this facilitates the rate of debris cover increase on such glaciers (Narama et al. Citation2010; Scherler, Wulf, and Gorelick Citation2018).
Climate influences on ice cover loss
A primary explanation of regional differences in rates of ice cover loss is the climatic complexity of Afghanistan. It is well known that for the wider HKH there are broadly two distinguishing influences on glacier mass balance (Fujita Citation2008): glaciers dominated by the westerlies and winter-accumulation and those dominated by monsoon with a tendency to summer accumulation. Fujita (Citation2008) showed that monsoon-dominated glaciers are more sensitive to climate change than westerly-dominated glaciers due to a rise in the rain/snow limit related to increasing temperature. By contrast, Racoviteanu et al. (Citation2014) found much higher glacier retreat rates in the dry areas of the western Himalaya (Ladakh) than the monsoon-dominated eastern Himalaya (Sikkim). In Afghanistan, the north-eastern and northern regions presented here are westerly-influenced zones of ice cover. The south Asian monsoon can penetrate into the central region to an extent that depends on its annual intensity. Our data suggest that the northern region, with a cold winter and a dry and hot summer, is where retreat rates are most rapid. The north-eastern region which is arid, but which has a colder climate, has the lowest rate of ice cover loss () and this region borders on zones where others have made similar observations (Scherler, Bookhagen, and Strecker Citation2011; Bhambri et al. Citation2013; Minora et al. Citation2016; Azam et al. Citation2018; Farinotti et al. Citation2020; Lv et al. Citation2020). The central region has a mix of both northern and north-eastern climate with influences from south Asian monsoon; therefore, a median retreat in between is observed. Thus, there is a strong signal of summer temperature, and hence altitude and ice cover extent, in determining ice cover response to climate warming.
Methodological constraints
Seasonal snow made it problematic on some dates to identify the ice boundary for some zones, mainly in the north-eastern region of Afghanistan. Mölg et al. (Citation2018) report that this region has frequent seasonal snow captured in Landsat scenes. Therefore, zones with frequent snow and cloud cover were not considered in the mapping. It should be emphasized that the 2016 dataset (Shokory and Lane Citation2023) is not comparable with 2000, 2008, and 2020 datasets because of 1) a decision to exclude from the latter three datasets zones that were predominantly cloudy and 2) a change in the way ice cover was segmented at catchment divides.
Landsat datasets provide information acquired using different sensors; for instance, for the years 2000 and 2008 we used Landsat 7 that uses Enhanced Thematic Mapper Plus sensor (ETM+), and for the year 2020 we used Landsat 8 which used Operational Land Imager (OLI). Roy et al. (Citation2016) reported that OLI reflectance is slightly greater than the ETM+ for all bands. Therefore, we also observed slight changes in the index threshold values with ±5 percent variation between those two datasets of Landsat 7 and 8. Then the index threshold was carefully monitored for each period using six benchmark zones (Supplementary material Figure 1S) in the validation of this study (Shokory and Lane Citation2023).
Conclusion
This research studied ice cover changes in Afghanistan in terms of total ice cover, clean ice cover, and debris-covered ice for two timespans (2000–2008 and 2008–2020). Inventories were developed for 2000, 2008, and 2020 to enable this. In 2020, 2,690.7 ± 108.2 km2 of total ice cover extent was mapped, split between 75 ± 0.74 percent clean ice and 25 ± 3.0 percent debris-covered ice. Across the country, there has been an acceleration of ice cover loss from 4.7 ± 0.5 km2 yr−1 (0.16 ± 0.01 percent yr−1) between 2000 and 2008 to 12.0 ± 1.5 km2 yr−1 (0.46 ± 0.05 percent yr−1) between 2008 and 2020. Our analysis showed that ice cover response in Afghanistan to climate warming is regionally variable and depends on ice cover extent, and this despite Afghanistan being only a small percentage of the HKH region (11.3 percent). Zones with cold winters and dry and hot summer climates (the northern region) had the highest rates of loss, and arid, desert and steppe, cold climate (the north-eastern region) had the lowest rates of loss. In between, a mix of both regions, climates (northern and north-eastern regions) with summer Asian monsoon influence had a median rate of loss.
Debris-covered ice extent in Afghanistan glaciers is increasing, but mainly for smaller ice cover zones. This response is important as it may influence climate–ice dynamics and reduce the sensitivity of ice mass loss to rising temperature, so extending the lifespan of the total ice cover as water resources (Lardeux et al. Citation2016; Zhang et al. Citation2019). However, while debris cover development is likely an important negative feedback in response to climate warming, the fact that the largest zones of ice cover are not yet showing increases in debris cover suggests that there will continue to be significant ice loss in some regions of Afghanistan.
It is generally accepted that smaller zones of ice cover are more sensitive to and good indicators of climate change because of their faster response to relatively short-term climate variations (Paul, Huggel, and Kääb Citation2004). However, we found variable response of small-size ice cover zones to climate change. Smaller zones of ice cover in northern Afghanistan are retreating at a higher rate than those of central regions with those in north-eastern Afghanistan having much lower recession rates. However, this regional difference is found for all ice cover extents and it seems that in Afghanistan regional differences in climate are more important than extent effects.
Finally, we found that the maximum elevation of ice cover zones has decreased but mainly in the north and center of Afghanistan. This indicates that ice cover loss is not only due to ablation but also reduced accumulation in or increased ice flux out of accumulation zones. This observation is important as it may take time for accumulation changes to be seen in changes in snout margin retreat rates.
This work has focused on general changes by regions. It may be possible using this database to test out other local scale drivers of variations in ice cover extent, in futures studies. For instance, glacier lake formation has also been shown to be an important driver of ice cover loss in the HKH (King et al. Citation2017). In addition, the three inventories published with this paper should become the basis of improving water resource assessments for the region by identifying the relationship between regional patterns ice loss and the distribution of downstream populations. Furthermore, utilizing the glacier ice and debris-covered ice outlines provided by this study, there is potential to explore more detailed elevation changes and volume variations.
Supplemental Material
Download Zip (369 KB)Acknowledgments
JS was in receipt of a Swiss Federal Government Excellence Scholarship. The authors acknowledge constructive but critical comments from two anonymous reviewers an Associate Editor and Editor Professor McKnight.
Disclosure statement
No potential conflict of interest was reported by the author(s).
Supplementary material
Supplemental data for this article can be accessed online at https://doi.org/10.1080/15230430.2024.2373858
Additional information
Funding
References
- Agarwal, V., T. Bolch, T. H. Syed, T. Pieczonka, T. Strozzi, and R. Nagaich. 2017. Area and mass changes of Siachen glacier (East Karakoram). Journal of Glaciology 63, no. 237:148–21. doi:10.1017/jog.2016.127.
- Agarwal, V., M. V. W. de Vries, U. K. Haritashya, S. Garg, J. S. Kargel, Y. J. Chen, and D. H. Shugar. 2023. Long-term analysis of glaciers and glacier lakes in the Central and Eastern Himalaya. Science of the Total Environment 898:165598. https://doi.org/10.1016/j.scitotenv.2023.165598.
- Ageta, Y., and K. Higuchi. 1984. Estimation of mass balance components of a summer-accumulation type glacier in the Nepal Himalaya. Geografiska Annaler: Series A, Physical Geography 66:249–55.
- Anderson, B., and A. Mackintosh. 2012. Controls on mass balance sensitivity of maritime glaciers in the Southern Alps, New Zealand: The role of debris cover. Journal of Geophysical Research: Earth Surface 117:1–15.
- Anderson, B., A. N. Mackintosh, R. Dadić, J. Oerlemans, C. Zammit, A. Doughty, A. Sood, and B. Mullan. 2021. Modelled response of debris-covered and lake-calving glaciers to climate change, Kā Tiritiri o te Moana/Southern Alps, New Zealand. Global and Planetary Change 205:103593.
- Anderson, L. S., and R. S. Anderson. 2016. Modeling debris-covered glaciers: Response to steady debris deposition. The Cryosphere 10:1105–24.
- Azam, M. F., P. Wagnon, E. Berthier, C. Vincent, K. Fujita, and J. S. Kargel. 2018. Review of the status and mass changes of Himalayan-Karakoram glaciers. Journal of Glaciology 64:61–74.
- Bates, B., Z. Kundzewicz, and S. Wu. 2008. Climate change and water. Intergovernmental Panel on Climate Change Secretariat. http://www.ipcc.ch/pdf/technical-papers/climate-change-water-en.pdf .
- Bhambri, R., T. Bolch, P. Kawishwar, D. P. Dobhal, D. Srivastava, and B. Pratap. 2013. Heterogeneity in glacier response in the upper Shyok valley, northeast Karakoram. The Cryosphere 7:1385–98. https://doi.org/10.5194/tc-7-1385-2013.
- Bhardwaj, A., P. K. Joshi, M. K. Singh, L. Sam, and R. D. Gupta. 2014. Mapping debris-covered glaciers and identifying factors affecting the accuracy. Cold Regions Science and Technology 106:161–74.
- Bhattacharya, A., T. Bolch, K. Mukherjee, O. King, B. Menounos, V. Kapitsa, N. Neckel, W. Yang, and T. Yao. 2021. High mountain Asian glacier response to climate revealed by multi-temporal satellite observations since the 1960s. Nature Communications 12:4133.
- Bishop, M. P., J. F. Shroder, G. Ali, A. B. Bush, U. K. Haritashya, R. Roohi, M. A. Sarikaya, and B. J. Weihs. 2014. Remote sensing of glaciers in Afghanistan and Pakistan. In Global Land Ice Measurements from Space, ed. J. Kargel, G. Leonard, M. Bishop, A. Kääb, B. Raup, 509–48. Berlin, Heidelberg: Springer.
- Bolch, T., and U. Kamp. 2005. Glacier mapping in high mountains using DEMs, Landsat and ASTER data. In 8th International Symposium on High Mountain Remote Sensing Cartography, La Paz (Bolivien), March 20–27, 2005. Karl-Franzens-Universität Graz, 37–48.
- Bolch, T., A. Kulkarni, A. Kääb, C. Huggel, F. Paul, J. G. Cogley, H. Frey, J. S. Kargel, K. Fujita, M. Scheel, et al. 2012. The state and fate of Himalayan glaciers. Science 336, no. 6079:310–14.
- Bolch, T., N. Rohrbach, S. Kutuzov, B. A. Robson, and A. Osmonov. 2019. Occurrence, evolution and ice content of ice‐debris complexes in the Ak‐Shiirak, Central Tien Shan revealed by geophysical and remotely‐sensed investigations. Earth Surface Processes and Landforms 44:129–43.
- Brun, F., E. Berthier, P. Wagnon, A. Kääb, and D. Treichler. 2017. A spatially resolved estimate of High Mountain Asia glacier mass balances from 2000 to 2016. Nature Geoscience 10:668–73.
- Chowdhury, A., M. C. Sharma, S. Kumar De, and M. Debnath. 2021. Glacier changes in the Chhombo Chhu Watershed of the Tista basin between 1975 and 2018, the Sikkim Himalaya, India. Earth System Science Data 13:2923–44.
- Collier, E., F. Maussion, L. I. Nicholson, T. Mölg, W. W. Immerzeel, and A. B. G. Bush. 2015. Impact of debris cover on glacier ablation and atmosphere–glacier feedbacks in the Karakoram. The Cryosphere 9, no. 4:1617–32.
- Debnath, M., M. C. Sharma, and H. J. Syiemlieh. 2019. Glacier dynamics in Changme Khangpu Basin, Sikkim Himalaya, India, between 1975 and 2016. Geosciences 9:259.
- Denzinger, F., H. Machguth, M. Barandun, E. Berthier, L. Girod, M. Kronenberg, R. Usubaliev, and M. Hoelzle. 2021. Geodetic mass balance of Abramov Glacier from 1975 to 2015. Journal of Glaciology 67:331–42.
- Evatt, G. W., I. D. Abrahams, M. Heil, C. Mayer, J. Kingslake, S. L. Mitchell, A. C. Fowler, and C. D. Clark. 2015. Glacial melt under a porous debris layer. Journal of Glaciology 61:825–36.
- Farinotti, D., W. W. Immerzeel, R. J. de Kok, D. J. Quincey, and A. Dehecq. 2020. Manifestations and mechanisms of the Karakoram glacier anomaly. Nature Geoscience 13, no. 1:8–16. doi:10.1038/s41561-019-0513-5.
- Farinotti, D., A. Pistocchi, and M. Huss. 2016. From dwindling ice to headwater lakes: Could dams replace glaciers in the European Alps? Environmental Research Letters 11:054022.
- Frey, H., F. Paul, and T. Strozzi. 2012. Compilation of a glacier inventory for the western Himalayas from satellite data: Methods, challenges, and results. Remote Sensing of Environment 124:832–843.
- Fujita, K. 2008. Effect of precipitation seasonality on climatic sensitivity of glacier mass balance. Earth and Planetary Science Letters 276:14–19.
- Gardelle, J., E. Berthier, Y. Arnaud, and A. Kääb. 2013. Region-wide glacier mass balances over the Pamir-Karakoram-Himalaya during 1999–2011. The Cryosphere 7:1263–86.
- Gardner, A. S., G. Moholdt, J. G. Cogley, B. Wouters, A. A. Arendt, J. Wahr, E. Berthier, R. Hock, W. T. Pfeffer, G. Kaser, et al. 2013. A reconciled estimate of glacier contributions to sea level rise: 2003 to 2009. Science 340:852–7.
- Garg, P. K., A. Malviya, A. Shukla, S. Garg, and N. Singh. 2023a. On periodic growth and shrinkage of glaciers in the Warwan sub-basin, western Himalaya, between 1990 and 2020. Environmental Monitoring and Assessment 195:390.
- Garg, S., P. J. Navinkumar, A. Godara, R. Sahu, D. K. Singh, and R. A. A. J. Ramsankaran. 2023b. Remote sensing the evolution of debris-covered Panchi Nala-A glacier, India (1971-2021) from satellites and unmanned aerial vehicles. Regional Environmental Change 23:103.
- Garg, S., A. Shukla, P. K. Garg, B. Yousuf, U. K. Shukla, and S. Lotus. 2021. Revisiting the 24 year (1994-2018) record of glacier mass budget in the Suru sub-basin, western Himalaya: Overall response and controlling factors. Science of the Total Environment 800:149533.
- Gibson, M. J., N. F. Glasser, D. J. Quincey, C. Mayer, A. V. Rowan, and T. D. Irvine-Fynn. 2017. Temporal variations in supraglacial debris distribution on Baltoro Glacier, Karakoram between 2001 and 2012. Geomorphology 295:572–85.
- Hagg, W., L. N. Braun, M. Kuhn, and T. I. Nesgaard. 2007. Modelling of hydrological response to climate change in glacierized Central Asian catchments. Journal of Hydrology 332:40–53.
- Herreid, S., and F. Pellicciotti. 2020. The state of rock debris covering Earth’s glaciers. Nature Geoscience 13:621–7.
- Hock, R., A. Bliss, B. E. N. Marzeion, R. H. Giesen, Y. Hirabayashi, M. Huss, V. Radić, and A. B. Slangen. 2019. GlacierMIP–A model intercomparison of global-scale glacier mass-balance models and projections. Journal of Glaciology 65:453–67.
- Huang, L., Z. Li, J. M. Zhou, and P. Zhang. 2021. An automatic method for clean glacier and nonseasonal snow area change estimation in High Mountain Asia from 1990 to 2018. Remote Sensing of Environment 258:112376.
- Humlum, J., M. Køie, and K. Ferdinand. 1959. La géographie de l’Afghanistan: étude d’un pays aride. Revue de la Geographie Alpine 24:431–2.
- Huss, M., and R. Hock. 2015. A new model for global glacier change and sea-level rise. Frontiers in Earth Science 3:54.
- Joya, E., M. T. Bromand, K. O. Murtaza, and R. A. Dar. 2021. Current glacier status and ELA changes since the Late Pleistocene in The Hindu Kush Mountains of Afghanistan. Journal of Asian Earth Sciences 219:104897.
- Kääb, A., E. Berthier, C. Nuth, J. Gardelle, and Y. Arnaud. 2012. Contrasting patterns of early twenty-first-century glacier mass change in the Himalayas. Nature 488:495–8.
- Kääb, A., C. Nuth, D. Treichler, and E. Berthier. 2015. Brief communication: Contending estimates of early 21st century glacier mass balance over the Pamir-Karakoram-Himalaya. The Cryosphere Discussions 8:5857–74.
- Kaser, G., M. Großhauser, and B. Marzeion. 2010. Contribution potential of glaciers to water availability in different climate regimes. Proceedings of the National Academy of Sciences 107:20223–7.
- Kayastha, R. B., Y. Takeuchi, M. Nakawo, and Y. Ageta. 2000. Practical prediction of ice melting beneath various thickness of debris cover on Khumbu Glacier, Nepal using a positive degree-day factor. IAHS Special Publication 264:71–81.
- Khanal, S., A. F. Lutz, P. D. Kraaijenbrink, B. van den Hurk, T. Yao, and W. W. Immerzeel. 2021. Variable 21st century climate change response for rivers in High Mountain Asia at seasonal to decadal time scales. Water Resources Research 57:1–26.
- King, O., A. Bhattacharya, R. Bhambri, and T. Bolch. 2019. Glacial lakes exacerbate Himalayan glacier mass loss. Scientific Reports 9:18145.
- King, O., D. J. Quincey, J. L. Carrivick, and A. V. Rowan. 2017. Spatial variability in mass loss of glaciers in the Everest region, central Himalayas, between 2000 and 2015. The Cryosphere 11 (1):407–26.
- Kozhikkodan, V. B., B. U. Franz, B. G. A. Efrain, and D. S. S. Florencio. 2014. Recent changes occurred in the terminus of the debriscovered bilafond glacier in the Karakoram Himalayas using remotely sensed images and digital elevation models (1978–2011). Journal of Mountain Science 11:398–406.
- Kraaijenbrink, P. D., M. F. P. Bierkens, A. F. Lutz, and W. W. Immerzeel. 2017. Impact of a global temperature rise of 1.5 degrees Celsius on Asia’s glaciers. Nature 549:257–60.
- Lardeux, P., N. Glasser, T. Holt, and B. Hubbard. 2016. Debris-covered glaciers extend the lifespan of water supplies in the European Alps. In EGU General Assembly Conference Abstracts, EPSC, 2016–427.
- Lv, M., D. J. Quincey, H. Guo, O. King, G. Liu, S. Yan, X. Lu, and Z. Ruan. 2020. Examining geodetic glacier mass balance in the eastern Pamir transition zone. Journal of Glaciology 66 (260):927–37.
- Maharjan, S. B., S. R. Bajracharya, A. G. Shokory, E. Joya, K. A. Muazafary, M. Bariz, M. M. Rahimi, A. Anwari, and T. C. Sherpa. 2018. Status and Decadal Changes of Glaciers in Afghanistan since 1990s. In American Geophysical Union AGU Fall Meeting, Washington DC, United States, December 10–14, 2018. Accessed October 18, 2022. https://ui.adsabs.harvard.edu/abs/2018AGUFM.C32A.05M/abstract.
- MAIL. 2020. High Resolution Digital Elevation Model of Afghanistan. Jamal Mina, Kabul, Afghanistan: Ministry of Agriculture Irrigation and Livestock of Afghanistan.
- Marzeion, B., R. Hock, B. Anderson, A. Bliss, N. Champollion, K. Fujita, M. Huss, W. W. Immerzeel, P. Kraaijenbrink, J. H. Malles, et al. 2020. Partitioning the uncertainty of ensemble projections of global glacier mass change. Earth’s Future 8:e2019EF001470. https://doi.org/10.1029/2019EF001470.
- Marzeion, B., A. H. Jarosch, and M. Hofer. 2012. Past and future sea-level change from the surface mass balance of glaciers. The Cryosphere 6:1295–322.
- Maurer, J. M., J. M. Schaefer, S. Rupper, and A. Corley. 2019. Acceleration of ice loss across the Himalayas over the past 40 years. Science Advances 5:7266. doi:10.1126/sciadv.aav7266.
- McCarthy, M., E. Miles, M. Kneib, P. Buri, S. Fugger, and F. Pellicciotti. 2022. Supraglacial debris thickness and supply rate in High-Mountain Asia. Communications Earth & Environment 3:269. https://doi.org/10.1038/s43247-022-00588-2.
- Minora, U., D. Bocchiola, C. D’Agata, D. Maragno, C. Mayer, A. Lambrecht, E. Vuillermoz, A. Senese, C. Compostella, C. Smiraglia, et al. 2016. Glacier area stability in the Central Karakoram National Park (Pakistan) in 2001–2010: The “Karakoram Anomaly” in the spotlight. Progress in Physical Geography 40:629–60.
- Mölg, N., T. Bolch, P. Rastner, T. Strozzi, and F. Paul. 2018. A consistent glacier inventory for Karakoram and Pamir derived from Landsat data:Distribution of debris cover and mapping challenges. Earth System Science Data 10:1807–27.
- MoMP. 2020. Russian geological map of Afghanistan. Kabul, Afghanistan: Ministry of Mines and Petroleum of Afghanistan.
- Narama, C., A. Kääb, M. Duishonakunov, and K. Abdrakhmatov. 2010. Spatial variability of recent glacier area changes in the Tien Shan Mountains, Central Asia, using Corona (~ 1970), Landsat (~2000), and ALOS (~ 2007) satellite data. Global and Planetary Change 71, no. 1–2:42–54.
- Nicholson, L., and D. I. Benn. 2006. Calculating ice melt beneath a debris layer using meteorological data. Journal of Glaciology 52:463–70.
- Nicholson, L., and D. I. Benn. 2013. Properties of natural supraglacial debris in relation to modelling sub‐debris ice ablation. Earth Surface Processes and Landforms 38, no. 5:490–501.
- Nie, Y., H. D. Pritchard, Q. Liu, T. Hennig, W. Wang, X. Wang, S. Liu, S. Nepal, D. Samyn, K. Hewitt, et al. 2021. Glacial change and hydrological implications in the Himalaya and Karakoram. Nature Reviews Earth and Environment 2:91–106.
- Östrem, G. 1959. Ice melting under a thin layer of moraine, and the existence of ice cores in moraine ridges. Geografiska Annaler 41:228–30.
- Pandey, A. C., S. Ghosh, and M. S. Nathawat. 2011. Evaluating patterns of temporal glacier changes in Greater Himalayan range, Jammu and Kashmir, India. Geocarto International 26:321–38.
- Paul, F. 2003. The new Swiss glacier inventory 2000: Application of remote sensing and GIS. Thesis (Doctoral). University of Zurich, Zurich, Switzerland. Thesis (Doctoral). Accessed September 7, 2022. https://www.zora.uzh.ch/id/eprint/163148/ .
- Paul, F., T. Bolch, K. Briggs, A. Kääb, M. McMillan, R. McNabb, T. Nagler, C. Nuth, P. Rastner, T. Strozzi, et al. 2017. Error sources and guidelines for quality assessment of glacier area, elevation change, and velocity products derived from satellite data in the Glaciers_cci project. Remote Sensing of Environment 203:256–75
- Paul, F., C. Huggel, and A. Kääb. 2004. Combining satellite multispectral image data and a digital elevation model for mapping debris-covered glaciers. Remote Sensing of Environment 89:510–8.
- Paul, F., A. Kääb, M. Maisch, T. Kellenberger, and W. Haeberli. 2002. The new remote-sensing-derived Swiss glacier inventory: I. Methods. Annals of Glaciology 34:355–61.
- Peel, M. C., B. L. Finlayson, and T. A. McMahon. 2007. Updated world map of the Köppen-Geiger climate classification. Hydrology and Earth System Sciences 11, no. 5:1633–44.
- Pratap, B., D. P. Dobhal, M. Mehta, and R. Bhambri. 2015. Influence of debris cover and altitude on glacier surface melting: A case study on Dokriani Glacier, central Himalaya, India. Annals of Glaciology 56:9–16.
- Pritchard, H. D. 2019. Asia’s shrinking glaciers protect large populations from drought stress. Nature 569:649–54.
- Quincey, D., M. Klaar, D. Haines, J. Lovett, B. Pariyar, G. Gurung, L. Brown, C. Watson, M. England, and B. Evans. 2018. The changing water cycle: The need for an integrated assessment of the resilience to changes in water supply in High‐Mountain Asia. Wiley Interdisciplinary Reviews: Water 5, no. 1:e1258.
- Racoviteanu, A. E., Y. Arnaud, I. M. Baghuna, S. R. Bajracharya, E. Berthier, R. Bhambri, T. Bolch, M. Byrne, R. K. Chaujar, R. Frauenfelder, et al. 2014. Himalayan glaciers (India, Bhutan, Nepal): Satellite observations of thinning and retreat. In Global Land Ice Measurements from Space, ed. J. Kargel, G. Leonard, M. Bishop, A. Kääb, and B. Raup, 549–82. Berlin, Heidelberg: Springer.
- Radić, V., A. Bliss, A. C. Beedlow, R. Hock, E. Miles, and J. G. Cogley. 2014. Regional and global projections of twenty-first century glacier mass changes in response to climate scenarios from global climate models. Climate Dynamics 42:37–58.
- Rees, H., and D. Collins. 2006. Regional differences in response of flow in glacier‐fed Himalayan rivers to climatic warming. Hydrological Processes: An International Journal 20:2157–69.
- Reid, T. D., and B. W. Brock. 2014. Assessing ice-cliff backwasting and its contribution to total ablation of debris-covered Miage glacier, Mont Blanc massif, Italy. Journal of Glaciology 60:3–13.
- Ren, J., Z. Jing, J. Pu, and X. Qin. 2006. Glacier variations and climate change in the central Himalaya over the past few decades. Annals of Glaciology 43:218–22.
- Ren, J., D. Qin, S. Kang, S. Hou, J. Pu, and Z. Jing. 2004. Glacier variations and climate warming and drying in the central Himalayas. Chinese Science Bulletin 49:65–9.
- Rounce, D. R., R. Hock, R. W. McNabb, R. Millan, C. Sommer, M. H. Braun, P. Malz, F. Maussion, J. Mouginot, T.C. Seehaus, et al. 2021. Distributed global debris thickness estimates reveal debris significantly impacts glacier mass balance. Geophysical Research Letters 48:e2020GL091311.
- Rounce, D. R., R. Hock, and D. E. Shean. 2020. Glacier mass change in High Mountain Asia through 2100 using the open-source python glacier evolution model (PyGEM). Frontiers in Earth Science 7:331.
- Rounce, D. R., O. King, M. McCarthy, D. E. Shean, and F. Salerno. 2018. Quantifying debris thickness of debris‐covered glaciers in the Everest Region of Nepal through inversion of a subdebris melt model. Journal of Geophysical Research: Earth Surface 123:1094–115.
- Rowan, A. V., D. J. Quincey, M. J. Gibson, N. F. Glasser, M. J. Westoby, T. D. Irvine-Fynn, P. R. Porter, and M. J. Hambrey. 2018. The sustainability of water resources in High Mountain Asia in the context of recent and future glacier change. Geological Society 462, no. 1:189–204.
- Roy, D. P., V. Kovalskyy, H. K. Zhang, E. F. Vermote, L. Yan, S. S. Kumar, and A. Egorov. 2016. Characterization of Landsat-7 to Landsat-8 reflective wavelength and normalized difference vegetation index continuity. Remote Sensing of Environment 185:57–70.
- Salerno, F., N. Guyennon, S. Thakuri, G. Viviano, E. Romano, E. Vuillermoz, P. Cristofanelli. 2015. Weak precipitation, warm winters and springs impact glaciers of south slopes of Mt. Everest (central Himalaya) in the last 2 decades (1994–2013). The Cryosphere 9:1229–47.
- Scher, C., N. C. Steiner, and K. C. McDonald. 2021. Mapping seasonal glacier melt across The Hindu Kush Himalaya with time series synthetic aperture radar (SAR). The Cryosphere 15:4465–82.
- Scherler, D., B. Bookhagen, and M. Strecker. 2011. Spatially variable response of Himalayan glaciers to climate change affected by debris cover. Nature Geoscience 4:156–9.
- Scherler, D., H. Wulf, and N. Gorelick. 2018. Global assessment of supraglacial debris‐cover extents. Geophysical Research Letters 45:11–798.
- Shannon, S., R. Smith, A. Wiltshire, T. Payne, M. Huss, R. Betts, J. Caesar, A. Koutroulis, D. Jones, and S. Harrison. 2019. Global glacier volume projections under high-end climate change scenarios. The Cryosphere 13:325–50.
- Shean, D. E., S. Bhushan, P. Montesano, D. R. Rounce, A. Arendt, and B. Osmanoglu. 2020. A systematic, regional assessment of high mountain Asia glacier mass balance. Frontiers in Earth Science 7:363.
- Shokory, J. A., and S. N. Lane. 2023. Patterns and drivers of glacier debris-cover development in the Afghanistan Hindu Kush Himalaya. Journal of Glaciology 69, no. 277:1260–1274. doi: 10.1017/jog.2023.14.
- Shokory, J. A., B. Schaefli, and S. N. Lane. 2023. Water resources of Afghanistan and related hazards under rapid climate warming: A review. Hydrological Sciences Journal 68:507–25.
- Shokory, J. A., J. I. G. Tsutsumi, H. Yamada, and B. Kløve. 2017. Intra-seasonal variation of rainfall and climate characteristics in Kabul River Basin. Central Asian Journal of Water Research 3:24–40.
- Shroder, J. F. 1980. Special problems of glacial inventory in Afghanistan. In World Glacial Inventory Proceedings Riederalp Workshop, September 1978 (IAHS-AISH Publication No. 126), International Association of Hydrological Sciences, 142–7.
- Shroder, J. F. 2014. Natural Resources in Afghanistan:Geographic and Geologic Perspectives on Centuries of Conflict. San Diego: Elsevier.
- Shroder, J. F., and M. P. Bishop. 2010. Glacier of Asia-Glaciers of Afghanistan. U.S. Geological Survey Professional Paper 1386-F-3. last access:7 September 2022. https://pubs.usgs.gov/pp/p1386f/pdf/F3_Afghanistan.pdf.
- Shukla, A., M. K. Arora, and R. P. Gupta. 2010. Synergistic approach for mapping debris-covered glaciers using optical–thermal remote sensing data with inputs from geomorphometric parameters. Remote Sensing of Environment 114:1378–87.
- Shukla, A., S. Garg, M. Mehta, V. Kumar, and U. K. Shukla. 2020. Temporal inventory of glaciers in the Suru sub-basin, western Himalaya: Impacts of regional climate variability. Earth System Science Data 12:1245–65.
- Sorg, A., T. Bolch, M. Stoffel, O. Solomina, and M. Beniston. 2012. Climate change impacts on glaciers and runoff in Tien Shan (Central Asia). Nature Climate Change 2:725–31.
- Taschner, S., and R. Ranzi. 2002. Comparing the opportunities of Landsat-TM and Aster data for monitoring a debris-covered glacier in the Italian Alps within the GLIMS project. IEEE International Geoscience and Remote Sensing Symposium 2:1044–6.
- Vincent, C., P. Wagnon, J. M. Shea, W. W. Immerzeel, P. Kraaijenbrink, D. Shrestha, A. Soruco, Y. Arnaud, F. Brun, E. Berthier et al. 2016. Reduced melt on debris-covered glaciers: Investigations from Changri Nup Glacier, Nepal. The Cryosphere 10:1845–58.
- Viviroli, D., R. Weingartner, and B. Messerli. 2003. Assessing the hydrological significance of the world’s mountains. Mountain Research and Development 23:32–40.
- Wahid, S. M., A. B. Shrestha, M. S. R. Murthy, M. Matin, J. Zhang, and O. Siddiqui. 2014. Regional water security in The Hindu Kush Himalayan region: Role of geospatial science and tools. International Archives of Photogrammetry, Remote Sensing and Spatial Information Sciences 40:1331–40.
- Williams, M. W. 2013. The status of glaciers in The Hindu Kush–Himalayan region. Mountain Research and Development 33:114–15.
- Wiltshire, A. J. 2014. Climate change implications for the glaciers of The Hindu Kush, Karakoram and Himalayan region. The Cryosphere 8:941–58.
- Yao, T., T. Bolch, D. Chen, J. Gao, W. Immerzeel, S. Piao, F. Su, et al. 2022. The imbalance of the Asian water tower. Nature Reviews Earth & Environment 3:618–32.
- You, Q. L., G. Y. Ren, Y. Q. Zhang, Y. Y. Ren, X. B. Sun, Y. J. Zhan, A. B. Shrestha, and R. Krishnan. 2017. An overview of studies of observed climate change in The Hindu Kush Himalayan (HKH) region. Advances in Climate Change Research 8:141–7.
- Zemp, M., W. Haeberli, M. Hoelzle, and F. Paul. 2006. Alpine glaciers to disappear within decades? Geophysical Research Letters 33:L13504.
- Zhang, Y., S. Liu, Q. Liu, X. Wang, Z. Jiang, and J. Wei. 2019. The role of debris cover in catchment runoff:A case study of the hailuogou catchment, south-eastern Tibetan plateau. Water 11:2601.