Biomarkers are one of the most important hydrocarbon groups in petroleum. Biomarkers can be detected in low quantities (ppm and sub-ppm level) in the presence of a wide variety of other types of petroleum hydrocarbons by the use of the gas chromatography/mass spectrometry (GC/MS). Relative to other hydrocarbon groups in oil such as alkanes and most aromatic compounds, biomarkers are more degradation-resistant in the environment. Furthermore, biomarkers formed under different geological conditions and ages may exhibit different biomarker fingerprints. Therefore, chemical analysis of biomarkers generates information of great importance to environmental forensic investigations in terms of determining the source of spilled oil, differentiating and correlating oils, and monitoring the degradation process and weathering state of oils under a wide variety of conditions. This article briefly reviews biomarker chemistry, biomarker characterization and quantification, biomarker distributions, weathering effects on biomarker composition, bicyclic biomarker sesquiterpanes and diamondoids, diagnostic ratios and cross-plots of biomarkers, unique biomarkers, application of biomarker fingerprinting techniques for spill source identification, and application of multivariate statistical analysis for biomarker fingerprinting.
Introduction
Liquid petroleum (crude oil and the products refined from it) plays a pervasive role in modern society. As the population of the world increases and developing countries become more industrialized, the demand for energy grows worldwide (). Oil is currently the dominant energy source and it is expected to remain so over the next several decades. The worldwide extraction, transportation, and use of petroleum inevitably results in its release to the environment. Oil spills have become a global problem. Based on analysis of data from a wide variety of sources, about 260,000 metric tons of petroleum each year on average are released to the waters off North America. Annual worldwide estimates of petroleum input to the sea exceed 1,300,000 metric tons (CitationNRC, 2002). In Canada, about 12 spills of more than 4000 L are reported each day, of which about one spill is into navigable waters. Most spills take place on land, including oil spills from pipelines, underground storage tanks, and aboveground storage containers. In the United States, about 25 such spills occur each day into navigable waters and about 75 occur on land (CitationFingas, 2001). Although large oil spills from tankers (such as the 1989 Exxon Valdez, 1999 Erika, and 2002 Prestige spills) occur in the marine environment, these spills only make up about 5% of oil entering the sea. Most oil pollution in the oceans comes from the run-off of oil and fuel from land-based sources rather than from accidental spills. Oil poses a range of environmental risks and causes wide public concerns when released into the environment, whether as catastrophic spills or chronic discharges. Therefore, to unambiguously characterize, identify, categorize, and quantify all sources of hydrocarbons entering the environment is very important for environmental damage assessment, evaluation of the relative risks to the ecosystem posed by each spill, and selecting appropriate spill response and taking effective cleanup measures.
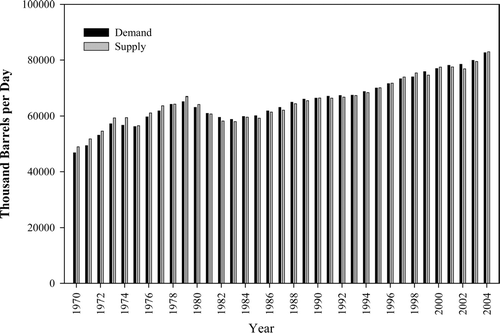
Figure 1 Worldwide demand and supply for liquid petroleum from 1970 to 2004 (data from the US Department of Energy – ref. CitationDOE, 2004).
Biomarkers play a very important role in characterization, correlation, differentiation, and source identification in environmental forensic investigations of oil spills. Biological markers or biomarkers are one of the most important hydrocarbon groups in petroleum for chemical fingerprinting. They are complex molecules derived from formerly living organisms. The biomarkers found in crude oils, rocks, and sediments are stable and show little or no changes in structures from their parent organic molecules, or so-called biogenic precursors (e.g., terpenoids, sterols, and steroids), in living organisms, and thus carry information about the nature, source, type, geological conditions, and thermal history of these organisms. Biomarkers have for many years been widely used in petroleum exploration and reservoir geochemistry to obtain information valuable to geochemists such as the thermal maturity of the oil, the type of source material, the depositional environment of the source rock, the approximate geological age of the source rock, and the degree of biodegradation of the oil. An excellent book, The Biomarker Guide: Interpreting Molecular Fossils in Petroleum and Ancient Sediments, on fundamentals of biomarker characterization, their application in geochemistry, and interpretation of biomarker data for oil exploration, was published in 1993 (CitationPeters and Moldowan, 1993) and the second edition of the book recently has been fully updated and expanded (CitationPeters et al., 2005). This new two-volume book provides a comprehensive account of the role that biomarker technology plays both in petroleum exploration and in understanding earth history and process.
Biomarkers can be detected in low quantities (ppm and sub-ppm level) in the presence of a wide variety of other types of petroleum hydrocarbons by the use of the gas chromatography/mass spectrometry (GC/MS). Relative to other hydrocarbon groups such as alkanes and most aromatic compounds, biomarkers, in particular hopenoids and steroids (including aromatic steroids), are more degradation-resistant in the environment. Furthermore, biomarkers formed under different geological conditions and ages may exhibit different biomarker fingerprints. Therefore, chemical analysis of biomarkers generates information of great importance to environmental forensic investigations in terms of determining the source of spilled oil, differentiating and correlating oils, and monitoring the degradation process and weathering state of oils under a wide variety of conditions. Biomarkers have also proven useful in identification of petroleum-derived contaminants in the marine and aquatic environments (CitationBence et al., 1996; CitationBoehm et al., 1997; CitationHostettler et al., 1999a; CitationKvenvolden et al., 1995, Citation2002; CitationStout et al., 2002; CitationVolkman et al., 1997; CitationWang et al., 1994a, Citation1994b, Citation1999a; CitationZakaria et al., 2000) and in indicating chronic industrial and urban releases (CitationKaplan et al., 1997; CitationStout et al., 1998; CitationVolkman et al., 1992a).
This review focuses on discussion of biomarker chemistry, overview of biomarker separation and analysis, biomarker distributions and weathering effects on biomarker distributions, sesquiterpanes and diamondoids, diagnostic ratios and cross-plots of biomarkers, unique biomarkers, application of biomarker fingerprinting techniques for spill oil source identification, and application of multivariate statistical analysis for biomarker fingerprinting and oil identification.
Biomarker Chemistry
Chemical Composition of Oil
Crude oils consist of complex mixtures of hydrocarbons and non-hydrocarbons that range from small, volatile compounds to large, non-volatile ones. Hundreds to thousands of compounds have been identified in crude oils. Ultrahigh-resolution Fourier transform ion cyclotron resonance mass spectrometry (CitationMarshall and Podgers, 2004) has recently revealed that crude oil contains heteroatom-containing (N, O, S) organic components having more than 20,000 distinct elemental compositions (CcHhNnOoSs). In general, petroleum components are classified in bulk groups of saturates, olefins, aromatics, resin (wide variety of compounds containing sulfur, oxygen, and nitrogen), and asphaltenes (also called SARA analysis).
Saturates are a group of hydrocarbons composed of only carbon and hydrogen with no carbon–carbon double bonds. Saturates are the predominant class of hydrocarbons in most crude oil. Saturates include straight chain and branched chain (also called paraffins) and cycloalkanes (also called naphthenes). Biomarker terpanes and steranes are branched cycloalkanes consisting of multiple condensed five- or six-carbon rings. Sesquiterpanes and diamondoids are smaller cyclic biomarkers, which can be particularly valuable for source identification of lighter petroleum products. Alkenes, commonly referred to as olefins, are partially unsaturated hydrocarbons characterized by one or multiple double carbon–carbon bonds. These compounds are rare in crude oil but may be present in some petroleum products, having been formed during the refining process. Aromatic hydrocarbons are cyclic, planar compounds that resemble benzene in electronic configuration and chemical behavior. Aromatics in petroleum include the mono-aromatic hydrocarbons such as benzene, toluene, and ethylbenzene, and o, m, and p-xylene isomers (BTEX) and other alkyl-substituted benzene compounds (Cn-benzenes), and polycyclic aromatic hydrocarbons (PAHs) (which include oil-characteristic alkylated C0- to C4-naphthalene, phenanthrene, dibenzothiophene, fluorene, and chrysene homologous series and other United States Environmental Protection Agency (US EPA) priority PAHs). Polar compounds are those with distinct regions of positive and negative charge, as a result of bonding with atoms such as nitrogen, oxygen, or sulfur. Heavy oils generally contain greater proportions of higher-boiling, more aromatic, and heteroatom-containing (N-, O-, S-, and metal-containing) constituents. In the petroleum industry, the smaller polar compounds are called resins. Asphaltenes are a class of very large heteroatom-containing compounds (CitationBerkowitz, 1997; CitationSpeight, 1999). They are not dissolved in petroleum but are dispersed as colloids. Asphaltenes are generally defined, based on the solution properties of petroleum residues in various solvents, as the oil constituents precipitated from oils and bitumen by natural processes or in laboratory by addition of excess n-pentane or n-hexane. summarizes the typical bulk composition of some oils and petroleum products.
Table 1 Typical bulk composition of crude oils and petroleum products
The “Isoprene Rule” and Biomarker Families
In 1887, German chemist Otto Wallach determined the structures of several terpenes and discovered that all of them are composed of two or more five-carbon units of isoprene composed of two or more five-carbon units of isoprene methyl-1, 3-butadiene, CH2 = C(C.H3) - CH = CH2]. The isoprene unit maintains its isopentyl structure in a terpene, usually with modification of the isoprene double bonds. Compounds composed of isoprene subunits are called terpenoids or isoprenoids. Terpenoids can be classified according to the number of isoprene units from which they are biogenetically derived, even though some carbons may have been added or lost (CitationConnolly and Hill, 1991). As for the oil saturated terpenoids, they are generally categorized into families based on the approximate number of isoprene subunits they contain. The various oil terpane families are composed of a wide variety of acyclic and cyclic structures (CitationPeters et al., 2005):
As an example, and show molecular structures of some representative acyclic and cyclic terpenoid compounds in oil, respectively. The most common cyclic terpenoids in oil are terpanes, steranes and aromatic steranes. As a summary, lists important biomarker terpane, sterane, and aromatic sterane compounds, used frequently for oil spill identification.
Figure 2 Molecular structures of representative acyclic terpenoid compounds in oil.
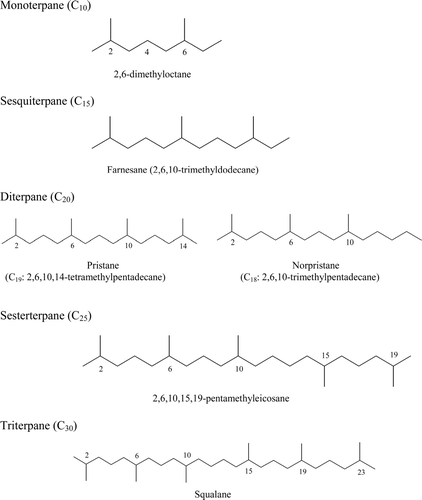
Figure 3 Molecular structures of representative cyclic terpenoid compounds in oil.
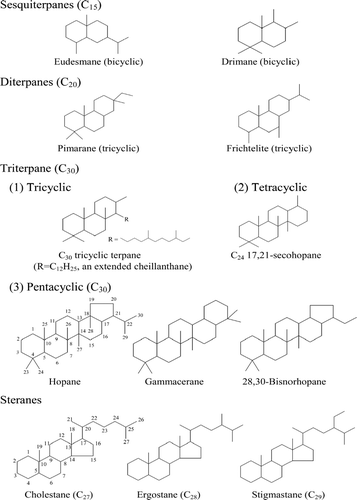
Table 2 Source specific biomarker terpane and sterane compounds for oil spill studies
Labeling System and Nomenclature of Biomarkers
The chemical structures of terpenoids are more complicated than that of normal alkanes and isoalkanes, in particular the three-dimensional nature of the terpenoids' structure. For many terpenoid classes, several names has been proposed for the carbon skeleton, but the basic rules of the International Union of Pure and Applied Chemistry (IUPAC) system are used for nomenclature of biomarkers. For example, acyclic phytane (C20) is named as 2,6,10,14-tetramethylhexadecane.
The labeling system for cyclic penta-cyclic triterpanes and regular steranes is shown in and described as follows: 1) Each carbon atom and the rings in biomarker molecules are labeled systematically. Rings are specified in succession from left to right as the A-ring, B-ring, C-ring, D-ring, etc. 2) A capital “C” followed immediately by a subscript number refers to the number of carbon atoms in a particular compound (e.g., C30 hopane and C27 sterane mean that they contain 30 and 27 carbon atoms, respectively). 3) A capital “C” followed by a dash and numbers refers to a particular position within the compound (e.g., C-17 and C-21 in the 17α, 21β-hopane is the carbon atoms at positions 17 and 21). 4) Prefixes are used to indicate the changes to the normal biomarker carbon skeleton, which include the prefix nor-, seco-, and neo-, and others. summarizes the nomenclature used to modify the structural specification of cyclic biomarkers. The prefix nor- is used to indicate loss of carbons from a carbon skeleton. For example, 25-norhopane is identical to hopane except that a methyl group at the C-25 position has been lost from its point of attachment at the C-10 position (). If two or three carbons are lost, the prefix bisnor- or trisnor- is used respectively. Similarly, the prefix homo- is used to indicate addition of carbons to a carbon skeleton. The prefix seco- is used to indicate cleavage of a bond, with the locants for both ends of the broken bond given, e.g., 3,4-secoeudesmane and 17,21-secohopane. For more information, see the Chemical Abstract Index Guide: Appendix IV (CitationCAS, 2002), which uses these prefixes extensively for some classes of terpenoids.
Figure 4 Labelling system for carbon atoms in C30 hopane (left) and C27 sterane (right).
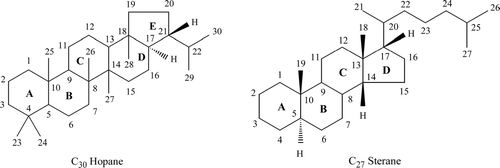
Table 3 Common modifiers and other nomenclature related to cyclic biomarkers
α and β Stereoisomers
Stereoisomers are isomers whose atoms are bonded together in the same sequence but differ from each other in the orientation of the atoms in space. Hydrogen atoms that are below the plane of the molecule are called α hydrogens, and the bond is drawn with a dashed line. Conversely, hydrogen atoms located above the plane of the molecule are called β hydrogens, and the bond is drawn with a wedge bond. In many common ring systems the α hydrogen atoms found at ring junctions are generally omitted from drawings for clarity. Hopanes are previously considered to exist as three stereoisomers: 17α(H), 21β(H)-hopane, 17β(H), 21β(H)-hopane, and 17β(H), 21α(H)-hopane (CitationPeters and Moldowan, 1993; CitationWaples and Machihara, 1991). Hopanes in the β α series are also called moretanes. Hopanes with the 17 α β -configuration in the range of C27 to C35 are characteristic of petroleum because of their greater thermodynamic stability compared with other epimeric series (β β and βα). The ββ series is generally not found in petroleum because it is thermally unstable. The α α series was previously considered not present in oil because of low stability in comparison with the α β and β α series. However, mechanics calculations have shown that the α α -hopanes should be less stable than α β- and β α-hopanes, but more stable than β β-hopanes. Recently, CitationNytoft and Bojesen-Koefoed (2001) showed that moderate quantities of 17α(H), 21α (H)-hopanes are present in several sediments and oils. The ratios of C30 17α (H), 21α (H)-hopane to C30 17α (H), 21β (H)-hopane are typically 0.02–0.04 in crude oils and mature sediments, but ratios up to 0.10 have been found in immature sediments.
R and S Stereoisomers
For biomarkers, the use of R and S nomenclature is generally restricted to carbon atoms which are not part of a ring. The steranes including cholestanes (C27H48), ergostanes (C28H50), and stigmastanes (C29H52) can have R- and S-configuration at the acyclic (chain position) carbon atom C-20 (), resulting in two homologue series with 20R (20R α α α and 20R α β β) and 20S (20S α α α and 20S α β β) configurations. Hopanes with 30 carbons or less show asymmetric centers at C-21 and all ring-juncture carbons including C-5, C-8, C-9 C-10, C-13, C-14, C-17, and C-18. Common homohopanes (C31 to C35) have an extended side chain with an additional asymmetric center at C-22, resulting in two homologues with 22R and 22S configurations. These two homologous homohopanes (22R and 22S) can be well separated by GC/MS as well-resolved doublet peaks, prominent in gas chromatograms of oils.
Biomarker Analysis Methodologies
Oil Sample Preparation, Cleanup, and Fractionation
There are a variety of common sample extraction and preparation techniques including sonication, Soxhlet, supercritical fluid, and accelerated solvent extraction (Fakness et al., 2002a; CitationKaplan et al., 1996; CitationPage et al., 1995; CitationSauer and Boehm, 1991; CitationShort et al., 1996; CitationStout et al., 2002; CitationWang and Fingas, 2003) and some of them have been promulgated by the US EPA and American Society for Testing and Material (ASTM) as oil-contaminated soil extraction and analysis methods such as ASTM Methods 3328 (CitationASTM, 1997a) and 5739 (CitationASTM, 1997b), and some EPA 600 (CitationEPA, 1983 and Citation1986) and 8000 series Methods (CitationEPA, 1997). Solvent extractions and separations of oil hydrocarbons are based on the “like-dissolves-like” principle. Surrogates are often added to monitor extraction efficiency. Glass columns are often used for sample cleanup and fractionation prior to the GC/MS analysis of biomarkers. The advances of oil fingerprinting methodologies, overview of selected US EPA and ASTM methods and their limitations, and qualitative and quantitative aspects and comparison of major oil fingerprinting methods have been described and discussed by CitationFaksness et al. (2002a) CitationStout et al. (2002), and CitationWang et al. (1999a).
As an example, the following briefly describes oil-related sample preparation and biomarker characterization procedures by the Environment Canada Oil Spill Research Laboratory.
Oil Samples: Oil samples are directly dissolved in hexane at a concentration of 50–100 mg/mL. For heavy oils, small amounts (< 5% of the total solvent volume) of dichloromethane (DCM) may be added to help the oil dissolution.
Oil-contaminated water samples: Oil-contaminated water samples are weighed, spiked with appropriate amounts of surrogate standards, and extracted according to the EPA Method 3510: separatory funnel liquid-liquid extraction (CitationEPA, 1996).
Oil-contaminated sediment samples: Oil-contaminated sediment or soil samples are weighed, dried with anhydrous sodium sulphate then spiked with appropriate amounts of surrogate standards. The samples are extracted ultrasonically with 1:1 (v/v) hexane/ DCM, and then twice with DCM alone (if there is visible color in the third extraction, additional extraction should be performed); or Soxhlet-extracted with DCM for 24 hours/overnight. Extracts are combined and concentrated by rotary evaporation, solvent-exchanged to hexane, and evaporated under a gentle stream of dry nitrogen to a final volume of 2 to 10 mL (the final volume depends on the concentration of hydrocarbons in the final extract). An aliquot of the concentrated extract (0.5–1.0 mL) is taken and blown down with N2 to dryness and the residue is weighed on a microbalance to obtain a total solvent extractable material (TSEM)/weight expressed as mg/g of sample. TSEM provides an equal basis for quantitative comparison of petroleum hydrocarbon groups between samples. Based on the TSEM value, appropriate aliquot of the concentrated extract (containing approximately 20 mg oil) is transferred to a 3-g silica gel chromatographic column for sample cleanup and fractionation.
Silica gel is frequently used for cleanup and fractionation of oil extracts (CitationWang et al., 1994a). Saturated hydrocarbons are eluted with hexane (Fraction 1, labeled F1). Aromatic hydrocarbons are eluted with mixture of hexane:dichloromethane (v/v, 1:1, Fraction 2, labeled F2). Saturated biomarkers are eluted with other saturates in F1. Aromatic steranes are eluted in the aromatic fraction, F2.
Internal Standards and Quantification of Biomarkers
For each sample, half of F1 is used for analysis of the total GC-detectable saturates, n–alkanes and isoprenoids, and biomarker compounds; and half of F2 is used for analysis of alkylated PAH homologues and other EPA priority parent PAHs, and aromatic steranes. The remaining halves of the F1 and F2 are combined into one fraction (Fraction 3, labeled F3) and used for the determination of Total Petroleum Hydrocarbons (TPH) and Unresolved complex mixture of hydrocarbons (UCM). The three fractions are concentrated under a stream of nitrogen to appropriate volumes, spiked with appropriate internal standards, and then adjusted to an accurate pre-injection volume (0.50–1.00 mL) for gas chromatography/flame ionization detection (GC-FID) and GC/MS analyses. The C30 17β(H), 21β(H)-hopane is used as internal standard for quantification of C30 17α (H), 21β (H)-hopane and other terpanes (in the range of C19 to C35) and steranes. The deuterated d3 monoaromatic steranes [5α(H)/5β(H),C21H27D3] are used as internal standard for quantification of monoaromatic and triaromatic steranes. The deuterated d18-decahydronaphthalene (cis) and d16-adamantane are used as internal standards for quantification of bicyclic sesquiterpanes and diamondoid compounds, respectively.
Capillary Gas Chromatography/Mass Spectrometry (GC/MS)
The mass spectrometer has long been recognized as the most powerful detector for a gas chromatograph due to its high sensitivity and specificity and its capability to elucidate compound structures. Today, GC/MS (e.g., benchtop quadrupole GC/MS, GC/MS-MS, high-resolution GC/MS, and GC-ion trap/MS) have become the principal and routine techniques used in most oil and environmental forensics laboratories to analyze a wide range of petroleum hydrocarbons including biomarkers. The new-generation GC/MS, which combines chemical separation by capillary column GC, spectral resolution by MS and computerized data preprocessing, enables separation, identification, and quantification of trace amounts of biomarker compounds in oil. Early use of mass chromatograms in organic geochemistry was pioneered at Chevron and led to a stereochemical understanding of steroids and the first practical method of oil fingerprinting based on terpanes and steranes (Seifeit, 1977).
Benchtop Quadrupole GC-MS
The quadrupole is the most common mass separator in use today. The benchtop quadrupole GC/MS systems, although lacking the high-resolution capabilities of larger and more expensive magnetic-sector instruments, have sufficient sensitivity and selectivity for most purposes of biomarker analysis. Benchtop quadrupole GC/MS can be operated in various modes, including the most widely used selected ion monitoring (SIM) mode and scan mode. For quantification of individual biomarker compounds, the SIM mode is mostly selected. In the SIM mode, only a limited number of characteristic ions () are selected and monitored.
Example benchtop GC/MS conditions (Environment Canada Oil Spill Research Laboratory): Analyses of biomarkers are performed on an Agilent 6890 GC coupled with an Agilent 5973 mass selective detector (MSD). System control and data acquisitions are achieved with the Agilent G1701 BA MSD ChemStation. A 30 m × 0.25 mm i.d. (0.25 μm film thickness) HP-5MS fused-silica capillary column is used. The chromatographic conditions are as follows: carrier gas, helium (1.0 mL/min); injection mode, splitless; injector and detector temperature, 280 and 300°C, respectively. The temperature program employed for biomarkers and alkylated PAHs is: 50°C hold for 2 minutes, then ramp at 6°C/min to 300°C and hold for 20 minutes. Prior to sample analysis, the GC/MS is tuned with perfluorotributylamine (PFTBA). The total run time is 60 minutes.
Example benchtop GC/MS conditions (Petrobras Geochemistry Laboratory): A 60 m × 0.25 mm i.d. (0.25 μm film thickness) HP-5MS or equivalent 60-m capillary column is used to achieve improved resolution for biomarkers. The temperature program is as follows: 55°C hold for 2 minutes, ramp at 20°C/min. to 150°C and then 1.5°C to 310°C and hold for 15 minutes. The total run time is 128 minutes.
The 30-m capillary column is used in many environmental forensic labs for most oil spill works. However, the 60-m capillary column with a slow temperature rate and longer running time can offer further improved resolution for some paired biomarker isomers, which may be not well-resolved by the use of a 30-m column. An example of this is given in the next section.
Characteristic Fragment Ions of Biomarkers
Characterization of major biomarker groups is largely achieved using the following MS fragment ions. shows mass spectrometric fragmentation of common biomarkers.
Figure 5 Mass spectrometric fragmentation of common biomarkers.
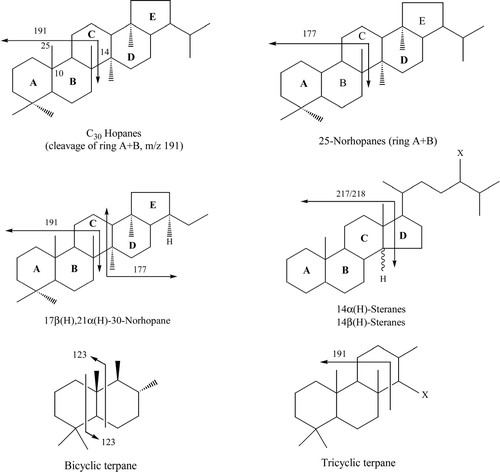
The m/z 191 fragment is often the base peak of mass spectra of cyclic terpanes. It is derived from rings (A + B) of the molecule (), but rings (D + E) may also be the source. The m/z 177 fragment is most likely derived from rings (A + B) of triterpane molecules that have lost a methyl group from position 10, that is, 25-norhopanes (CitationGrahl-Nielsen and Lygre, 1990; CitationVolkman et al., 1983a, Citation1983b). The notable feature of mass spectra for 25-demethylated hopanes is that the m/z 177 fragment has higher intensity than the m/z 191 fragment. Demethylated triterpanes contain different information than the triterpanes and have been suggested as markers for biodegradation (CitationVolkman et al., 1983b). The other triterpanes also give the m/z 177 fragment on electron impact in the mass spectrometer but in lower abundance than the m/z 191 fragment. The fragment is formed by the loss of CH2 from the m/z 191 fragment, and can be seen in all mass spectra of triterpanes. C2918α, 21β−30-norneohopane (C29Ts), which elutes immediately after C29αβ-hopane, has a greater abundance of the m/z 177 ion than of the m/z 191 ion. The proposed mechanism is that m/z 177 ion is derived from the (D + E) ring fragment and stabilized by methyl group at position 14 (CitationGallegos, 1971; CitationKillops and Howell, 1991). By a similar mechanism, C2917β, 21α−30-norhopane (normoretane) also shows significantly greater abundance of the m/z 177 ion than of the m/z 191 ion. The m/z 217 and 218 fragment ions are derived from rings (A + B + C) of most 14α(H)- and 14β(H)-steranes. The βαα and ααα steranes have a base peak at m/z 217, whereas the base peak of αββ steranes is m/z 218. The relative intensities of m/z 149 to m/z 151 fragment ions in the mass spectra of steranes have been used to determine and distinguish between 5α- and 5β-stereoisomers. If the ratio of the m/z 149 ion to the m/z 151 ion is greater than 1, it is 5α-sterane; otherwise, it is 5-β-sterane.
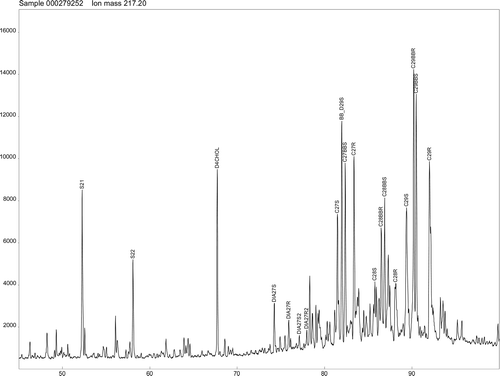
The SIM chromatogram of one ion at given m/z with the GC retention time is often diagnostic of a class of homologous compounds with similar structures but different carbon numbers and isomerism, and can be used for identification. As an example, shows the SIM chromatograms for common biomarker classes in a Kuwait crude oil obtained by using a 60-m column (CitationBarbanti, personal communication, 2004). In total, 38 terpanes from C19 tricyclic terpane to C35 homohopanes (m/z 191) and 19 steranes from C21 to C29 steranes (m/z 217 and 218) have been unambiguously identified and characterized in this Kuwait oil. Less abundant C30 steranes can be clearly recognized as well although confirmation of their identity normally requires MS-MS. Paired biomarker isomers (H29 and C29Ts, H30 and NOR30H) and triplet (TET24 + TR26A + TR26B) are well-resolved.
Figure 6a The SIM chromatogram at m/z 191 for terpanes in a Kuwait oil.
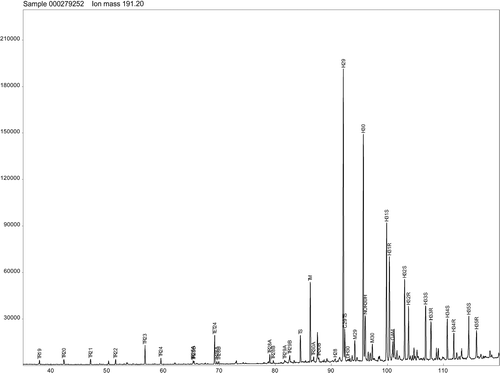
Figure 6b The SIM chromatogram at m/z 217 for steranes in a Kuwait oil.
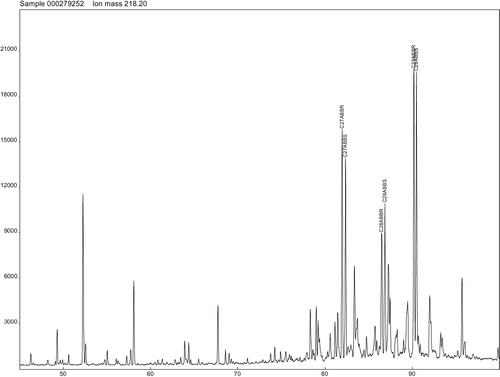
Figure 6c The SIM chromatogram at m/z 218 for steranes in a Kuwait oil.
Quality Assurance and Quality Control
The reliability of methods for biomarker analysis is dependent on the quality control (QC) procedures followed. In order to support oil spill forensic investigations, quality management (including quality assurance [QA] and QC system, updated standard operational procedures, personnel training program and record, up-to-date methodology, equipment management, sample management, and data management) is a fundamental element of the analytical QA program. The chemical measurements must be conducted within the framework of highly stringent, defensible and reliable QA and QC programs (CitationASTM, 1997a and Citation1997b; CitationDouglas et al., 1996 and Citation2004; CitationEPA, 1997, Citation1998a, Citation1998b, Citation2001; CitationETC, 2005; CitationFaksness et al., 2002b; CitationPage et al., 1995; CitationStout et al., 2002; CitationWang et al., 1999a, Citation2003a). The QA/QC programs used by different laboratories may differ, but the principle and purposes are similar.
Biomarker Distributions
Distribution of Biomarkers in Crude Oils
Crude oil compositions vary widely, depending on the oil sources, the thermal regime during oil generation, and the geological migration and reservoir conditions. Crude oils can have 1) large differences in distribution patterns of the n-alkane and cyclic-alkanes as well as UCM profiles; 2) significantly different relative ratios of isoprenoids to normal alkanes; and 3) large differences in distribution patterns and concentrations of alkylated PAH homologues and biomarkers. Various biomarkers can occur in different carbon ranges of crude oils (). In general, GC/MS chromatograms of terpanes (m/z 191) are characterized by the terpane distribution in a wide range from C19 to C35 with C29 αβ- and C30 αβ-pentacyclic hopanes and C23 and C24 tricyclic terpanes being often the most abundant. As for steranes (at m/z 217 and 218), the dominance of C27,C28, and C29 20S/20R homologues, particularly the epimers of αββ-steranes, among the C20 to C30 steranes is often apparent.
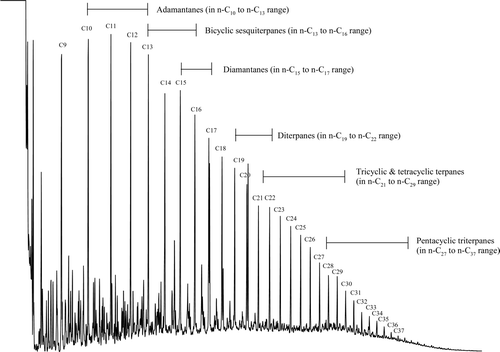
Figure 7 Carbon number range distribution of common cyclic biomarker classes in crude oil and petroleum products.
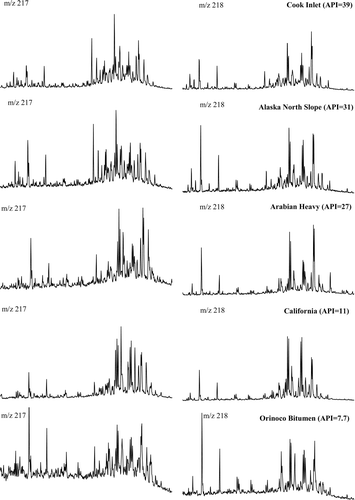
and show GC-MS chromatograms at m/z 191, 217, and 218 for light (API > 35), medium (API: 25–35), and heavy (API < 25) crude oils including Alaska North Slope (ANS), Cook Inlet, Arabian Heavy, Orinoco Bitumen (Venezuela), and California API-11. For comparison, the GC-FID chromatograms for these oils are also shown in . Different from most crude oils, the very light Scotia Light (API = 59) only contains trace amount of C19–C35 biomarkers (only 29 μg/g oil in total, not shown here). The Alaska North Slope oil contains a wide range of terpanes with the C30 αβ and C29αβ hopane as the most abundant. The triplet C24 tetracyclic +C26 (S + R) tricyclic terpanes is highly abundant as well. In contrast, the terpanes in Arabian Heavy and Cook Inlet are largely located in the C27 to C35 pentacyclic hopane range containing only small amounts of tricylic terpanes. In addition, the abundance of C29 αβ hopane is higher than that of C30αβ hopane in Arabian Heavy oil—a feature common in crude oils sourced from carbonate source rock sequences. Notably, the biodegraded California and Orinoco oils exhibit strong biomarker distribution, which demonstrates the resistance of biomarkers to biodegradation.
Figure 8 GC-MS chromatograms at m/z 191 for light to heavy crude oils. For comparison, the GC-FID chromatograms for these oils are also shown in .
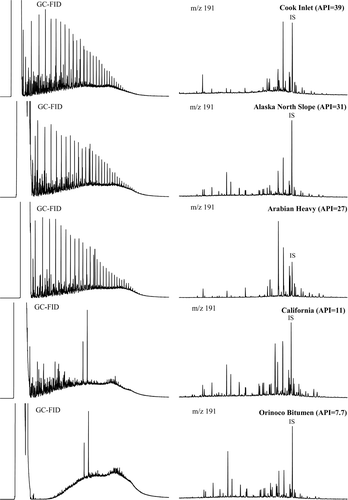
Figure 9 GC-MS chromatograms at m/z 217 and 218 for light to heavy crude oils.
The steranes are present in all five light to heavy crude oils but with different distribution patterns. The characteristic V-shaped C27−C28−C29 regular αββ sterane (m/z 218) distribution is clearly demonstrated, which indicates high thermal maturity. The relative abundances of C27−C28−C29 steranes in oils reflect the carbon number distribution of the sterols in the organic matter in the source rocks for these oils (CitationPeters and Moldowan, 1993; CitationGürgey, 2002). Compared with other oils, the Alaska North Slope oil contains higher amounts of diasteranes as well as C21 and C22 regular steranes. The Arabian Heavy displays markedly higher concentration of C29 αββ steranes than C27 αββ cholestane series and C28 ergostane series.
The dominance of C2817α(H), 18α(H), 21β(H)-28,30-bisnorhopane (BHN28) is particularly prominent in California API-11. A high concentration of C28-28,30-bisnorhopane is typical of petroleum from highly reducing to anoxic depositional environments (CitationMello et al., 1990). The California API-11 oil also demonstrates significantly higher concentration of C35 homohopanes (22S+22R) than C34 homohopanes (22S+22R), further indicating a highly reducing marine environment of deposition with no available free oxygen (CitationPeters and Moldowan, 1993). For Orinoco Bitumen, C23 terpane is the most abundant, followed by the C30 and C29 αβ-hopane. The presence of triplets with different relative distributions is apparent for most heavy oils. Different from many other heavy oils which have somewhat the V-shaped C27−C28−C29 regular αββ sterane (m/z 218) distribution, California API-11 contains far higher levels of steranes, with a more abundant C28 ergostane than C27 and C29 sterane series. This is also the case for several other heavy California oils, including California API-15, Platform Irene, and Sockeye oil (data not shown here).
The distribution of petroleum biomarkers has been applied to investigations of oil spill accidents (CitationBarakat et al., 1999; CitationBence et al., 1996; CitationKvenvolden et al., 1993; CitationPage et al. 1988; CitationWang et al., 1994b, Citation1995a, Citation1998a; CitationZakaria et al., 2000, Citation2001) and to trace the record of hydrocarbon input to San Francisco Bay (CitationHostettler et al., 1999a). CitationDahlmann (2003) demonstrated that Nigerian crude oils from Niger Delta are characterized by the presence of oleanane in relatively high concentrations. The same author (CitationDahlmann, 2003) also found that gammacerane is in high concentrations (up to 50% in relation to C30 αβ-hopane) in the African Angola Cabinda and Gabon crude oils. Recently, biomarkers, together with PAHs and other hydrocarbon characterization results, have been extensively applied to the controversial issue over the origin of petrogenic hydrocarbon background in Prince William Sound of Alaska, site of the 1989 Exxon Valdez oil spill (i.e., whether the petrogenic hydrocarbon background is mainly from eroding Tertiary shales and residues of natural oil seepage, or mainly from Berling River coals and oil from the Katalla area) by two groups of scientists (CitationBoehm et al., 2001, Citation2002; CitationGerald et al., 2002; CitationHostettler et al., 1999b; CitationPage et al., 1995, Citation1996, Citation2002; CitationShort and Heintz, 1997; CitationShort et al., 1999, Citation2004).
Distribution of Biomarkers in Petroleum Fuels
Refined petroleum fuels are obtained from crude oil through a variety of refining processes (CitationOlah and Monnar, 1995; CitationSimanzhenkov and Idem, 2003; CitationSpeight, 2002; CitationStout et al., 2002). Depending on the chemical composition of their “parent” crude oil feed stocks, varying refining approach and conditions, wide range of applications, regulatory requirements, and economic requirements, refined products can have wide variety in chemical compositions.
Light distillates are typically mostly volatile products in the C4 to C13 carbon range. They include aviation gas, naphtha (a liquid petroleum product that boils from about 30°C to approximately 200°C, the term petroleum solvent is often used synonymously with naphtha), and automotive gasoline.
Mid-range distillates are typically products that can span a relatively broader carbon range (C6 to C28) and include kerosene, aviation jet fuels, and lighter diesel products. Jet fuels (including Jet-A, Jet-B, JP-4, JP-5, and JP-8) are similar in gross composition, and compositional differences are often attributable to additives designed to control some fuel parameters. Diesels consist of hydrocarbons in a carbon range of C8 to C28 and contain high levels of n-alkanes, alkyl-cyclohexane, and PAHs. The properties of a given diesel are largely a function of the crude oil feedstock. The GC chromatogram of diesel fuel No. 2 is dominated by a nearly normal distribution of n-alkanes with maxima around n−C11 to n−C14. Also, a central UCM hump is obvious.
Classic heavy fuel types include fuel No. 5 and No. 6 (also known as Bunker C) fuel. The heavy residual fuels are largely used in marine diesel and industrial power generation. Currently, many Bunker type fuels are produced by blending residual oils with diesel fuels or other lighter fuels in various ratios to produce fuel of acceptable viscosity for marine or power plant use.
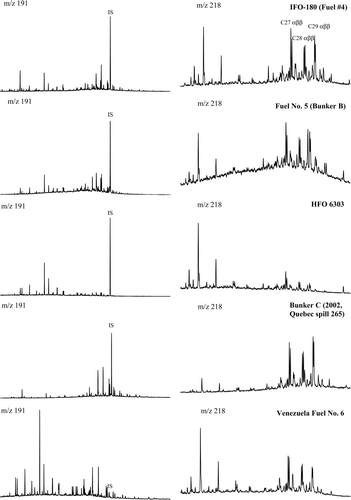
GC/MS chromatograms for biomarker fingerprinting (at m/z 191 and 218) of common light petroleum products and heavy fuel oils are shown in and , respectively. No target terpane and sterane compounds are detected in Jet A fuel. Only traces of smaller terpanes are detected in Diesel No. 2 sampled from an Ottawa gas station in 2002 and the diesel used for 1994 Mobile Burn study (16.3% weathered). For the 2002 Quebec spill diesel sample, both terpanes and steranes with a wider carbon range (C20 to C30) are detected. Relative to other light petroleum products, biomarkers with a much wider carbon range are quite abundant in Korea Diesel No. 2. Clearly, diesels obtained from different crude oil feed stocks and refining process have correspondingly varying biomarker fingerprints. Venezuela Fuel No. 6 is characterized by a distribution in a wide range from C19 to C35, with C23 tricyclic terpanes being the most prominent. As for steranes, the dominance of C27,C28, and C29 20S/20R homologues is apparent. The relative proportion of C27−C28−C29αββ steranes shows a consistent decrease with increasing carbon number (C27 > C28 > C29). The suspected spill source candidate of Bunker C from Quebec has different biomarker distribution pattern with the C29 and C30 hopane and C27−C28−C29 sterane homologous series being prominent. C23 and C24 tricyclic terpanes are the most abundant terpanes in HFO 6303, whereas the level of homohopanes (i.e., from C31 to C35) is close to the detection limit. Furthermore, contrary to most Bunker C type oils, the concentrations of terpanes and steranes are quite low in HFO 6303 (the total target biomarker concentration is only 255 μg/g oil). As for Fuel No. 5, the dominance of C29 sterane peaks, in particular the 20S C29 ααα sterane, in SIM chromatogram (m/z 217, not shown here) is very pronounced.
Figure 10 GC-MS chromatograms (at m/z 191 and 218) for lighter petroleum products.
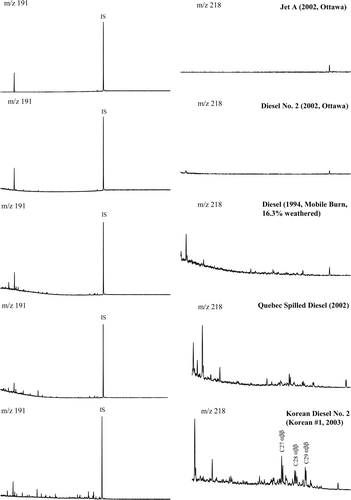
Figure 11 GC-MS chromatograms (at m/z 191 and 218) for heavier fuels.
Distribution of Biomarkers in Lubricating Oils
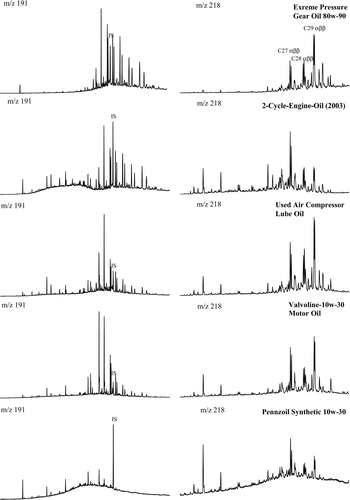
Small-scale spills of lubricating oil are common due to their wide application. Lubricating oil is distinguished from other fractions of crude oil by its high (> 340°C) boiling point region. Lubricating oils can be generally divided into two categories: petroleum derived or synthetic (CitationSpeight, 2002). Synthetic lubricating oils are created by the chemical reaction of several ingredients. Typical carbon-range of lubricating oils is C20 to C45+ and n-alkanes are usually removed by solvent extraction. shows SIM chromatograms of biomarker distributions in lubricating oils. Significant features of the biomarker distribution in petroleum-derived lubricating oils include:
| • | Biomarkers are predominantly located in the high carbon number end. | ||||
| • | Lubricating oils, in general, contain high levels of target biomarkers in comparison with most crude oils and petroleum products. | ||||
| • | The dominance of characteristic pentacyclic C31 to C35 homohopanes is particularly prominent. For example, the concentrations of 22S/22R C31 to C33 homohopanes in the Extreme Pressure Gear Oil 80W-90 are only slightly lower than the most abundant C30 αβ hopane. The dominance of C27,C28, and C29 20S/20R homologues is apparent too. | ||||
| • | The synthetic lubricating oil has a different biomarker distribution pattern from petroleum-derived lube oils. The target biomarkers are low in abundance, and the unresolved humps are particularly pronounced. | ||||
Figure 12 GC-MS chromatograms (at m/z 191 and 218) for biomarker distributions in lubricating oils.
Lubricating oil contamination through engine exhaust and through leakage and spillage occurs everywhere (CitationKaplan et al., 2001). CitationBieger et al. (1996) have reported the use of terpane fingerprints of refined oils and motor exhausts to indicate the presence of and trace the origin of diffuse lubricating oil contamination in plankton and sediments around St. John's of Newfoundland, eastern Canada. Different types of lubricating oils and motor exhausts were found to consistently feature distinct terpane distributions. Variable inputs of automotive and outboard motor oils were clearly recognized through characterization and recognition of the terpane distributions.
Distribution of Aromatic Steranes in Oils and Petroleum Products
Aromatic steranes are another group of biomarker compounds that are highly resistant to biodegradation and can be used for oil-to-oil correlation and oil source tracking (CitationPeter and Moldowan, 1993). shows the mass chromatograms of the C-ring monoaromatic (MA, m/z 253, left panel) and ABC-ring triaromatic steranes (TA, m/z 231, right panel) in the aromatic hydrocarbon fractions of crude oils (NIST 1582 oil and California Platform Irene) and refined products (IFO-180, a lubricating industrial oil, and a Diesel No. 2 from Korea), respectively. Peak identification is summarized in . The m/z 231 mass chromatograms are characterized by series of 20R and 20S C26−C27−C28 triaromatic steranes plus C20 to C22 TA-steranes. All target TA-steranes are well resolved under the present GC conditions except that the C26 20R isomer coelutes with the C27 20S isomer. The m/z 253 mass chromatograms are featured by series of 20R and 20S C27−C28−C295β(H) and 5α(H) MA-steranes, as well as rearranged ring-C 20S and 20R MA-diasteranes (CitationPeters and Moldowan, 1993). The structure of rearranged MA-steranes has been established as 10-desmethyl 5α- and 5β-methyl (20S and 20R) MA-diasterane isomers (CitationMoldowan and Fago, 1986; CitationRiolo and Albrecht, 1985). The triaromatic sterane mass fragmentograms at m/z 231 clearly show fewer and better resolved peaks and are therefore easier to use than the more complicated m/z 253 fragmentograms of monoaromatic steranes, which typically contain several co-eluting peaks.
Figure 13 Left panel: mass chromatograms of the triaromatic steranes (TA, m/z 231). Right panel: mass chromatograms of the monoaromatic steranes (MA, m/z 253) in the aromatic hydrocarbon fractions of crude oils (NIST SRM 1582 oil and California Platform Irene) and refined products (a lubricating oil, and a Diesel No. 2 from Korea).
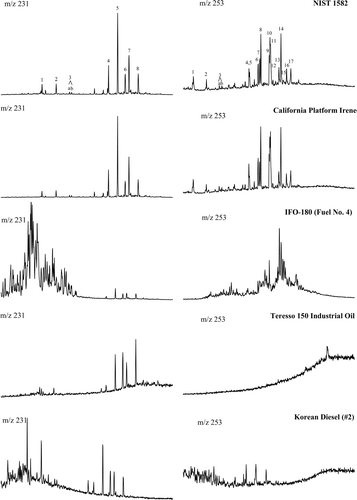
Table 4 Peak identification of the triaromatic steranes (TA-steranes, m/z 231) and monoaromatic (MA-steranes, m/z 253) in the NIST SRM 1582 oil
shows apparent differences in the relative distributions and absolute concentrations of TA- and MA-steranes between oils and refined products. Lubricating oils demonstrate significantly lower concentrations of TA-steranes than crude oils because most aromatic hydrocarbons have been removed during the refining process. The Korea Diesel No. 2 also contains a relatively large quantity of high carbon number TA-steranes. Furthermore, triaromatic steranes are much more abundant than monoaromatic steranes for all oils studied. In many lighter oils such as Cook Inlet, Federated, West Texas, and Scotia Light, only trace MA-steranes are detected. This implies that TA-steranes can be more valuable marker compounds than MA-steranes in forensic investigations. Similarly, lubricating oils do not or only contain trace levels of MA-steranes. Synthetic lubricants (such as Marinus Turbine oil and Valve oil), as expected, should not contain any TA- or MA-sterane compound. However, GC/MS analyses show that apparent TA-steranes are present in the “synthetic 10W-30” lubricating oil (chromatogram not shown), indicating that this lube oil may not be 100% synthesized as claimed and may be composed of portions of petroleum-derived hydrocarbons.
Sesquiterpanes in Oils and Lighter Petroleum Products
The bicyclic biomarkers comprise one of the terpenoid classes. Sesquiterpanes with the drimane skeleton are ubiquitous components of crude oils and ancient sediments. Most bicyclic sesquiterpanes probably originate not only from higher plants, but also from algae and bacteria (CitationAlexander et al., 1984; CitationFan et al., 1991; CitationPhilp, 1985). CitationPhilp et al. (1981) have suggested tricyclic diterpanes from higher plants as a source of bicyclic terpanes through opening of C-ring during maturation. The relative concentration of C14 sesquiterpanes decreases with increasing maturation of the parent organic matter. The concentrations of C14 bicyclic sesquiterpanes are higher at the immature stage, whereas those of C15 drimane and C16 homodrimane are relatively lower. As their higher molecular weight precursors dehydroxylate, the concentrations of drimane (C15) and homodrimanes (C16) gradually increase and the concentrations of C14 sesquiterpanes reduce (CitationCheng et al., 1991).
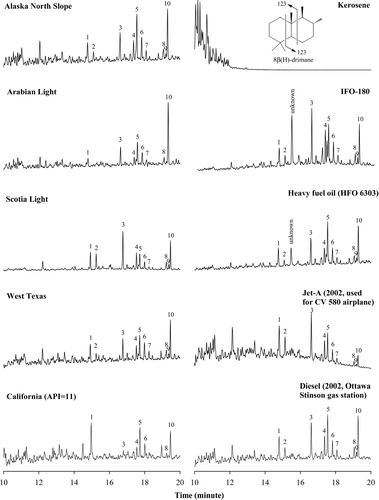
For lighter petroleum products, the high boiling-point pentacyclic triterpanes and steranes are generally absent or in low abundance (), while the smaller sesquiterpanes are more concentrated in these distillates. The sesquiterpanes are monitored using m/z 123, a base fragment ion common to all sesquiterpanes (). Confirmation ions for the sesquiterpanes include m/z 179 (the ion after sesquiterpane C14H26 loses CH3), 193 (the ion after C15H28 loses CH3 and after C16H30 loses C2H5, and 207 (the ion after C16H30 loses CH3). Examination of GC/MS chromatograms of these characteristic ions of sesquiterpanes provide highly diagnostic means of correlation, differentiation, and source identification for lighter petroleum products, in comparison to the use of other hydrocarbon groups. The sesquiterpanes ranging from C14 to C16 elute between n−C13 and n−C16 in the SIM chromatogram of saturated hydrocarbon fraction. Peaks 1 and 2, peaks 3 to 6, and peaks 7 to 10 are identified as C14,C15, and C16 sesquiterpanes, respectively. Among these ten compounds, Peaks 5 and 10 are identified to be 8β(H)-drimane and 8β(H)-homodrimane, respectively. The distribution patterns of sesquiterpanes generally vary in crude oils and in refined petroleum products from different sources. shows GC/MS chromatograms of sesquiterpanes at m/z 123 for example crude oils and petroleum products. ANS, Arabian Light, and Scotia Light have high concentrations of sesquiterpanes, with peak 10 (C16) being the most abundant for the Alaska North Slope and Arabian Light, and peak 3 (C15) the most abundant for Scotia Light, respectively. The Arabian Light has the lowest concentration of C14 sesquiterpanes (peaks 1 and 2), indicating this oil is highly mature. By contrast, the heavy California API 11 oil has the highest concentration of C14 sesquiterpane (peak 1), indicating that this oil may be relatively immature. Sesquiterpanes are absent in very light kerosene and in heavy lubricating oils. However, the IFO-180 and HFO-6303 (a Bunker C fuel) have relatively high concentrations of sesquiterpanes. Jet A is characterized with peaks 3, 5, and 1 being the most abundant, while the diesel sample (2002, Ottawa) is characterized with peaks 5 and 10 being equally abundant and followed by peak 3. Fingerprinting a large number of middle distillate fuels like diesels demonstrate that sesquiterpanes are quite abundant in diesels. The differences in distribution patterns and concentrations of sesquiterpanes are often quite apparent between diesels (CitationStout et al., 2005; CitationWang et al., 2005).
Figure 14 Left panel: GC-MS chromatograms of sesquiterpanes at m/z 123 for light, medium and heavy crude oils including Alaska North Slop (ANS), Arabian Light, Scotia Light oil (Nova Scotia), West Texas, and California API 11. Right panel: Comparison of SIM chromatograms of sesquiterpanes at m/z 123 for petroleum products from light kerosene to heavy fuel oil.
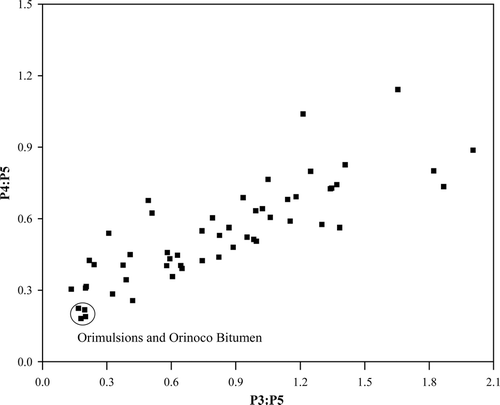
Furthermore, diagnostic ratios of selected paired sesquiterpanes for a large number of oils and petroleum products have also developed. In general, oils from different regions have ratios that cover quite a wide range. For example, plots the ratio of peak 4/peak 5 (C15) versus the ratio of peak 3/peak 5 (C15) for more than 50 crude oils and refined products (both isomers 3 and 4 are normalized relative to isomer 5). It is apparent there is a large scatter in this set of oils in the cross-plot data. The values of peak 4/peak 5 and peak 3/peak 5 fall in ranges of 0.2 to 1.2 and 0.1 to 2.1, respectively. Another feature of is that related oils produce tight clusters on the plot (such as the circle for Orimulsion samples from different batches and of the original Orinoco Bitumen). This observation implies that the ratios of sesquiterpane isomers, in combination with other fingerprinting data, may be used to discriminate different oils and to identify the source of spill samples. Oil spills were reported and sampled on March 17 and 23, 1998, at a sewer outlet flowing into the Lachine Canal in Quebec. Following the accident, a diesel fuel, which was suspected to be the source of the spill, was collected from a reservoir at a pumping station located in Lachine, Quebec. Biomarker fingerprinting of the samples revealed that only trace amounts (< 10 μ g/g oil) of C19−C24 tricyclic-terpanes, regular C20−C22 steranes, and diasteranes were detected. However, the spill samples contained significant amount of sesquiterpanes. The GC/MS/SIM chromatogram (at m/z 123) and diagnostic ratios of target sesquiterpanes of the spill samples were found to be nearly identical to that of the suspected-source diesel. The only noticeable difference is that, compared with the suspected-source diesel, the spilled sample had slightly higher abundances due to weathering. These similarities, in combination with other hydrocarbon quantification results such as bulk hydrocarbon groups, n-alkane distribution, and fingerprints of alkylated PAHs and diagnostic ratios of source-specific PAH compounds (CitationWang et al., 2000), argued strongly that the suspected diesel collected from the pumping station close to the spill site was the source of the spilled diesel.
Figure 15 Cross plots of double ratios of Peak 4/Peak 5 versus Peak 3/Peak 5 of sesquiterpanes for over 50 different oils and refined products.
Diamondoid Compounds in Oils and Lighter Petroleum Products
The group of diamondoids (collective term for adamantane (C10), diamantane (C14), and their alkyl homologous series) is another group of low-boiling cyclic biomarkers of interest to environmental forensic scientists. Admantane was first discovered in crude oils in the early 1930s. Diamondoids are rigid, three-dimensionally fused cyclohexane-ring alkanes that have a diamond-like (cage-like) structure (CitationChen et al., 1996; CitationDahl et al., 1999; CitationGrice et al., 2000) and have been identified in crude oils (CitationPetrov, 1987; CitationWilliams et al., 1986; CitationWingert, 1992). The diamond structure endows these molecules with a high thermal stability and resistance to biodegradation. The laboratory thermal cracking experiments (CitationDahl et al., 1999) showed that diamondoids have a higher thermal stability than most other hydrocarbons during thermal cracking of oil; therefore, diamondoids become increasingly enriched in the residual oil or condensate. The increase in methyldiamantane (C15) concentration is directly proportional to the extent of cracking, indicating that, under the conditions of the experiments, diamondoids are neither destroyed nor created. Instead, they are conserved and concentrated and hence can be considered a naturally occurring internal standard by which the extent of oil cracking can be determined. Adamantanes and diamantanes elute in the ranges of n−C10 and n−C13 and n−C15 and n−C17, respectively, in the GC/MS chromatogram of saturated hydrocarbon fraction. As an example, shows the total ion chromatograms of the diamonoid compounds in Prudhoe Bay oil. At least 26 diamondoid compounds can be identified and among these 17 are adamantanes and nine diamantanes. Peak assignments are presented in . Identification of diamondoid hydrocarbons are based on mass spectral data, comparison with standards, and assignments in the literature (CitationChen et al., 1996; CitationWingert, 1992). Adamantane and its alkyl substituted homologues are analyzed at m/z 136 (for adamantane), 135 (for methyl-adamantanes), 149 (for dimethyl-adamantanes), 163 (for trimethyl-adamantanes), and 177 (for tetramethyl-adamantanes), whereas diamantane and its alkyl substituted homologues are measured at m/z 188 (for diamantane), 187 (for methyl-diamantanes), 201 (for dimethyl-diamantanes), and 215 (for trimethyl-diamantanes). Studies on application of diamondoid hydrocarbons in the chemical fingerprinting of natural gas condensate and gasoline (CitationStout and Douglas, 2004) and of crude oils and refined products (CitationWang et al., 2005) have been recently reported.
Figure 16 GC-MS chromatograms of diamondoid compounds in Prudhoe Bay oil for peak identification.
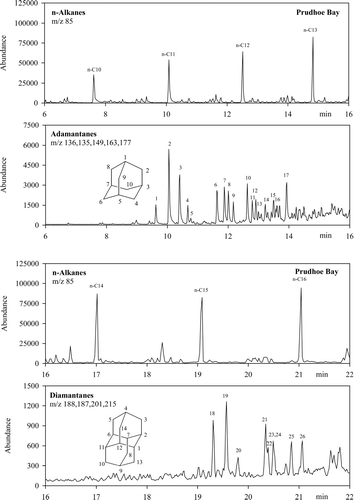
Table 5 Peak identification of diamondoid compounds in Prudhoe Bay oil
Comparison of Biomarker Distribution for Oil Correlation and Differentiation
Oils and petroleum products from different sources may have different distribution patterns of biomarkers. Various biomarkers can occur in different carbon ranges (). Also, the abundances or concentrations of individual biomarkers could be markedly different. Therefore, qualitative and quantitative comparisons of biomarker distribution are important for spill/source identification and correlation. In general, comparison of biomarker distribution for oil correlation and differentiation involves the following steps:
| • | Whether target biomarkers detected in spill samples can be found in the same defined carbon range of suspected source candidates; | ||||
| • | Whether the distribution patterns and profiles of biomarkers are matching; | ||||
| • | Whether the abundances of target biomarkers are matching; | ||||
| • | Whether there are any unique or unknown biomarker compounds; and | ||||
| • | Whether the diagnostic ratios of the major biomarkers are matching. | ||||
In most cases, disparity (i.e., no matching) among biomarker distributions is strong evidence for lack of correlation between spill sample(s) and suspected source(s). Matching may be an indication of correlation of spill sample(s) and suspected source(s), but it is not necessarily a “proof” that samples are from the same source. Based on analysis of triterpane distribution patterns and determination of two pentacyclic C27 triterpanes, CitationShen (1984) distinguished four Arabian crudes, which in their weathered forms were extremely similar. CitationVolkman et al. (1992b) determined the distribution of various biomarker compounds in a range of aquatic sediment samples to confirm the presence of oil contamination and identify possible oil sources. Among a number of pollution sources, lubricating oils were identified as a major source of hydrocarbon pollution in many estuaries and coastal areas around Australia. CitationCurrie et al. (1992) proposed utilization of triterpanes to distinguish tarballs originated from Southeast Asia from those of Australian petroleum sources. CitationBarakat et al. (1997) studied the biomarker distribution within five crude oils from the Gulf of Suez, Egypt. The results revealed significant difference in biomarker distribution within the oils, and the oils can be categorized into three groups. Type 1 oils show a high relative abundance of gammacerane, indicating a marine saline-source depositional environment. Furthermore, these oils have a predominance of C35 to C34 17α(H)-homohopanes. Type 2 oils have an oleanane content of more than 20% of the concentration of C30 α β hopane, indicating they originated from an angiosperm-rich, tertiary source rock. Type 3 oil has geochemical characteristics intermediate between type 1 and 2 oils. CitationWang et al. (1999b) studied oil spilled after a fire broke out at a carpet factory in Acton Vale, Quebec, on June 29, 1998. The GC/FID chromatograms of the spill samples were markedly different from the suspected-source sample. Spill samples were highly weathered. However, the GC/MS biomarker analysis demonstrated that the distribution pattern of biomarker terpanes and steranes were nearly identical for the highly weathered spill and the relatively fresh suspected-source samples. In addition of the presence of the regular biomarkers from C21 to C35,C30−β α hopane of high abundances were also observed. It was concluded that the spilled oil was a Bunker C type fuel, and it matched with the oil in the heat exchange equipment near the boiler, suggesting the oil spilled in the river came from the burned factory.
In some cases, unknown oil samples may have very similar bulk chemical composition but markedly different biomarker distribution. On March 28, 2001, three unknown oil samples were received from Montreal for product characterization, correlation, and differentiation. The GC/FID screening results show that three samples are hydraulic fluid type products. The samples have very similar GC profiles. However, biomarker characterization results demonstrated that samples 1 and 2 are nearly identical in biomarker distribution patterns and concentrations, but sample 3 shows significantly different biomarker distribution from samples 1 and 2 (CitationWang et al., 2002). Concentrations of C29 and C30 hopanes in sample 3 match those in samples 1 and 2. Conversely, concentrations of C23 and C24 and the sum of C31 to C35 homohopanes are markedly lower and higher, respectively, than those of the corresponding compounds in samples 1 and 2. Consequently, the diagnostic ratios of target biomarkers are very similar for samples 1 and 2, but apparently different from sample 3. All these observations point toward the conclusion that samples 1 and 2 are identical, whereas sample 3 comes from another source.
Diagnostic Ratios (Indices) and Cross-Plots of Biomarkers
Biomarker diagnostic parameters have been long established and are widely used by geochemists for oil correlation; determination of organic input and precursors; depositional environment; assessment of thermal maturity; and evaluation of in-reservoir oil biodegradation (CitationPeters et al., 2005). Many diagnostic ratios currently used in oil spill studies and environmental forensics originate from geochemistry.
Diagnostic Ratios of Biomarkers
Genetic oil–oil correlations are based on the concept that the composition of biomarkers in spill samples does not differ from those of the candidate source oils. Most biomarkers in spill samples and source oils, in particular those homologous series of biomarkers with similar structure, show little or no changes in their diagnostic ratios. An important benefit of comparing diagnostic ratios of spilled oil and suspected source oils is that concentration effects are minimized. In addition, the use of ratios tends to induce a self-normalizing effect on the data because variations due to the fluctuation of instrument operating conditions day-to-day, operator, and matrix effects are minimized. Therefore, comparison of diagnostic ratios reflects more directly differences of the target biomarker distribution between samples.
Diagnostic ratios (DRs) can either be calculated from quantitative (i.e., compound concentrations) or semi-quantitative data (i.e., peak areas or heights). Ratios of compound concentrations or double normalized DRs as those proposed by CitationChristensen et al. (2004) describe the relative chemical composition. Three types of DRs are listed in the following.
Table 6 Diagnostic ratios of biomarkers frequently used for the environmental forensic studies*
The triplet ratio, if present, generally varies in oils from different sources and is dependent upon sources, depositional environment, and maturity. The ratio was first used by CitationKvenvolden et al. (1985) to study a North Slope crude, in which the ratio is ∼2. The spilled Exxon Valdez oil (an Alaska North Slope crude) and its residues also have triplet ratios of ∼2. Conversely, many tarballs and residues collected from the shorelines of the Prince William Sound were similar to each other but chemically distinct from the spilled Exxon Valdez oil with triplet ratios of ∼5. The triplet ratio, combined with other diagnostic biomarker ratios and isotopic compositions, revealed that these non-Valdez tarballs originated from California with a likely source being the Monterey Formation (CitationKvenvolden et al., 1995). During the Arrow oil spill work, the ratio of the most abundant C29 to C30 hopane as well as C23/C24, Ts/Tm, and αββ/(αββ +α α α) of C27,C28 and C29 steranes were defined and used by CitationWang et al. (1994b) as reliable source indicators. Similar approaches, combined with determinations of a number of other “source-specific marker” ratios, were applied to characterize oil samples from the Arctic Baffin Island spill (CitationWang et al. 1995a), oil on birds (CitationWang et al., 1997), the 25-year old wetland Nipisi spills (CitationWang et al., 1998a), a mystery spill in Quebec (CitationWang et al., 2001a), and the Detroit River oil spill (CitationWang et al., 2004). CitationBarakat et al. (2002) have proved the molecular ratios of triaromatic steranes including C28TA 20R/C28TA 20S, C27TA 20R/C28TA 20R, and C28TA 20S/(C26TA 20R + C27TA 20S) were useful source indicators for correlating naturally weathered oil residues in the Egyptian Western Desert to a fresh crude oil sample of the Western Desert-sourced oil. In January and February 1996, a significant number of tarball/patty incidents occurred along the coasts of Vancouver Island, Washington, Oregon, and California. Samples of the tarballs were collected from the affected beaches and characterized by GC/FID and GC/MS, and further analyzed using a carbon isotopic technique (CitationWang et al., 1998b). Biomarker characterization revealed that the British Columbia and California samples have similar diagnostic ratios of most biomarkers, but the California samples show lower ratios of C23/C30 and C24/C30 than the British Columbia samples. Only after in combination with characterization results of PAHs and PAH DRs, it was defensively concluded that: 1) California/Oregon samples were chemically similar and consistent with the same source of a bunker type fuel; 2) British Columbia tarball samples were chemically similar and consistent with the same source (also bunker type fuel). They were similar to the California/Oregon samples but may have a different source; 3) the spilled samples had been highly weathered since release, and the California samples were more heavily weathered than the BC samples; and 4) the source of the tarball samples was neither Alaska North Slope nor California Monterey Miocene oil.
In application of DRs of biomarkers for spill studies, it is important to acknowledge that regardless of diagnostic parameters used, a basic rule applied to all correlations and differentiations should be:
| • | No matching of biomarker distribution and/or DRs is strong evidence for lack of a correlation between spill sample(s) and suspected source(s); and | ||||
| • | Matching may be an indication of correlation of spill sample(s) and suspected source(s), but is not necessarily a “proof” for identity. | ||||
Hence, in order to make more reliable and defensible correlations, the use of a “multi-criteria approach” is often a prerequisite. In a multi-criteria approach the final conclusion is based on analysis and evaluation of the distribution of more than one suite of petroleum compounds (CitationChristensen et al., 2004; CitationDaling et al., 2002; CitationPeters et al., 2005; CitationStout et al., 2002; CitationWang et al., 1999a).
Cross-Plots of Biomarkers
Cross-plots (i.e., plot of one diagnostic biomarker ratio vs. another ratio) are frequently used in oil geochemistry for oil–oil correlation and determination of oil source and depositional environment. Cross-plots have, for example, been used extensively (CitationJiang and Li, 2002; CitationJiang et al., 2001; CitationLi and Jian, 2001) in the project of Bakken/Madison petroleum systems in the Canadian Williston Basin for oil-source rock correlations and for distinguishing two source rocks with distinct distribution patterns of biomarkers. CitationGürgey (2002) analyzed 56 rock and 28 crude oil samples from the sub-salt and supra-salt section of the southern Precaspian Basin. Source-specific biomarker ratios reveal two populations: Population 1 and Population 2. Seifeit and CitationMoldowan (1986) applied cross-plots of C29 α β β/(α β β +α α α) sterane versus C29 20S/(20S + 20R) steranes as a particularly effective measure in describing the thermal maturity of source rocks or oils. Based on cross-plots of relative abundance (at m/z 123) of various isomeric sesquiterpanes versus relative abundances of bicadinanes to C30 hopane on the m/z 412 mass chromatogram (bicadinane-T/C30-hopane), crude oils from the eastern Pearl River Mouth Basin were classified into two groups (CitationZhang et al., 2003).
Malaysian coasts are subjected to various threats of petroleum pollution including deliberate and accidental oil spills from various sources. The identification of detailed sources of the oil pollution, therefore, is essential to reduce the oil pollution through effective regulation. Based on chemical evidence that Middle East crude oils were characterized by C2917α, 21β-norhopane and C31-C35 homohopanes, whereas these compounds were depleted in Southeast Asian crude oils, Zakaria et al. (Citation2000 and Citation2001) proposed utility of the cross-plots of C29αβ/C30α β hopane ratio versus the homohopane index Σ (C31−C35)/C30 hopane as key biomarker indicators and successfully distinguished a large number of tarball samples that originated from Southeast Asian crude oil sources from those of Middle East sources.
As described previously, cross-plots of double ratios of sesquiterpanes peak 4/peak 5 (C15) versus peak 3/peak 5 (C15) for more than 50 crude oils and refined products are shown in . Different oils clearly demonstrate different values of peak 4/peak 5 and peak 3/peak 5. Furthermore, related oils (such as Orimulsion samples from different batches) produce a tight cluster on the plot, indicating that they originate from the same source oil: Orinoco Bitumen.
Unique Biomarker Compounds
Biomarker terpanes with a hopane skeleton and steranes are common constituents of crude oils. However, some biomarker compounds including several geologically rare acyclic alkanes are found to exist only in certain oils and can, therefore, be used as unique markers for oil spill identification. The ratios of these unique biomarkers can furthermore provide additional diagnostic information on the types of organic matter that give rise to the crude oil. Some unique biomarkers (), which have been used to identify new class of oils by geochemists and environmental chemists, are summarized below:
Figure 17 Molecular structures of a selection of unique biomarkers: Botryococcane (C34H70), bicardinanes, C30 17α (H)-Diahopane, 18α (H),21β (H)-30-norneohopane (C29Ts), 18α (H)-oleanane, 18β (H)-oleanane, 4α -methyl-24-ethyl-cholestane, C30 dinosteranes (4α, 23,24-trimethyl-cholestanes), and macrocyclic alkanes and methylated macrocyclic alkane.
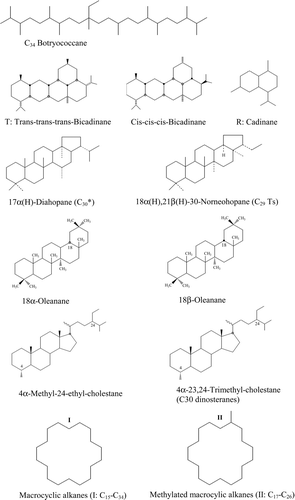
Botryococcane (C 34 H 70, m/z 183): Botryococcane is an irregular C34-isoprenoid compound, which is derived from botryococcene known in a fresh to brackish water lacustrine green algae. The occurrence of botryococcane in petroleum is limited to a few geographic regions, including Australia (CitationMckirdy et al., 1986) and Sumatra (CitationSeifeit and Moldowan, 1981). Therefore, characterization of this geologically rare botryococcane can be highly specific. CitationMckirdy et al. (1986) identified botryococcane in a new class of Australian non-marine crude oils, and detected exceptionally high concentrations of botryococcane (C34 botr/n−C29 = 0.3−0.7) in coastal bitumens from southern Australia (CitationMckirdy et al., 1994). CitationHwang et al. (2002) used botryococcane as an effective key source indicator to genetically separate the highly similar Sumatra oils into five groups. On the contrary, commonly used source indicators including homologous distribution of steranes, diasteranes, and hopanes are unable to genetically group most of the studied Sumatra oils. Methyl-hopane (CH 3−C 30 H 51, m/z 205): Ring A and B methyl-hopane were first detected in a series of Jurassic oils from the Middle East (CitationSeifeit and Moldowan, 1978). The ring A/B fragment of the hopane series, normally m/z 191 (), is increased to m/z 205 by the additional methyl group. The most prominent series of these compounds identified in Precambrian oils has been identified as 2α -methyl-17α (H),21β(H)-hopane (CitationSummons and Jahnke, 1992). Based on the fact that methyl-hopanes are major polycyclic biomarkers in some Middle East oils from carbonate source strata but are uncommon in Australian oils, lubricating oils, which contaminated many estuaries and coastal areas around Australia, were identified to be originated from Middle East crudes (CitationVolkman et al., 1992a). Extended hopanes beyond C 40: Hopanes with 30 or fewer carbon atoms are often interpreted as diagenetic products of C30 hopanoids, while the extended hopanes (C31−C35) have been related to C35 precursors, such as bacteriohopane polyols, aminopolyols, and a number of composite hopanoids (CitationOurisson and Albrecht, 1992; CitationRohmer et al., 1992). A series of side-chain extended 17α(H), 21β(H)-hopanes and 17β (H), 21α (H)-hopanes up to C44 has been identified in crude oils and source rock extracts in the Liaohe Basin, northeast China (CitationWang et al., 1996). These compounds may be viewed as the representatives of a new class of molecules whose natural distribution and biological significance remains to be determined. Bicadinanes (C 30 H 52, m/z 191 and 217): Bicardinanes are C30-pentacyclic biomarker compounds and have three configurations, labeled as W (cis-cis-trans-bicadinane), T (trans-trans-trans-bicadinane), and R (cardinane). The mass spectra of bicadinane contain prominent m/z 191 and 217 fragments, whereas peaks can appear in corresponding chromatograms of both hopanes and steranes. All three bicadinanes (W, T, and R form) elute prior to C29 hopane in the m/z 191 chromatogram. But it can be conveniently monitored with little interference using the m/z 412 fragmentogram. They are highly specific for resinous input from certain families of higher plants (van CitationAarssen et al., 1990). Based on bicadinane composition, crude oils from the north, central, and south Sumatra Basins, Indonesia were classified into three types (CitationSosrowidjojo et al., 1994), and Group II oils were further distinguished from Group 1 oils by their high abundance of bicadinanes relative to C30 hopane on the m/z 412 mass chromatogram.
C 3017α(H)−diahopane (C 30 H 52 ): CitationMoldowan et al. (1991) identified two rearranged hopanes from Prudhoe Bay oil, C30 17α (H)-diahopane (C30*) and 18α(H), 21β(H)-30-norneohopane (C29Ts) by x-ray crystallography and advanced NMR methods. C30* elutes right after C29α β norhopane and C29 Ts in the m/z 191 mass chromatogram. C30 17α (H)-diahopane has been regarded as a possible terrestrial marker. Recently, CitationEl-Gayar et al. (2002) characterized seven oils representing the different petroleum-bearing basins in the Western Desert, Egypt. The characterization indicated that Type 2 and Type 3 oils are similar and show relative high pristane/phytane ratios, paucity of C30 steranes, and high relative abundance of C30*, suggesting that they probably originated from source rocks containing significant proportions of higher plant material.
18α (H)−oleanane: Oleanane has two isomers: 18α (H)-oleanane and 18β(H)-oleanane. The α-type configuration has the higher thermodynamic stability, thus, it is the predominant configuration in mature crude oils and rocks (CitationRiva et al., 1988). 18α (H)-Oleanane is a biomarker found only in Tertiary and Cretaceous (< 130 million years) rocks and oils. No examples of oleananes have been found in oils known to be older than Cretaceous. 18α(H)-Oleanane is highly specific for angiospermous plant input. The presence of 18α (H)-oleanane in benthic sediments in Prince William Sound, combined with its absence in Alaska North Slope crude and specifically in Exxon-Valdez oil and its residue, confirmed another petrogenic source (CitationBence et al., 1996; CitationKvenvolden et al., 1993; CitationPage et al., 1996). Characterization of 18α(H)-oleanane in oils from the Anaco area and Maturin subbasin, Venezuela, has been used for organic type and age indicator for assessment of Venezuelan petroleum system (CitationAlberdi and Lopez, 2000).
4-Methyl steranes: The 4-methyl steranes can be divided into two major classes: 1) C28−C30 analogues of the steranes at positions 4 and 24 (e.g., the C30 sterane is 4α -methyl-24-ethyl-cholestane), and 2) C30 dinosteranes (e.g., 4α,23,24-trimethyl-cholestanes). 4α-Methyl-24-ethyl-cholestanes often occur in relatively high abundance in Tertiary source rocks and related oils from China (CitationFu et al., 1992). For example, almost all of the oils from the eastern Pearl River Mouth Basin contain significant amounts of 4-methyl-steranes (CitationZhang et al., 2003). CitationHu (1991) found that 4-methyl-steranes in the range of C28−C30 are unusually rich (20–40% of the total steranes) in certain oils from terrestrial facies within the South China Sea. C30 4-methyl-sterane (M+ = 414) is particularly abundant among the 4-methyl-steranes. CitationRogers et al. (1999) have investigated oil seeps and stains from the East Coast Basin, New Zealand. They found that oils sampled from Hawkes Bay and Wairarapa have higher abundances of C30 regular steranes and 28,30-bisnorhopane than oil seeps from the Raukumara Peninsula and Marlborough. These biomarker analysis results have been used to distinguish at least two distinct sources of hydrocarbons in the basin.
Dinosterane has only been reported in petroleum younger than Triassic age (CitationSummons et al., 1992). The presence of dinosterane in relatively high concentrations in asphaltic bitumens from southern Australia (CitationMckirdy et al., 1994) suggests that their source is no older than mid-Triassic. In a study to re-evaluate the petroleum prospective potential in southeast Australia, CitationVolkman et al. (1992b) examined 10 bitumen samples collected between 1880 and 1915. The high proportions of C27 steranes and presence of C30 steranes including dinosteranes suggested that the bitumens were derived from a marine source rock containing mainly marine organic matter.
Macrocyclic alkanes: CitationMurrisepp et al. (1994) first reported the presence of non-isoprenoidal macrocyclic-alkanes in sedimentary material and tentatively identified these cyclic hydrocarbons of the cyclododecane and cyclohexadecane series in the non-aromatic hydrocarbon fractions of the semi-coking oil from an Estonian oil shale. Recently, Audino et al. (Citation2001 and Citation2002) have unambiguously identified for the first time a new class of cyclic hydrocarbon biomarker, macrocyclic alkanes and their methylated analogues in a Botryococcus braunii–rich sediment (torbanite) of Late Carboniferous age (CitationAudino et al., 2001) and in two Indonesian crude oils (CitationAudino et al., 2002). The compounds consist of a homologous series of macrocyclic alkanes in a wide range from C15 to C34 and their methylated derivatives (ranging from C17 to C26). The distribution of macrocyclic alkanes was measured at the characteristic ion m/z 111. The macrocyclic alkanes appear to be novel markers of B. braunii and add to the catalogue of the characteristic hydrocarbons derived from this algae. More importantly, these compounds could be original markers specific to highly resistant algaenan of B. braunii in sediments and crude oils.
The search for unique geochemical biomarkers continues to be a fertile area of research for fingerprinting similar sources of petroleum. Note, however, that reliable biomarker interpretation is usually based on a whole biomarker distribution chromatogram and a series of biomarker parameters. There is no single parameter that can be exclusively used for unambiguous source identification of unknown spills. Individual unique biomarker parameters only become valuable and meaningful when they are used together and agree with other biomarker parameters.
Effects of Weathering on Chemical Composition of Oil and Biomarkers
Weathering is defined as the combination of a wide variety of physical, chemical, and biological processes which affect the composition of spilled oil in the environment (CitationNRC, 2002; CitationJordan et al., 1980; CitationWang and Fingas, 1995). The main weathering processes include 1) evaporation, 2) emulsification, 3) natural dispersion, 4) dissolution, 5) microbial degradation, 6) photooxidation, and 7) other processes such as sedimentation, adhesion onto surface of suspended particulate materials, and oil-fine interaction. In the short term after a surficial oil spill, evaporation is usually the single most important and dominant weathering process, in particular for the light petroleum products such as gasoline. Evaporation has the greatest effect on the amount of oil remaining on water or land after a spill. In the first few days following a spill, the loss can be up to 70% of the volume of light crudes and petroleum products, and gasoline can evaporate nearly completely above zero degrees under certain circumstances. For heavy or residual oils, such as Bunker C oil, the losses due to evaporation comprise only a small percentage of the total volume. The rate at which oil evaporates depends primarily on the oil composition. The more volatile components an oil or fuel contains, the greater the extent and rate of its evaporation (CitationFingas, 1995).
Chemical Composition Changes of Oils Due to Weathering
Weathering causes considerable changes in the physical properties and the chemical composition of spilled oil. The degree (lightly, moderately, or severely weathered) and rate of weathering is different for each spill and is controlled by a number of spill conditions and natural processes, such as: 1) type of the spilled oil and the chemical composition and concentrations of oil components; 2) spill site and environmental conditions; and 3) natural population of indigenous bacteria. Weathered oil samples can generally be divided into three groups based on degree of changes in their chemical composition:
| 1. | Lightly weathered oils (< 15% naturally weathered): the abundances of low-end n-alkanes are significantly reduced. Furthermore, BTEX and C3-benzene compounds are lost. | ||||
| 2. | Moderately weathered oils (∼ 15–30% weathered): a significant loss of n-alkanes and low-molecular-weight isoprenoid compounds has occurred. BTEX and C3-benzenes could be completely lost (CitationWang et al., 1995b), and the loss of lighter C0 and C1- naphthalenes can be significant. The ratio of GC-resolved peaks to UCM is decreased considerable due to the preferential loss of resolved hydrocarbons over the unresolved complex hydrocarbons. | ||||
| 3. | Severely weathered oils: not only n-alkanes but also branched and cyclo-alkanes are heavily or completely lost, and the UCM is pronounced. The BTEX and alkyl benzenes are completely lost. PAHs and their alkylated homologous series could also be highly degraded, resulting in development of a profile in each alkylated PAH family with the distribution of C0− < C1− < C2− < C3−. | ||||
Hence it is a difficult and often impossible task to identify severely weathered oil samples through recognition of n-alkane and PAH distribution patterns. However, the biomarker distribution patterns are often unaltered even in severely weathered oil samples. Thus, fingerprinting terpane and sterane biomarkers provides a powerful tool for tracking the source and correlation and differentiation of weathered oils.
Effects of Weathering on Composition of Biomarkers
The chemical composition changes of numerous oils and petroleum products with various weathering percentages by evaporation have been thoroughly studied as part of the Environment Canada Oil Spill Research Program. The studied oils include the Alberta Sweet Mix Blend oil (0% to 45% weathered) (CitationWang and Fingas, 1995); 19 EPA oils (CitationEPA Report, 2003; CitationWang et al., 2003a), and six US Mineral Management Service oils (CitationWang et al., 2003b). For example, when the Alaska North Slope oil was weathered by evaporation from 0% to 31%, the loss of lower molecular weight n-alkanes and PAHs and alterations in their relative distributions were apparent. Conversely, no evaporative losses were observed for biomarkers ().
Figure 18 Distribution of terpanes (m/z 191) and steranes (m/z 218) for the ANS oil samples with evaporative weathering percentages at 0 and 31%.
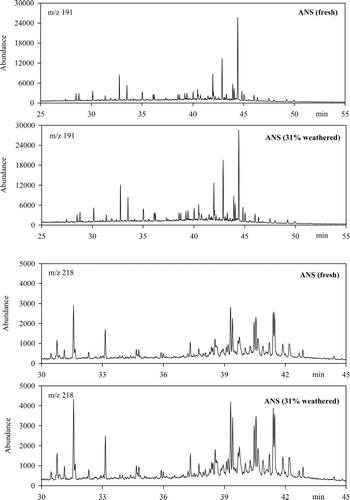
Microbial degradation of petroleum hydrocarbons represents one of the main mechanisms by which oil and oil-related hydrocarbons are removed from contaminated sites. The degree and rate of biodegradation are different for each spill and are controlled by a greater number of variables than is physical weathering. These variables could include spill conditions and natural processes, such as type of the oil spilled, spill site, the ambient and seasonal environmental conditions (such as temperature, oxygen, nutrients, water activity, salinity, and pH), and composition and activities of the autochthonous microbial community. A number of laboratory biodegradation studies have been conducted under controlled laboratory conditions (CitationAtlas and Bartha, 1992; CitationBlenkinsopp et al., 1996; CitationFoght et al., 1998; CitationPrince, 1993; CitationSwannel et al., 1996; CitationWang et al., 1998c) to better understand the effects of biodegradation on petroleum hydrocarbons. In general, biodegradation affects the oil composition in the following patterns (CitationBlenkinsopp et al., 1996; CitationLeahy and Colwell, 1990; CitationWang et al., 1998c):
| • | Smaller hydrocarbons are degraded faster than larger hydrocarbons; | ||||
| • | Straight-chain n-alkanes degrades faster than branched alkanes; | ||||
| • | GC-resolved compounds are degraded more than GC-unresolved complex hydrocarbons; | ||||
| • | Low molecular weight aromatics are degraded faster than high molecular weight aromatics; | ||||
| • | Increase in alkylation level within alkylated homologous families significantly decreases susceptibility to microbial attack; and | ||||
| • | Certain isomers within isomeric PAH groups are preferentially degraded by microbes. | ||||
For biomarkers, lab biodegradation studies (CitationFoght et al., 1998; CitationBlenkinsopp et al., 1996; CitationWang et al., 1998c) clearly show that no sign of alteration in the composition of biomarkers was observed, regardless of the oil type (light, middle or heavy), incubation times (7, 14 and 28 days), or incubation conditions (incubated at 4, 10, 15, and 22°C), with and without the presence of nutrients. The concentrations of terpanes and steranes in the tested oils were consistent, and the DRs of paired terpanes and steranes remained constant. For example, the average of the sum of eight target diagnostic biomarker ratios (including C23/C24, Tm/Ts, C29/C30, C32(S)/C32(R), C33(S)/C33(R), C23/C30, C24/C30, and C27α β β/C29α β β steranes) from 70 biodegradation samples of the Alberta Sweet Mix Blend oil inoculated under various inoculums conditions during 1994 was 8.2 ± 0.2 with relative standard deviation less than 4%. As opposed to the biomarker compounds, n-alkanes, pristane, and phytane were greatly reduced in the positive controls, and n−C17/pristane, n−C18/phytane, and pristane/phytane ratios were significantly altered, indicating degradation of pristane and phytane had also occurred.
Compared with the laboratory-controlled biodegradation, biodegradation under field conditions is generally a long-term weathering process. Alterations in chemical composition of naturally weathered oil spill samples are caused by the combination of various complex weathering processes. shows the GC/FID and GC/MS chromatograms for TPH and n-alkane analysis (right panel) and biomarker terpane analysis (left panel) for 25-year-old Nipisi oil spill samples collected from the same location and site but with different sampling depths. The surface oil (0–2 cm) has been heavily weathered. Conversely, the subsurface residual oil (> 30–40 cm) is still almost unaffected by weathering, with GC chromatographic profiles similar to the reference oil. The microbial degradation of subsurface oil has been slow since the peat in this wetland habitat is acidic, and water saturated, i.e., largely anaerobic (CitationWang et al., 1998a). In contrast to alkane and PAH groups, the biomarker composition is nearly unaffected. The accumulation of terpanes relative to the reference oil during the 25-year period of weathering is apparent, especially for the severely weathered surface sample N2-1A: the concentration of C30−α β hopane was approximately 1.8 times that found in the reference oil, and five diagnostic biomarker ratios (C23/C24, Ts/Tm, C29/C30,C32 22S/22R, and C33 22S/22R) were found to be consistent between samples as well.
Figure 19 GC-FID (left panel) and GC-MS-SIM chromatograms for TPH and n-alkane analysis and biomarker terpane analysis of 25-year-old Nipisi oil spill samples collected from the same location and site but at varying sampling depths.
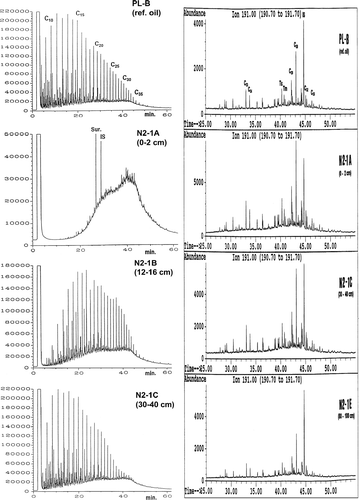
Biodegradation of Biomarkers
Although terpanes and steranes are highly resistant to biodegradation, several studies have shown that they can be degraded to certain degree under severe weathering conditions (i.e., extensive microbial degradation) (CitationChosson et al., 1991; CitationMunoz et al., 1997; CitationPrince et al., 2002; CitationSeifert et al., 1984). The Arrow (CitationWang et al., 1994b) and BIOS oil spill studies (CitationPrince et al., 2002; CitationWang et al., 1995a) have demonstrated degradation of C23 and C24 tricyclic terpanes. In addition, Tm is degraded faster relative to Ts, even though Ts chromatographically elutes earlier than Tm. In March 1986, sections of peaty mangrove in a tropical ecosystem were polluted by Arabian Light crude oil. Eight years later, CitationMunoz et al. (1997) found that isoprenoids were severely degraded and the biomarker distribution altered. Norhopanes were found to be the most biodegradation-resistant among the studied terpane and sterane groups and the C30−α β hopane appeared more sensitive to weathering than its higher homologues. Based on several geochemical studies, CitationPeters and Moldowan (1993) have created a “quasi-stepwise” sequence for assessing the extent to which biomarkers are degraded in the reservoir.
Three coastal sites, heavily oiled from the 1974 Metula oil spill in the Strait of Magellan, Chile, were examined in May 1998 to determine the long-term fate and persistence of Metula oil in a marine marsh environment (CitationWang et al., 2001b). Among the characterized samples, the asphalt pavement samples were the most heavily weathered, evidenced by a complete loss of n-alkanes from n−C8 to n−C41 and by depletion of more than 98% of the alkylated PAHs. Even the most refractory biomarker compounds were affected to varying degrees. Biomarkers showed degradation in the following sequences:
| • | Biomarkers were altered in the declining order of importance as: diasteranes > C27 steranes > tricyclic terpanes > pentacyclic terpanes > norhopanes (C29Ts) ∼ C29 α β β steranes. | ||||
| • | Steranes degraded in the order of C27 > C28 > C29 with the stereochemical degradation sequence 20R α α α steranes > 20(R+S) α β β steranes > 20S α α α steranes. | ||||
| • | Degradation of terpane C35 > C34 > C33 > C32 > C31 was apparent with a significantly preferential degradation of the 22R epimers over the 22S epimers. | ||||
| • | C30−α β -hopane appeared more degradable than the 22S epimers of C31 and C32 homohopanes, but had roughly the same biodegradation rate as the 22R epimers of C31 and C32 homohopanes and was significantly more resistant to degradation than the 22S and 22R epimers of C34 and C35 homohopanes. | ||||
| • | C29−18α(H), 21β (H)-30-norneohopane and C29−α β β 20R and 20S stigmastanes were found to be the most degradation-resistant terpane and sterane, respectively, among the studied target biomarkers. | ||||
Determination of Weathered Percentages Using Biomarkers
Highly degradation-resistant oil components such as C30α β hopane or C229 α β norhopane have been applied as conserved “internal standards” for more precise estimation of the weathering degree and extent of the spilled residual oil (CitationButler et al., 1991; CitationDouglas et al., 1994; CitationPrince et al., 1994; CitationWang et al., 1995a):
in which P is the weathered percentages of the weathered samples, and C S and C W are the concentrations of C30α β -hopane in the source oil and weathered samples, respectively. It should be noted, however, that the weathered percentages can be still underestimated by using C30−α β-hopane as an internal oil reference for extremely degraded oil samples because C30−α β-hopane under such circumstances is itself partially depleted, such as in the case of the Metula oil spill (CitationWang et al., 2001b). However, in most cases, C30−α β-hopane is the preferred choice for estimating weathered percentages because C30−α β-hopane is often the most abundant among C19 to C35 biomarkers and can thus be quantified more accurately. For lighter refined products, such as diesel samples, which generally do not contain high molecular weight terpane and sterane compounds, the bicyclic sesquiterpanes as well as a selection of the more conservative PAHs with a high degree of alkylation such as C3- or C4-phenanthrenes can be used as an alternative internal standard for estimating the degree of weathering. CitationWang et al. (2005) have quantitatively studied the effects of weathering on sesquiterpane distributions and developed a number of diagnostic sesquiterpane indices for source identification of spilled diesels and for estimation of weathering percentages of the spilled diesel samples.
Application of Multivariate Statistical Methods for Biomarker Fingerprinting
Data analysis is an important part of chemical fingerprinting and a broad collection of statistical techniques has been used for evaluation of data in real oil spill cases. Data evaluation techniques within environmental forensics and specifically for spill/source identification, oil correlation, and differentiation have traditionally centered on univariate methods and comparison of DRs and complex profiles for subjective pattern matching such as those applied in the tiered approaches (CitationUhler et al., 1998–1999; CitationWang et al., 1999a) and the modified Nordtest method (CitationFaksness et al., 2002a). However, in spill cases with a large number of candidate sources (such as spills in the harbor area), subjective pattern matching and univariate analysis becomes increasingly difficult to use for defensibly linking spilled oil with its generic source. In particular, when the spilled oil(s) and the suspected spill source candidates are closely related, the use of multivariate statistical methods would be beneficial.
Multivariate methods have been used for data analysis in organic geochemistry since the 1980s (CitationØygard et al., 1984; CitationTelnaes and Dahl, 1986) and have recently been adopted for oil spill identification within environmental forensic science (CitationAboul-Kassim and Simoneit, 1995a, Citation1995b; CitationBurns et al., 1997; CitationChristensen et al., 2004, Citation2005; CitationDe Luca et al., 2004; CitationHostettler et al., 2004; CitationLavine et al., 1995; CitationMudge, 2002; CitationStella et al., 2002; CitationStout et al., 2001) These powerful multivariate statistical tools include principal components analysis (PCA), discriminant analysis, and cluster analysis. Among them, PCA is the most widely used and powerful multivariate analysis technique. It is used to transform original sample composition data into new, smaller, and uncorrelated variables called principal components. For data sets with a large number of interrelated variables, PCA is a powerful tool for analyzing the structure of the data and reducing the dimensionality of the pattern vectors.
CitationLavine et al. (1995) employed pattern recognition and PCA to study spilled jet fuels that had undergone weathering in subsurface environment and then classified these fuels into types: JP-4, Jet-4, JP-5, JP-8, and JPTS. Aboul-Kassim and Simoneit (Citation1995a, Citation1995b) have used a variety of statistical techniques for source oil identification. In their analysis of the aliphatic and aromatic compositions in particulate fallout samples (PFSs) in Alexandria, multivariate statistical analyses, including extended Q-mode factor analysis and linear programming, were performed to reduce the hydrocarbon data set into a meaningful number of end members (sources). Their analyses indicated that there were two significant end members explaining 90% of the total variation among samples and confirming petrochemical (79.6%) and thermogenic/pyrolytic (10.4%) sources in the PFS model. In a study of sediment samples in the eastern harbor of Alexandria, a similar multivariate statistical approach was used to determine the end member compositions and evaluate sediment partitioning and transport in the eastern harbor area. They found that untreated sewage was the main source of petroleum hydrocarbons in the eastern harbor area rather than direct inputs from boating activities or urban run-off. CitationBurns et al. (1997) used PCA and a least-squares iterative matching procedure to allocate PAHs in intertidal and subtidal sediment samples from the Prince William Sound of Alaska to 30 potential sources. They used PCA to identify 18 possible sources, including diesel oil, diesel soot, spilled crude oil in various weathering states, natural background, creosote, and combustion products from human activities and forest fires. Subsequently, the least-squares model was used to estimate the source mix, with the best least-squares fit of 36 PAH analytes including the parent and alkylated homologues of naphthalene, phenanthrene, fluorene, dibenzothiophene, and chrysene. Isomers were grouped by number of carbons in side groups and PAH family and treated as individual analytes. CitationStout et al. (2001) analyzed a suite of diagnostic PAH and biomarker ratios with PCA. The ratios were selected on the basis of high analytical precision and low usceptibility to weathering. The analysis helped to identify the prime suspects for a heavy fuel oil spill of unknown origin from 66 candidate sources. In a recent attempt to resolve the origin of background hydrocarbons in the sediments of Prince William Sound and the Gulf of Alaska, CitationMudge (2002) used partial least-squares regression to reassess the percentage distribution of five possible sources (coal, seep oil, shales, and input from two rivers) to the hydrocarbon loading in the Gulf of Alaska. The data analysis results suggest mixed sources whose contributions varied significantly across the sampling area. CitationChristensen et al. (2004) presented an integrated methodology for forensic oil spill identification based on GC/MS analysis, chromatographic data processing, variable-outlier detection, multivariate data analysis, estimation of uncertainties, and statistical evaluation. The combination of PCA and statistical evaluation of sample similarities enabled the simultaneous analysis of a large number of diagnostic ratios of PAHs and biomarkers. Weathering was taken into account by considering the sampling uncertainties estimated from replicate spill samples. Statistical evaluation ensured an objective matching of oil spill samples with suspected source oils as well as classification into positive match, probable match, and non-match. The methodology correctly identified the source of two spill samples (i.e., crude oils from Oseberg East and Oseberg Field Center) and distinguished them from closely related source oils. Tarballs are common along the southern California coastline. CitationHostettler et al. (2004) fingerprinted a total of 128 tarballs and tar residues collected from coastal locations using biomarkers and stable carbon isotope parameters. Then a chemometric multivariate statistical approach (hierarchical cluster analyses [HCA] and PCA) was applied to the data to sort out the differences in the biomarker ratios, to group samples according to genetic similarities, to test for correlation between and within the sample groups, and to attempt to relate the tar residues to possible local sources. The data showed that the tarballs are of natural and not anthropogenic origin and that all had originated from source rocks within the Miocene Monterey Formation via shallow seeps offshore.
Recently, CitationChristensen et al. (2005) presented a methodology for objective analysis of sections of GC/MS chromatograms of biomarker steranes at m/z 217. The method consisted of GC/MS analysis, preprocessing of chromatograms (including derivatisation, normalization, and chromatographic alignment), and PCA of selected chromatographic regions. The resolution power of the PCA model was enhanced by deselecting the most uncertain variables or scaling them according to their uncertainty, using a weighted least-square (WLS) criterion. Furthermore, the four principal components, found to be the optimal number of components, was interpreted as: boiling point range (PC1), clay content (PC2), carbon number distribution of sterols in the source rock (PC3), and thermal maturity of the oil (PC4) from a priori knowledge on biomarkers. The method was applied to chromatograms of m/z 217 of oil spill samples and source oils. Oil spill samples were collected from the coastal environment in the weeks after the Baltic Carrier oil spill and were clusted in principal components 1 to 4 with the potential source oil samples. In this case study, 101 digitized chromatograms at m/z 217 were used for forensic oil spill identification. The data is composed of 51 source oils, 16 weathered Baltic Carrier oil spill samples, 18 replicate references, six spill samples and 10 replicate analyses of selected source oils (101 oil samples in total). The chromatograms comprised 2510 data points, which, after preprocessing, were reduced to 1231 by omitting the parts without chemical information. Finally, the spill samples were matched to the source oils.
Numerous commercial software packages for unsupervised multivariate statistical analysis are available on the market, which enables the forensic chemist to apply a range of multivariate statistical methods on a complex data set. However, it must be realized that these methods can be used by the chemist as a “black-box” without prior knowledge of data preprocessing, interpretation of results, and how the latter depends on initial preprocessing and variable selection. This may lead to far from optimal models with low-resolution powers and more severely to misinterpretation of the outputs (e.g., loading and score plots). Hence, multivariate methods have to be used and interpreted with care, but if some general considerations are made during the modeling, these methods can considerably improve the analysis of complex fingerprinting data of petroleum biomarkers.
Conclusions
Forensic biomarker fingerprinting and data interpretation have made great advances in the past two decades. This article provided a brief overview and discussion of biomarker chemistry, biomarker characterization and quantification, biomarker distributions, weathering effects on biomarker composition, bicyclic biomarker sesquiterpanes and diamondoids, DRs and cross-plots of biomarkers, unique biomarkers, application of biomarker fingerprinting techniques for spill source identification, and application of multivariate statistical analysis for biomarker fingerprinting. It should be noted, however, that in any oil spill investigation cases, particularly for complex hydrocarbon mixtures or extensively weathered and degraded oil residues, there is no single fingerprinting technique that can fully and readily meet the objectives of forensic investigation and quantitatively allocate hydrocarbons to their respective sources. Combined and integrated multiple tools are often necessary under such situations.
Advancements in spilled oil fingerprinting techniques including use of emerging instrumental techniques and further development of multivariate statistical tools for data evaluation will continue. It can be anticipated that these developments will further enhance the utility and defensibility of oil spill characterization and source identification.
Notes
*The diagnostic ratios in Table 6 consist of alkanes, terpanes, steranes, sesquiterpanes, and diamondoids. Ratios are defined from Eq. (1) for simplicity, but can be readily redefined using Eqs. (2) and (3). For example, in accordance with Eq. (2), the ratio of C29α β -30-norhopane/C30α β hopane (H29/H30) can be readily redefined as H29/(H29 + H30).
References
- Aboul-Kassim , T. A. T. and Simoneit , B. R. T. 1995a . Aliphatic and aromatic hydrocarbons in particulate fallout of Alexandria, Egypt: Sources and implications . Environmental Science and Technology , 29 : 2473 – 2483 . [CSA]
- Aboul-Kassim , T. A. T. and Simoneit , B. R. T. 1995b . Petroleum hydrocarbon fingerprinting and sediment transport assessed by molecular biomarker and multivariate statistical analyses in the Eastern Harbour of Alexandria, Egypt . Marine Pollution Bulletin , 30 : 63 – 73 . [CROSSREF] [CSA]
- Alberdi , A. and Lopez , L. 2000 . Biomarker 18α(H)-oleanane, a geochemical tool to assess Venezuelan petroleum systems . Journal of South American Earth Sciences , 13 : 751 – 759 . [CROSSREF] [CSA]
- Alexander , R. , Kagi , R. , Noble , R. A. and Volkman , J. K. 1984 . “ Identification of some bicyclic alkanes in petroleum ” . In Advances in organic geochemistry 1983 , Edited by: Schenck , P. A. , De Leeuw , J. W. and Lijmbach , G. W. M. Oxford Pergamon Press .
- American Society for Testing and Materials (ASTM) . 1997a . “ ASTM Method 3328–90 ” . In Annual Book of ASTM Standards, Water (II) , Vol. 11.02 , Philadelphia : Author .
- American Society for Testing and Materials (ASTM) . 1997b . “ ASTM Method 5739–95 ” . In Annual Book of ASTM Standards, Water (II) , Vol. 11.02 , Philadelphia : ASTM, Author. .
- Atlas , R. M. and Bartha , R. 1992 . “ Hydrocarbon biodegradation and oil spill bioremediation ” . In Advances in Microbial Ecology , Edited by: Marshall , K. C. Vol. 12 , 287 – 338 . New York : Plenum Press .
- Audino , M. , Grice , K. , Alexander , R. and Kagi , R. 2001 . Macrocyclic-alkanes: A new class of biomarker . Organic Geochemistry , 32 : 759 – 763 . [CROSSREF] [CSA]
- Audino , M. , Grice , K. , Alexander , R. and Kagi , R. 2002 . Macrocyclic-alkanes in crude oils from algaenan of Botryococcus braunii . Organic Geochemistry , 33 : 978 – 984 . [CROSSREF] [CSA]
- Barakat , A. O , Mostafa , A. , El-Gayar , M. S. and Rullkotter , J. 1997 . Source-dependent biomarker properties of five crude oils from the Gulf of Suez, Egypt . Organic Geochemistry. , 26 : 441 – 450 . [CROSSREF] [CSA]
- Barakat , A. O. , Mostafa , A. R. , Rullkotter , J. and Hegazi , A. R. 1999 . Application of a multimolecular marker approach to fingerprint petroleum pollution in the marine environment . Marine Pollution Bulletin , 38 : 535 – 544 . [CROSSREF] [CSA]
- Barakat , A. O. , Qian , Y. , Kim , M. and Kennicutt , M. C. II . 2002 . Compositional changes of aromatic steroid hydrocarbons in naturally weathered oil residues in Egyptian Western Desert . Environmental Forensics , 3 : 219 – 226 . [CSA]
- Barbanti , S. M. 2004 . Personal communication
- Bence , A. E. , Kvenvolden , K. A. and Kennicutt , M. C. II . 1996 . Organic geochemistry applied to environmental assessments of Prince William Sound, Alaska, after the Exxon Valdez oil spill—A review . Organic Geochemistry , 24 : 7 – 42 . [CROSSREF] [CSA]
- Berkowitz , N. 1997 . Fossil Hydrocarbons: Chemistry and Technology , San Diego : Academic Press .
- Bieger , T. , Helou , J. and Abrajano , T. A. Jr . 1996 . Petroleum biomarkers as tracers of lubricating oil contamination . Marine Pollution Bulletin , 32 : 270 – 274 . [CROSSREF] [CSA]
- Blenkinsopp , S. , Wang , Z. D. , Foght , J. , Westlake , D. W. S. , Sergy , G. , Fingas , M. , Sigouin , L. and Semple , K. 1996 . Assessment of the freshwater biodegradation potential of oils commonly transported in Alaska Final Report to Alaska Government, ASPS 95-0065. Environment Canada, Ottawa
- Boehm , P. D. , Burns , W. A. , Page , D. S. , Bence , A. E. , Mankiewicz , P. J. , Brown , J. S. and Douglas , G. S. 2002 . Total organic carbon, an important tool in holistic approach to hydrocarbon source fingerprinting . Environmental Forensics , 3 : 243 – 250 . [CSA]
- Boehm , P. D. , Douglas , G. S. , Burns , W. A. , Mankiewicz , P. J. , Page , D. S. and Bence , A. E. 1997 . Application of petroleum hydrocarbon chemical fingerprinting and allocation techniques after the Exxon Valdez oil spill . Marine Pollution Bulletin , 34 : 599 – 613 . [CROSSREF] [CSA]
- Boehm , P. D. , Page , D. S. , Burns , W. A. , Bence , A. E. , Mankiewicz , P. J. and Brown , J. S. 2001 . Resolving the origin of the petrogenic hydrocarbon background in Prince William Sound, Alaska . Environmental Science and Technology , 35 : 471 – 479 . [INFOTRIEVE] [CROSSREF] [CSA]
- Burns , W. A. , Mankiewicz , P. J. , Bence , A. E. , Page , D. S. and Parker , K. R. 1997 . A principal-component and least-squares method for allocating polycyclic aromatic hydrocarbons in sediment to multiple sources . Environmental Toxicology and Chemistry , 16 : 1119 – 1131 . [CROSSREF] [CSA]
- Butler , E. L. , Douglas , G. S. , Steinhauter , W. S. , Prince , R. C. , Axcel , T. , Tsu , C. S. , Bronson , M. T. , Clark , J. R. and Lindstrom , J. E. 1991 . “ Hopane, a new chemical tool for measuring oil biodegradation ” . In On-site Reclamation , Edited by: Hinchee , R. E. and Olfenbuttel , R. F. 515 – 521 . Boston : Butterworth-Heinemann .
- CAS . 2002 . Chemical abstract index guide: Appendix IV Ohio Chemical Abstract Service Columbus, OH 175I–327I
- Chen , J. , Fu , J. , Sheng , G. , Liu , D. and Zhang , J. 1996 . Diamondoid hydrocarbon ratios: novel maturity indices for highly mature crude oils . Organic Geochemistry , 25 : 179 – 190 . [CROSSREF] [CSA]
- Cheng , K. , Jin , W. , He , Z. and Chen , J. 1991 . Application of sesquiterpanes to the study of oil-gas source: the gas-rock correlation in the Qiongdongnan Basin . Journal of Southeast Asian Earth Science , 5 : 189 – 195 . [CROSSREF] [CSA]
- Chosson , P. , Lanau , C. , Connan , J. and Dessort , D. 1991 . Biodegradation of refractory hydrocarbon biomarkers from petroleum under laboratory conditions . Nature , 351 : 640 – 642 . [INFOTRIEVE] [CROSSREF] [CSA]
- Christensen , J. H. , Hansen , A. B. , Mortensen , J. , Tomasi , G. and Andersen , O. 2004 . Integrated methodology for forensic oil spill identification . Environmental Science and Technology , 38 : 2912 – 2918 . [INFOTRIEVE] [CROSSREF] [CSA]
- Christensen , J. H. , Tomasi , G. and Hansen , A. B. 2005 . Chemical fingerprinting using time warping and PCA . Environmental Science and Technology , 39 : 255 – 260 . [INFOTRIEVE] [CROSSREF] [CSA]
- Connolly , J. D. and Hill , R. A. 1991 . Dictionary of Terpenoids , London : Chapman and Hall. .
- Currie , T. J. , Alexander , R. and Kagi , R. I. 1992 . Coastal bitumens from Western Australia-long distance transport by ocean currents . Organic Geochemistry , 18 : 595 – 601 . [CROSSREF] [CSA]
- Dahl , J. E. , Moldowan , J. M. , Peters , K. E. , Claypool , G. E. , Rooney , M. A. , Michael , G. E. , Mello , M. R. and Kohnen , M. L. 1999 . Diamondoid hydrocarbons as indicators of natural oil cracking . Nature , 399 : 54 – 57 . [CROSSREF] [CSA]
- Dahlmann , G. 2003 . Characteristic features of different oil types in oil spill identification . Berichte des BSH , 31 : 1 – 48 . [CSA]
- Daling , P. S. , Faksness , L. G. , Hansen , A. B. and Stout , S. A. 2002 . Improved and standardized methodology for oil spill fingerprinting . Environmental Forensics. , 3 : 263 – 278 . [CSA]
- De Luca , G. , Furesi , A. , Leardi , R. , Micera , G. , Panzanelli , A. , Piu , P. C. and Sanna , G. 2004 . Polycyclic aromatic hydrocarbons assessment in the sediments of the Porto Torres Harbor (Northern Sardinia, Italy) . Marine Chemistry , 86 : 15 – 32 . [CROSSREF] [CSA]
- DOE. (United States Department of Energy) . 2004 . Energy Information Administration website http://eia.doe.gov/Available at
- Douglas , G. S. , Bence , A. E. , Prince , R. C. , McMillen , S. J. and Butler , E. L. 1996 . Environmental stability of selected petroleum hydrocarbon source and weathering ratios . Environmental Science and Technology , 30 : 2332 – 2339 . [CROSSREF] [CSA]
- Douglas , G. S. , Burns , W. A. , Bence , A. E. , Page , D. S. and Boehm , P. 2004 . Optimizing detection limits for the analysis of petroleum hydrocarbons in complex environmental samples . Environmental Science and Technology , 38 : 3958 – 3964 . [INFOTRIEVE] [CROSSREF] [CSA]
- Douglas , G. S. , Prince , R. C. , Butler , E. L. and Steinhauer , W. G. 1994 . “ The use of internal chemical indicator in petroleum and refined products to evaluate the extent of biodegradation ” . In Hydrocarbon bioremediation , Edited by: Hinchee , R. E. , Hoeppel , B. C. and Miller , R. N. 219 – 236 . Boca Raton , FL : Lewis Publishers .
- El-Gayar , M. S. , Mostafa , A. R. , Abdelfattah , A. E. and Barakat , A. O. 2002 . Application of geochemical parameters for classification of crude oils from Egypt into source-related types . Fuel Processing Technology , 79 : 13 – 28 . [CROSSREF] [CSA]
- EPA (Environmental Protection Agency) . 1983 . EPA Methods for Chemical Analysis of Water and Wastes , Cincinnati , OH : U. S. EPA Environmental Monitoring and Support Laboratory . EPA-600-4-79-020
- EPA (Environmental Protection Agency) . 1986 . EPA Methods for Chemical Analysis of Water and Wastes , Washington DC , , U. S. : Environmental Protection Agency .
- EPA (Environmental Protection Agency) . 1996 . EPA Methods 3510C: Separatory Funnel Liquid-Liquid Extraction , Washington , DC : U. S. Environmental Protection Agency .
- EPA (Environmental Protection Agency) . 1997 . EPA Test Methods for Evaluating Solid Waste (SW-846), Update III , Washington , DC : U. S. Environmental Protection Agency, Office of Solid Waste and Emergency Response .
- EPA (Environmental Protection Agency) . 1998a . EPA Guidance for Quality Assurance Project Plans , Washington , DC : U. S. Environmental Protection Agency . EPA QA/G-5
- EPA (Environmental Protection Agency) . 1998b . Guidance for data quality assessmen, practical method for data analysis , Washington , DC : U. S. Environmental Protection Agency . EPA AQ/G-9 QA 97 Updated
- EPA (Environmental Protection Agency) . 2001 . EPA Requirements for Quality Assurance Project Plans , Washington , DC : U. S. Environmental Protection Agency . EPA QA/R-5
- EPA (Environmental Protection Agency) . 2003 . Characteristics of Spilled Oils, Fuels, and Petroleum Products: 1. Composition and Properties of Selected Oils, EPA/600/R-03/072 , Athens , Georgia : National Exposure Research Laboratory (NERL), EPA . Also available at: http://www.epa.gov/epahome/recentadditions.htm
- ETC (Environmental Technology Centre) . 2005 . Quality Manual , Ottawa , , Canada : Environmental Technology Centre, Environment Canada .
- Faksness , L. G. , Weiss , H. and Daling , P. S. 2002a . Revision of the NORDTEST Methodology for Oil Spill Identification – Technical Report , SINTEF Report STF66 A01028 Trondheim , , Norway
- Faksness , L. G. , Daling , P. S. and Hansen , A. B. 2002b . Round Robin Study—Oil Spill Identification . Environmental Forensics , 3 : 279 – 292 . [CSA]
- Fan , P. , Qian , Y. and Zhang , B. 1991 . Characteristics of biomarkers in the recent sediments from Qinghai Lake, Northwest China . Journal of Southeast Asian Earth and Science , 5 : 113 – 128 . [CROSSREF] [CSA]
- Fingas , M. 1995 . A literature review of the physics and predictive modelling of oil spill evaporation . Journal of Hazardous Materials , 42 : 157 – 175 . [CROSSREF] [CSA]
- Fingas , M. 2001 . The Basics of Oil Spill Cleanup , 2nd ed. , New York : Lewis Publishers .
- Foght , J. , Semple , K. , Gauthier , C. , Westlake , D. W. S. , Blenkinsopp , S. , Sergy , G. , Wang , Z. D. and Fingas , M. 1998 . Development of a standard bacterial consortium for laboratory efficacy testing of commercial freshwater oil spill bioremediation agents . Environmental Technology , 20 : 839 – 849 . [CSA]
- Fu , J. , Pei , C. , Sheng , G. and Liu , D. 1992 . A geochemical investigation of crude oils from eastern Pearl River Mouth Basin, South China . Journal of Southeast Asian Earth Science , 7 : 271 – 272 . [CSA]
- Gallegos , E. J. 1971 . Identification of new steranes, terpanes, and branched paraffins in Great River Shall by combined capillary GC and MS . Analytical Chemistry , 43 : 1151 – 1160 . [CROSSREF] [CSA]
- Gerald , K. V. , Short , J. W. and Kennicutt , M. C. II . 2002 . Low-maturity Kulthieth formation coal: A possible source of PAHs in benthic sediments of the Northern Gulf of Alaska . Environmental Forensics , 3 : 227 – 242 . [CSA]
- Grahl-Nielsen , O. and Lygre , T. 1990 . Identification of samples of oil related to two spills . Marine Pollution Bulletin , 21 : 176 – 183 . [CROSSREF] [CSA]
- Grice , K. , Alexander , R. and Kagi , I. R. I. 2000 . Diamondiod hydrocarbon ratios as indicators of biodegradation in Australian crude oils . Organic Geochemistry , 31 : 67 – 73 . [CROSSREF] [CSA]
- Gürgey , K. 2002 . An attempt to recognize oil populations and potential source rock types in Paleozoic sub- and Mesozoic-Cenozoic supra-salt strata in southern margin of the Pre-Caspian basin, Kazakhstan republic . Organic Geochemistry , 33 : 723 – 741 . [CROSSREF] [CSA]
- Hostettler , F. D. , Pereira , W. E. , Kvenvolden , K. A. , Green , A. , Luoma , S. N. , Fuller , C. C. and Anima , R. 1999a . A record of hydrocarbon input to San Francisco Bay as traced by biomarker profiles in surface sediment and sediment cores . Marine Chemistry , 64 : 115 – 127 . [CROSSREF] [CSA]
- Hostettler , F. D. , Rosenbauer , R. J. and Kvenvolden , K. A. 1999b . PAH refractory index as a source discriminant of hydrocarbon input from crude oil and coal in Prince William Sound, Alaska . Organic Geochemistry , 30 : 873 – 879 . [CROSSREF] [CSA]
- Hostettler , F. D. , Rosenbauer , R. J. , Lorenson , T. D. and Dougherty , J. 2004 . Geochemical characterization of tarballs on beaches along the California coast (Part I) . Organic Geochemistry , 35 : 725 – 746 . [CROSSREF] [CSA]
- Hu , G. 1991 . Geochemical characterization of steranes and terpanes in certain oils from terrestrial facie within South China Sea . Journal of Southeast Asian Earth Science , 5 : 241 – 247 . [CROSSREF] [CSA]
- Hwang , R. J. , Heidrick , T. , Mertani Qivayanti , B. and Li , M. 2002 . Correlation and migration studies of North Central Sumatra oils . Organic Geochemistry , 33 : 1361 – 13792 . [CROSSREF] [CSA]
- Jiang , C. and Li , M. 2002 . Bakken/Madison petroleum systems in the Canadian Williston Basin, Part 3: Geological evidence for significant Bakken-derived oils in Madison Group reservoirs . Organic Geochemistry , 33 : 761 – 787 . [CROSSREF] [CSA]
- Jiang , C. , Li , M. , Osadetz , K. G. , Snowdon , L. R. , Obermajer , M. and Fowler , M. G. 2001 . Bakken/Madison petroleum systems in the Canadian Williston Basin. Part 2: Molecular markers diagnostic of Bakken and Lodgepole source rocks . Organic Geochemistry , 32 : 1037 – 1054 . [CROSSREF] [CSA]
- Jordan , R. E. and Payne , J. R. 1980 . Fate and Weathering of Petroleum Spills in the Marine Environment: A Literature Review and Synopsis , Ann Arbor , MI : Ann Arbor Science Publishers .
- Kaplan , I. R. , Galperin , Y. , Alimi , H. , Lee , R. P. and Lu , S. 1996 . Pattern of chemical changes during environmental alteration of hydrocarbon fuels . Ground Water Monitoring and Remediation Fall , : 113 – 124 . [CSA]
- Kaplan , I. R. , Galperin , Y. , Lu , S. and Lee , R. P. 1997 . Forensic environmental geochemistry differentiation of fuel-types, their sources, and release time . Organic Geochemistry , 27 : 289 – 317 . [CROSSREF] [CSA]
- Kaplan , I. R. , Lu , S. , Alimi , H. M. and MacMurphey , J. 2001 . Fingerprinting of high boiling hydrocarbon fuels, asphalts and lubricants . Environmental Forensics , 2 : 231 – 248 . [CSA]
- Killops , S. D. and Howell , V. J. 1991 . Complex series of pentacyclic triterpanes in a lacustrine sourced oil from Korea Bay Basin . Chemical Geology , 91 : 65 – 79 . [CROSSREF] [CSA]
- Kvenvolden , K. A. , Hostettler , F. D. , Carlson , P. R. , Rapp , J. B. , Threlkeld , C. N. and Warden , A. 1995 . Ubiquitous tar balls with a Carlifonia-source signature on the shorelines of Prince William Sound, Alaska . Environmental Science and Technology , 29 : 2684 – 2694 . [CSA]
- Kvenvolden , K. A. , Hostettler , F. D. , Rapp , J. B. and Carlson , P. R. 1993 . Hydrocarbon in oil residues on beaches of islands of Prince William Sound, Alaska . Marine Pollution Bulletin , 26 : 24 – 29 . [CROSSREF] [CSA]
- Kvenvolden , K. A. , Hostettler , F. D. , Rosenbauer , R. W. , Lorenson , T. D. , Castle , W. T. and Sugarman , S. 2002 . Hydrocarbons in recent sediment of the Monterey Bay, National Marine Sanctuary . Marine Geology. , 181 : 101 – 113 . [CSA]
- Kvenvolden , K. A. , Rapp , J. B. and Bourell , J. H. 1985 . Alaska North Slope Oil/Rock Correlation Study , Edited by: Magoon , L. B. and Claypool , G. E. 593 – 617 . Tulsa , OK : American Association of Petroleum Geologists Studies in Geology . No. 20
- Lavine , B. K. , Mayfield , H. , Kromann , P. R. and Faruque , A. 1995 . Source identification of nderground fuel spills by pattern recognition analysis of high-speed gas chromatograms . Analytical Chemistry , 67 : 3846 – 3852 . [CSA]
- Leahy , J. G. and Colwell , R. R. 1990 . Microbial degradation of hydrocarbons in the environment . Microbial Rev. , 54 : 305 – 315 . [CSA]
- Li , M. and Jiang , C. 2001 . Bakken/Madison petroleum systems in the Canadian Williston Basin, Part 1: C21−C26 20-n-alkyl-pregnanes and their triaromatic analogs as indicators for Upper Devonian-Mississippian epicontinental black shale derived oils . Organic Geochemistry , 32 : 667 – 675 . [CROSSREF] [CSA]
- Marshall , A. G. and Podgers , R. 2004 . Petroleomics: The next grand challenge for chemical analysis . Accounts of Chemical Research , 37 : 53 – 59 . [INFOTRIEVE] [CROSSREF] [CSA]
- Mckirdy , D. M. , Cox , R. E. , Volkman , J. K. and Howell , V. J. 1986 . Botryococcane in a new class of Australian non-marine crude oils . Nature , 320 : 57 – 59 . [CROSSREF] [CSA]
- Mckirdy , D. M. , Summons , R. E. , Padley , D. , Serafini , K. M. , Boreham , C. J. and Struckmeyer , H. I. M. 1994 . Molecular fossils in coastal bitumens from southern Australia: Signature of precursor biota and source rock environments . Organic Geochemistry , 21 : 265 – 286 . [CROSSREF] [CSA]
- Mello , M. R. , Koutsoukos , E. A. M. , Hart , M. B. , Brassell , S. C. and Maxwell , J. R. 1990 . Late cretaceous anoxic events in the Brazilian continental margin . Organic Geochemistry , 14 : 529 – 542 . [CROSSREF] [CSA]
- Moldowan , J. M. and Fago , F. J. 1986 . Structure and significance of a novel rearranged monoaromatic steroid hydrocarbon in petroleum . Geochimica et Cosmochimica Acta , 50 : 343 – 351 . [CROSSREF] [CSA]
- Moldowan , J. M. , Fago , F. J. , Carlson , R. M. K. , Young , D. C. , Duyne , G. V. , Clardy , J. , Schoell , M. , Phillinger , C. T. and Watt , D. S. 1991 . Rearranged hopanes in sediments and petroleum . Geochimica et Cosmochimica Acta , 55 : 3333 – 3353 . [CROSSREF] [CSA]
- Mudge , S. M. 2002 . Reassessment of the hydrocarbons in Prince William Sound and the Gulf of Alaska: Identifying the source using partial least-squares . Environmental Science and Technology , 36 : 2354 – 2360 . [INFOTRIEVE] [CROSSREF] [CSA]
- Munoz , D. , Guiliano , M. , Doumenq , P. , Jacquot , F. , Scherrer , P. and Mille , G. 1997 . Long term evolution of petroleum biomarkers in mangrove soil . Marine Pollution Bulletin , 34 : 868 – 874 . [CROSSREF] [CSA]
- Murrisepp , A. M. , Urof , K. , Liiv , M. and Sumberg , A. 1994 . A comparative study of non-aromatic hydrocarbons from kukersite and dictyonema shale semicoking oils . Oil Shale , 11 : 211 – 216 . [CSA]
- NRC (National Research Council) . 2002 . Oil in the Sea III: Inputs, Fates, and Effects , Washington , DC : The National Academies Press .
- Nytoft , H. P. and Bojesen-Koefeod , J. A. 2001 . 17α(H),21α(H)-hopane: Natural and synthetic . Organic Geochemistry , 32 : 841 – 856 . [CROSSREF] [CSA]
- Olah , G. A. and Molnar , Á . 1995 . Hydrocarbon Chemistry , New York : Wiley-Interscience .
- Oung , J. N. and Philp , R. P. 1994 . Geochemical characteristics of oils from Taiwan . Journal of Southeast Asian Earth Science , 9 : 193 – 206 . [CROSSREF] [CSA]
- Ourisson , G. and Albrecht , P. 1992 . Hopanoids, 1. Geohopanoids: the most abundant natural products on Earth? . Accounts of Chemical Research , 25 : 398 – 402 . [CROSSREF] [CSA]
- Øygard , K. , Grahl-Nielsen , O. and Ulvøen , S. 1984 . Oil/oil correlation by aid of chemometrics . Organic Geochemistry , 6 : 561 – 567 . [CROSSREF] [CSA]
- Page , D. S. , Bence , A. E. , Burns , W. A. , Boehm , P. D. and Douglas , G. S. 2002 . A holistic approach to hydrocarbon source allocation in the subtidal sediments of Prince William Sound, Alaska, embayments . Environmental Forensics , 3 : 331 – 340 . [CSA]
- Page , D. S. , Boehm , P. D. , Douglas , G. S. and Bence , A. E. 1995 . “ Identification of hydrocarbon sources in the Benthic sediments of Prince William Sound and the Gulf of Alaska following the Exxon Valdez spill ” . In Exxon Valdez Oil Spill: Fate and Effects in Alaska Waters , Edited by: Wells , P. G. , Butler , J. N. and Hughes , J. S. 41 – 83 . Philadelphia : ASTM .
- Page , D. S. , Boehm , P. D. , Douglas , G. S. , Bence , A. E. , Burns , W. A. and Mankiewicz , P. J. 1996 . The natural petroleum hydrocarbon background in subtidal sediments of Prince William Sound, Alaska, USA . Environmental Toxicology and Chemistry , 15 : 1266 – 1281 . [CROSSREF] [CSA]
- Page , D. S. , Foster , J. D. , Fickett , P. M. and Gilfillan , E. S. 1988 . Identification of petroleum sources in an area impacted by the Amoco Cadiz oil spill . Marine Pollution Bulletin , 3 : 107 – 115 . [CROSSREF] [CSA]
- Peters , K. E. and Moldowan , J. W. 1993 . The Biomarker Guide: Interpreting Molecular Fossils in Petroleum and Ancient Sediments , Englewood Cliffs , New Jersey : Prentice Hall .
- Peters , K. E. , Walters , C. C. and Moldowan , J. W. 2005 . The Biomarker Guide () , 2nd ed , Cambridge , UK : Cambridge University Press .
- Petrov , A. A. 1987 . Petroleum hydrocarbons , New York, Berlin , , Germany : Springer-Verlag .
- Philp , R. P. 1985 . Fossil Fuel Biomarkers, Application and Spectra , New York : Elsevier .
- Philp , R. P. , Gilbert , T. D. and Riedrich , J. 1981 . Bicyclic sesquiterpanoids and triterpenoids in Australia crude oils . Geochemica Cosmochimet Actaica , 45 : 1173 – 1180 . [CROSSREF] [CSA]
- Prince , R. C. 1993 . Petroleum spill bioremediation in marine environment . Critical Reviews in Microbiology , 36 : 724 – 728 . [CSA]
- Prince , R. C. , Elmendorf , D. L. , Lute , J. R. , Hsu , C. S. , Haith , C. E. , Senius , J. D. , Dechert , G. J. , Douglas , G. S. and Butler , E. L. 1994 . 17α(H), 21β(H)-Hopane as a conserved internal marker for estimating the biodegradation of crude oil . Environmental Science and Technology , 28 : 142 – 145 . [CROSSREF] [CSA]
- Prince , R. C. , Owens , E. H. and Sergy , G. A. 2002 . Weathering of an Arctic oil spill over 20 years: The BIOS experiment revisited . Marine Pollution Bulletin , 44 : 1236 – 1242 . [INFOTRIEVE] [CROSSREF] [CSA]
- Riolo , J. and Albrecht , P. 1985 . Novel arrangement ring C monoaromatic steroid hydrocarbons in sediments and petroleums . Tetrahedron Letters , 26 : 2701 – 2704 . [CROSSREF] [CSA]
- Riva , A. , Caccialanza , P. and Quagliaroli , F. 1988 . Recognition of 18α(H)-oleanane in several crudes and Tertiary-Upper Cretaceous sediments . Organic Geochemistry , 13 : 671 – 675 . [CROSSREF] [CSA]
- Rogers , K. M. , Collen , J. D. , Johnston , J. H. and Elgar , N. E. 1999 . A geological appraisal of oil seeps from the East Coast Basin, New Zealand . Organic Geochemistry , 30 : 593 – 605 . [CROSSREF] [CSA]
- Rohmer , M. , Bisseret , P. and Neunlist , S. 1992 . “ The hopanoids, prokaryotic triterpenoids and precursors of ubiquitous molecular fossils ” . In Biological Markers in Sediments and Petroleum Edited by: Moldowan , J. M. , Albrecht , P. and Philp , R. P. Vol. 54 , 1 – 17 . Prentice Hall , NJ
- Sauer , T. C. and Boehm , P. D. The use of defensible analytical chemical measurements for oil spill natural resource damage assessment . Proceedings of the 1991 Oil Spill Conference . pp. 363 – 370 . Washington , DC : American Petroleum Institute .
- Seifert , W. K. 1977 . “ Source rock/oil correlations by C27-C30 biological marker hydrocarbons ” . In Advances in Organic Geochemistry 1974 , Edited by: Campos , R. and Goni , J. 21 – 44 . Madrid , Spain : Enadimsa .
- Seifert , W. K. and Moldowan , J. M. 1978 . Application of steranes, terpanes, and monoaromatics to the maturation, migration, and source of crude oils . Geochimica et Cosmochimica Acta , 42 : 77 – 95 . [CROSSREF] [CSA]
- Seifert , W. K. and Moldowan , J. M. 1981 . Paleoreconstruction by biological markers . Geochimica et Cosmochimica Acta , 45 : 783 – 794 . [CROSSREF] [CSA]
- Seifert , W. K. and Moldowan , G. J. 1986 . “ Use of biological markers in petroleum exploration ” . In Methods in geochemistry and geophysics Edited by: Johns , R. B. Vol. 24 , 261 – 290 .
- Seifert , W. K. , Moldowan , J. M. and Demaison , G. J. 1984 . Source correlation of biodegraded oils . Organic Geochemistry , 6 : 633 – 643 . [CROSSREF] [CSA]
- Shen , J. 1984 . Minimization of interferences from weathering effects and use of biomarkers in identification of spilled crude oils by gas chromatography/mass spectrometry . Analytical Chemistry , 56 : 214 – 217 . [CROSSREF] [CSA]
- Short , J. W. and Heintz , R. A. 1997 . Identification of Exxon Valdez oil in sediments and tissues from Prince William Sound and the Northwestern Gulf of Alaska based on a PAH weathering model . Environmental Science Technology , 31 : 2375 – 2384 . [CROSSREF] [CSA]
- Short , J. W. , Jackson , T. J. , Larsen , M. L. and Wade , T. L. 1996 . Analytical methods used for the analysis of hydrocarbons in crude oil, tissues, sediments, and seawater collected for the natural resources damage assessment of the Exxon Valdez oil spill . American Fisheries Society Symposium , 18 : 140 – 148 . [CSA]
- Short , J. W. , Kvenvolden , K. A. , Carlson , P. R. , Hostettler , F. D. , Rosenbauer , R. J. and Wright , B. A. 1999 . Natural hydrocarbon background in benthic sediments of Prince William Sound, Alaska: Oil vs. coal . Environmental Science Technology , 33 : 34 – 42 . [CROSSREF] [CSA]
- Short , J. W. , Lindeberg , M. R. , Harris , P. M. , Maselko , J. M. , Pella , J. J. and Rice , S. D. 2004 . Estimate of oil persisting on the beaches of Prince Willam Sound 12 years after the Exxon Valdez spill . Environmental Science Technology , 38 : 19 – 25 . [INFOTRIEVE] [CROSSREF] [CSA]
- Simanzhenkov , V. and Idem , R. 2003 . Crude Oil Chemistry , New York : Marcel Dekker, Inc .
- Sosrowidjojo , I. B. , Alexander , R. and Kagi , R. I. 1994 . The biomarker composition of some crude oils from Samatra . Organic Geochemistry , 21 : 303 – 312 . [CROSSREF] [CSA]
- Speight , J G. 1999 . The Chemistry and Technology of Petroleum , New York : Marcel Dekker, Inc. .
- Speight , J. G. 2002 . Handbook of petroleum product analysis , Hoboken , NJ : Wiley-Interscience .
- Stella , A , Piccardo , M. T. , Coradeghini , R. , Redaelli , A. , Lanteri , S. , Armanino , C. and Valerio , F . 2002 . Principal component analysis application in polycyclic aromatic hydrocarbons “mussel watch” analyses for source identification . Analytica Chimica Acta , 461 : 201 – 213 . [CROSSREF] [CSA]
- Stout , S. A. and Douglas , G. S. 2004 . Diamondoid hydrocarbons—application in the chemical fingerprinting of natural gas condensate and gasoline . Environmental Forensics , 5 : 225 – 235 . [CROSSREF] [CSA]
- Stout , S. A. , Uhler , A. D. and McCarthy , K. J. 2001 . A strategy and methodology for defensibly correlating spilled oil to source candidates . Environmental Forensics , 2 : 87 – 98 . [CSA]
- Stout , S. A. , Uhler , A. D. and McCarthy , K. J. 2005 . Middle distillate fuel fingerprinting using drimane-based bicyclic sesquiterpanes . Environmental Forensics , 6 : 241 – 252 . [CROSSREF] [CSA]
- Stout , S. A. , Uhler , A. D. , McCarthy , K. J. and Emsbo-Mattingly , S. S. 2002 . “ Chemical fingerprinting of hydrocarbons ” . In Introduction to Environmental Forensics , Edited by: Murphy , B. L. and Morrison , R. D. 139 – 260 . London : Academic Press .
- Stout , S. A. , Uhler , A. D. , Naymik , T. G. and McCarthy , K. J. 1998 . Environmental forensics: Unravelling site liability . Environmental Science and Technology , 32 : 260A – 264A . [CSA]
- Summons , R. E. and Jahnke , L. L. 1992 . “ Hopenes and hopanes methylated in Ring A: Correlation of the hopanoids from extant methylotrophic bacteria with their fossil analogues ” . In Biological Markers in Sediments and Petroleum , Edited by: Moldowan , J. M. , Albrecht , P. and Philp , R. P. 182 – 194 . Englewood Cliffs , NJ : Prentice Hall .
- Summons , R. E. , Thomas , J. , Maxwell , J. R. and Boreham , C. J. 1992 . Secular and environmental constraints on the occurrence of dinosterane in sediments . Geochimica Cosmochimica Acta , 56 : 2437 – 2444 . [CROSSREF] [CSA]
- Swannel , R P. J. , Lee , K. and McDonaph , M. 1996 . Field evaluation of marine oil spill bioremediation . Microbial Rev. , 60 : 342 – 365 . [CSA]
- Telnaes , N. and Dahl , B. 1986 . Oil-oil correlation using multivariate techniques . Organic Geochemistry , 10 : 425 – 432 . [CROSSREF] [CSA]
- Uhler , A. D. , Stout , S. A. and McCarthy , K. J. 1998–1999 . “ Increased sucssess of assessments at petroleum sites in 5 steps ” . In Soil and Groundwater Cleanup 13 – 19 . Dec/Jan
- van Aarssen , B. G. K. , Cox , H. C. , Hoogendoorn , P. and de Leeuw , J. W. 1990 . A cadinene biopolymer present in fossil and extract Dammar resins as source for cadinanes and dicadinanes in crude oils from Southeast Asia . Geochimica et Cosmochimica Acta , 54 : 3021 – 3031 . [CROSSREF] [CSA]
- Volkman , J. K. , Alexander , R. , Kagi , R. I.J. and Rüllkøtter , J. 1983a . GC-MS characterization of C27 and C28 triterpanes in sediments and petroleum . Geochimica Cosmochimica Acta , 47 : 1033 – 1040 . [CROSSREF] [CSA]
- Volkman , J. K. , Alexander , R. , Kagi , R. I. and Woodhouse , G. W. 1983b . Demethylated hopanes in crude oils and their applications in petroleum geochemistry . Geochimica Cosmochimet Acta , 47 : 785 – 794 . [CROSSREF] [CSA]
- Volkman , J. K. , Holdsworth , D. G. , Neill , G. P. and Bavor , H. J. Jr. 1992a . Identification of natural, anthropogenic and petroleum hydrocarbons in aquatic environments . Science of the Total Environment , 112 : 203 – 219 . [INFOTRIEVE] [CROSSREF] [CSA]
- Volkman , J. K. , O'Leary , T. , Summons , R. E. and Bendall , M. R. 1992b . Biomarker composition of some asphaltic coastal bitumens from Tasmania, Australia . Organic Geochemistry , 18 : 669 – 682 . [CROSSREF] [CSA]
- Volkman , J. K. , Revil , A. T. and Murray , A. P. 1997 . “ Application of biomarkers for identifying sources of natural and pollutant hydrocarbons in aquatic environments ” . In Molecular Markers in Environmental Geochemistry , Edited by: Eganhouse , R. P. 83 – 99 . Washinton , DC : American Chemical Society .
- Wang , P. , Li , M. and Larter , S. R. 1996 . Extended hopanes beyond C40 in crude oils and source rock extracts from the Liaohe Basin, N. E. China . Organic Geochemistry , 24 : 547 – 551 . [CROSSREF] [CSA]
- Wang , Z. D. and Fingas , M. 1995 . Study of the effects of weathering on the chemical composition of a light crude oil using GC/MS and GC/FID . Journal of Microcolumn Separation , 7 : 617 – 639 . [CROSSREF] [CSA]
- Wang , Z. D. and Fingas , M. 2003 . Development of oil hydrocarbon fingerprinting and identification techniques . Marine Pollution Bulletin , 47 : 423 – 452 . [INFOTRIEVE] [CSA]
- Wang , Z. D. , Fingas , M. , Blenkinsopp , S. , Sergy , G. , Landriault , M. and Sigouin , L. 1998a . Study of the 25-year-old Nipisi oil spill: persistence of oil residues and comparisons between surface and subsurface sediments . Environmental Science and Technology , 32 : 2222 – 2232 . [CSA]
- Wang , Z. D. , Fingas , M. , Blenkinsopp , S. , Sergy , G. , Landriault , M. , Sigouin , L. , Foght , J. , Semple , K. and Westlake , D. W. S. 1998c . Oil composition changes due to biodegradation and differentiation between these changes to those due to weathering . Journal of Chromatography A , 809 : 89 – 107 . [INFOTRIEVE] [CROSSREF] [CSA]
- Wang , Z. D. , Fingas , M. and Lambert , P. 2004 . Characterization and identification of Detroit River mystery oil spill (2002) . Journal of Chromatography , 1038 : 201 – 214 . [INFOTRIEVE] [CROSSREF] [CSA]
- Wang , Z. D. , Fingas , M. , Landriault , M. , Sigouin , L. , Castel , B. , Hostetter , D. , Zhang , D. and Spencer , B. 1998b . Identification and linkage of tarballs from the coasts of Vancouver Island and Northern California using GC/MS and isotopic techniques . J. High Resolut. Chromatogr , 21 : 383 – 395 . [CROSSREF] [CSA]
- Wang , Z. D. , Fingas , M. , Landriault , M. , Sigouin , L. , Feng , Y. and Mullin , J. 1997 . Using systematic and comparative analytical data to identify the source of an unknown oil on contaminated birds . Journal of Chromatography , 775 : 251 – 265 . [CROSSREF] [CSA]
- Wang , Z. D. , Fingas , M. , Landriault , M. , Sigouin , L. , Grenon , S. and Zhang , D. 1999b . Source identification of an unknown spilled oil from Quebec (1998) by unique biomarker and diagnostic ratios of “source-specific marker” compounds . Environmental Technology , 20 : 851 – 862 . [CSA]
- Wang , Z. D. , Fingas , M. , Landriault , M. , Sigouin , L. and Xu , N. 1995b . Identification of alkylbenzenes and direct determination of BTEX and (BTEX + C3-Benzenes) in oils by GC/MS . Analytical Chemistry , 67 : 3491 – 3500 . [CROSSREF] [CSA]
- Wang , Z. D. , Fingas , M. and Li , K. 1994a . Fractionation of ASMB Oil, identification and quantitation of aliphatic, aromatic and biomarker compounds by GC/FID and GC/MSD . J. Chromatogrophy Science Series , 32 : 361 – 366 . 367–382 (Part II).Part I[CSA]
- Wang , Z. D. , Fingas , M. , Owens , E. H. , Sigouin , L. and Brown , C. E. 2001b . Long-term fate and persistence of the spilled Metula oil in a marine salt marsh environment: degradation of petroleum biomarkers . Journal Chromatography , 926 : 275 – 190 . [CROSSREF] [CSA]
- Wang , Z. D. , Fingas , M. and Page , D. 1999a . Oil spill identification . Journal of Chromatography , 843 : 369 – 411 . [CROSSREF] [CSA]
- Wang , Z. D. , Fingas , M. and Sergy , G. 1994b . Study of 22-year-old arrow oil samples using biomarker compounds by GC/MS . Environmental Science and Technology , 28 : 1733 – 1746 . [CROSSREF] [CSA]
- Wang , Z. D. , Fingas , M. and Sergy , G. 1995a . Chemical characterization of crude oil residues from an Arctic Beach by GC/MS and GC/FID . Environmental Science and Technology , 29 : 2622 – 2631 . [CSA]
- Wang , Z. D. , Fingas , M. and Sigouin , L. 2000 . Characterization and source identification of an unknown spilled oil using fingerprinting techniques by GC-MS and GC-FID . LC-GC , 10 : 1058 – 1068 . [CSA]
- Wang , Z. D. , Fingas , M. and Sigouin , L. 2001a . Characterization and identification of a “mystery” oil spill from Quebec (1999) . Journal Chromatography , 909 : 155 – 169 . [CROSSREF] [CSA]
- Wang , Z. D. , Fingas , M. and Sigouin , L. 2002 . Using multiple criteria for fingerprinting unknown oil samples having very similar chemical composition . Environmental Forensics , 3 : 251 – 262 . [CSA]
- Wang , Z. D. , Hollebone , B. P. , Yang , C. , Fingas , M. , Fieldhouse , B. and Weaver , J. Development of a physical and chemical property database for ten US EPA-selected oils . Proceedings of the 26th Arctic and Marine Oil Spill Program (AMOP) Technical Seminar . pp. 117 – 142 . Ottawa : Environment Canada .
- Wang , Z. D. , Hollebone , B. P. , Yang , C. , Fingas , M. and Landriault , M. 2003b . MMS Report: Physical Properties and Chemical Compositions of Selected Oils , Ottawa : Environment Canada .
- Wang , Z. D. , Yang , C. , Fingas , M. , Hollebone , B. , Peng , X. , Hansen , A. and Christensen , J. 2005 . Characterization, weathering, and application of sesquiterpanes to source identification of spilled petroleum products . Environmental Science and Technology , 39 : 8700 – 8707 . [INFOTRIEVE] [CROSSREF] [CSA]
- Wang , Z. D. , Yang , C. and Hollebone , B. 2005 . “ Characterization and application of diamondoids to environmental forensic studies ” . In Symposium of Environmental Forensics, Pacifichem 2005 , Hawaii : American Chemical Society .
- Waples , D. W. and Machihara , T. 1991 . Biomarkers for geologists , American Association of Petroleum Geologists . AAPG Methods in Exploration Series No. 9 (91 pages)
- Williams , J. A. , Bjoroy , M. , Dolcater , D. L. and Winters , J. C. 1986 . Biodegradation in South Texas Eocene oil-effects on aromatics and biomarkers . Organic Geochemistry , 10 : 451 – 462 . [CROSSREF] [CSA]
- Wingert , W. S. 1992 . GC-MS analysis of diamondoid hydrocarbons in Smackover petroleums . Fuel , 71 : 37 – 43 . [CROSSREF] [CSA]
- Zakaria , M. P. , Horinouchi , A. , Tsutsumi , S. , Takada , H. , Tanabe , S. and Ismail , A. 2000 . Oil pollution in the Straits of Malacca, Malaysia: Application of molecular markers for source identification . Environmental Science and Technology , 34 : 1189 – 1196 . [CROSSREF] [CSA]
- Zakaria , M. P. , Okuda , T. and Takada , H. 2001 . PAHs and hopanes in stranded tar-balls on the coast of Peninsular Malaysia: Applications of biomarkers for identifying source of oil pollution . Marine Pollution Bulletin , 12 : 1357 – 1366 . [CSA]
- Zhang , S. , Liang , D. , Gong , Z. , Wu , K. , Li , M. , Song , F. , Song , Z. , Zhang , D. and Wang , P. 2003 . Geochemistry of petroleum system in the eastern Pearl River Mouth Basin: Evidence for mixed oils . Organic Geochemistry , 34 : 971 – 991 . [CROSSREF] [CSA]