
 ?Mathematical formulae have been encoded as MathML and are displayed in this HTML version using MathJax in order to improve their display. Uncheck the box to turn MathJax off. This feature requires Javascript. Click on a formula to zoom.
Abstract
Oil spills and natural oil seeps are sources of petrogenic hydrocarbons in soils and sediments. To determine the source of hydrocarbon contamination in the environment the geochemical signature of the contaminant needs to be characterised. Here, we present biomarker and other molecular marker diagnostic ratios of Alberta Oil Sands using gas chromatography-mass spectrometry to characterise the deposits and detect their incorporation in surficial sediments. Diagnostic ratios of steranes, terpanes, and aromatic steroids (e.g. C27, C28, and C29 regular sterane abundance, Gammacerane Index, Ts/Tm, TAS/(TAS + MAS), and MPI-2) were measured in samples of Alberta Oil Sands providing a set of criteria for their identification. Seven surficial sediment samples from central and southeast Alberta were then analysed using these criteria to detect Alberta Oil Sands contamination and other petrogenic and pyrogenic source inputs. Geochemical signatures consistent with Alberta Oil Sands hydrocarbons were identified in surficial sediments in Lamont County and glacial sediments from a moraine in Beaver County. Both sites are in Central Alberta, ∼300 km south of any oil sands extraction sites and natural exposures in northern Alberta, indicating long-distance sediment transport processes mobilised the deposits. These results show that the oil sands have been eroded and transported beyond the boundaries of their current known limits. This is important for understanding sediment transport processes as well as for remediation and reclamation purposes.
1. Introduction
Hydrocarbon contamination from anthropogenic oil spills or natural oil seeps in soils and sediments can present serious environmental health concerns due to their impacts on water quality, soil and aquatic ecology, and human health (Pinedo et al., Citation2013; Wang et al., Citation2014; Ferguson et al., Citation2020). It is therefore crucial to identify sources of sediment contamination, either through anthropogenic pollution or natural hydrocarbon seepage, for environmental monitoring and remediation purposes. To achieve this, the geochemical signature of contaminated sediment can be used to relate the hydrocarbons present to their source using oil-source correlation techniques. However, once the oil has entered the environment, it is subject to several natural contemporary weathering processes which can alter the geochemical signature (based on the prevailing physiochemical conditions of the environment). These weathering processes such as biodegradation, evaporation, water washing, and oxidation can complicate source identification processes (Wang and Fingas, Citation1995; Yang et al., Citation2013). As hydrocarbons are also found throughout the environment, from i) petrogenic sources such as light fuels and crude oils from spills or natural hydrocarbon seepage; ii) pyrogenic sources such as natural or anthropogenic burning of organic material and fossil fuels; and iii) biogenic sources which are formed through contemporary biological activity (Wang et al., Citation2014), it is important to identify the distinct geochemical fingerprint of different hydrocarbon sources for accurate source identification.
Geochemical fingerprinting of source oils and potentially contaminated sediments can be performed by the evaluation of certain biomarkers (Peters and Fowler, Citation2002; Curiale, Citation2008; Meyer et al., Citation2014). Biomarkers are more resistant to weathering than non-biomarker compounds (such as, n-alkanes and most aromatic hydrocarbons), and are often used to identify the source of an unknown oil by comparison with the biomarker distribution in known sources (Wang et al., Citation2006; Meyer et al. Citation2014). The geochemical signature can be analysed in terms of its diagnostic ratios which are oil-source specific and therefore independent of compound concentrations (Wang et al., Citation2000). Several diagnostic ratios obtained by utilising gas chromatography-mass spectrometry (GC-MS) have been routinely used to identify oil signatures in crude oils and sediments using either one or a combination of compound classes such as n-alkanes, acyclic isoprenoids, steranes, terpanes, aromatic steroids, and polycyclic aromatic hydrocarbons (PAHs) (Wang et al. Citation2000). PAHs are particularly useful for distinguishing between petrogenic and pyrogenic hydrocarbon sources, which is a useful tool for environmental contamination assessments in sediments where multiple contaminants may be present (Headley et al., Citation2001).
In this paper we apply an oil fingerprinting technique to analyse the geochemical signature of surficial and glacial sediments in Alberta to identify any potential Alberta Oil Sands-sourced contamination. A number of studies have characterised the geochemical signature of the Alberta Oil Sands deposits (e.g. Fowler and Brooks, Citation1987; Brooks et al., Citation1988; Strausz et al., Citation2010; Yang et al., Citation2011), however, they often do not take into consideration the effects of contemporary weathering and biodegradation, or the influence of the contemporary background sedimentary environments’ geochemistry. We use both biomarker and non-biomarker compounds and their diagnostic ratios in Alberta Oil Sands reference material from Cold Lake bitumen, the Aurora Mine, and the Amphitheatre Outcrop on the MacKay River to characterise the oil sands fingerprints. We then evaluate surficial sediments with unknown contamination status using the key diagnostic ratios of the Alberta Oil Sands to demonstrate that historic erosional processes have naturally spread Alberta Oil Sands deposits beyond the current known deposits and exposures.
2. Study area: Alberta, Canada
The Alberta Oil Sands in northern Alberta, Canada comprises the largest oil sand deposits in North America. The deposits are defined by three major accumulations: (i) the Athabasca deposits in the Cretaceous McMurray Formation (Fustic et al., Citation2012), (ii) the Cold Lake deposits in the Grand Rapids-Clearwater Formation, and (iii) the Peace River oil sands in the Bluesky-Gething deposits (Bennett and Jiang, Citation2021). As with most oil sand deposits, the location of the Alberta Oil Sands was first determined by surface exposures of natural oil seeps (Hunt et al., Citation2002; Paragon, Citation2006). Contemporary surface exposures of the oil sands are currently present along the MacKay and Athabasca Rivers in northern Alberta (Figure SI1) (Hein et al., Citation2001; Hein and Cotterill, Citation2006).
The source rock depositional conditions of the Alberta Oil Sands bitumen has been studied and characterised extensively (e.g. Fowler and Brooks, Citation1987; Brooks et al., Citation1988; Strausz et al., Citation2010; Yang et al., Citation2011). However, varying levels of biodegradation driven by long distance south-west to north-east migration of the deposits within the hydrocarbon basin has resulted in some variation in the geochemical signatures with decreasing degrees of biodegradation to the west due to higher reservoir temperatures (Adams et al., Citation2006; Marcano et al., Citation2013). It should therefore be noted that conventional oil-source correlation methods using qualitative and quantitative methods of matching either the chromatograms of the contaminated sediment and the source oil or using statistical analysis of diagnostic ratios is complicated in such varied and biodegraded oil deposits (Bennett and Jiang, Citation2021).
Contemporary contamination from the Alberta Oil Sands activities can enter the environment through several pathways, e.g. spills during transport, tailing ponds, pipeline leaks, and stack emissions (Timoney and Lee, Citation2009). There are numerous reports of sediment contamination linked to extraction in the Fort McMurray area and the erosion of natural exposures (e.g. Conly et al., Citation2002; Rodríguez-Estival and Smits, Citation2016; Droppo et al., Citation2018; Citation2019). This is especially true of the Athabasca River which is affected by upstream development and extraction work, with both atmospheric and waterborne contaminants entering the Athabasca River system and contributing to toxic levels of PAHs (Kelly et al., Citation2009).
However, the Athabasca River is also affected by natural hydrocarbon contamination from mobilisation of oil deposits from exposures that have been incised by the river (Conly et al. Citation2002). Headley et al. (Citation2001) used an analysis of PAH presence in the Athabasca River and its tributaries to detect the presence of naturally occurring hydrocarbons in the river system. Their results showed that naturally derived PAHs were present in relatively high concentrations in the Athabasca River tributaries, and gas chromatography-flame ionisation detection (GC-FID) traces revealed good matches between the oil sands material and the riverbank materials (Headley et al., Citation2001). This highlights the importance of distinguishing between contamination caused by these natural deposits and those arising from anthropogenic activity.
Environmental site-characterisation work in the oil sands region of northern Alberta has also identified “unusual” oil sands deposits in surficial sediments (0–3 m below surface) in the form of isolated tar bands, balls, and layers, which range from a few centimetres to a few metres thick (Andriashek and Pawlowicz, Citation2002; Paragon, Citation2006; Fleming et al., Citation2012). These deposits were classified as “unusual” due to their location and depth not being associated with the known natural exposures and oil sands extraction sites (Fleming et al., Citation2012). As these deposits cannot be directly linked to an oil spill or stratigraphically correlated to an exposure, geochemical fingerprinting is required to identify their origin. It was noted that the presence of these deposits could be attributed to historic sediment mobilisation linked to the Laurentide glaciation and the subsequent erosional processes (e.g. Fleming et al., Citation2012, Andriashek Citation2018). The reworking of oil deposits from reservoir rocks into contemporary surficial sediments through erosion and deposition cycles has also been shown to have occurred in the Canadian Arctic by Parnell et al. (Citation2008), where reworked hydrocarbons produce mixed signals in younger contemporary sediments, providing information about erosion history and sediment transport (Parnell et al., Citation2008; Yin and Huang, Citation2020). The ability to separate the geochemical signature of the eroded and reworked reservoir rock hydrocarbons from other hydrocarbon sources is therefore crucial for identifying the true source of contamination (Parnell et al., Citation2008).
3. Materials and methods
3.1. Sample collection
Samples containing known Alberta Oil Sands deposits were collected from northern Alberta within the Athabasca Oil Sands region shown in and described in . A sample of oil sands was taken from the Aurora Mine in Wood Buffalo and two samples of oil-bearing, poorly consolidated sandstone from the Amphitheatre outcrop along the MacKay River. The two Amphitheatre outcrop samples were differentiated based on their visual properties; one sample contained a larger amount of visible bitumen (sample A1), whilst the other sample was more visibly weathered and appeared to contain less bitumen (sample A2). Samples were stored at room temperature out of direct sunlight until ready for analysis.
Figure 1. Map of Alberta Oil Sands deposits and surficial sediment sampling locations in relation to surface geology (adapted from Alberta Geological Survey, 2013) and the Alberta Oil Sands deposits (adapted from Auch, Citation2014).
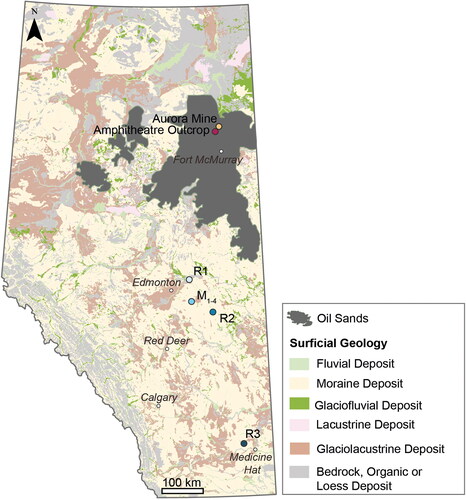
Table 1. Sample locations and sample types used to characterise Alberta Oil Sands geochemical signatures and identify deposits in surficial sediments.
Surficial sediments, R‘x’, were sampled from the roadside at shallow depths of between 20 and 50 cm using a shovel and trowel (). The surface soils were removed at this depth which allowed for sampling of the glacial, glaciofluvial, and glaciolacustrine sediments below (as per the Alberta Geological Survey (2013) surficial geology characterisation). This targeted depth also reduced the impact of contemporary surface processes and oxidation on the geochemical signature of the sediment.
Sediment (∼50 g) was collected at each site using a sterile plastic test tube and scraper. All sediments were refrigerated (at 5–7 °C) upon collection. Sample R1 was taken from the roadside of Highway 45, north of Bruderheim, and contained visible evidence of bitumen staining in the sampling pit. The surrounding surficial geology is a mixture of bedrock, glaciofuvial, glaciolacustrine, and glacial moraine deposits. Samples R2 and R3 were taken from the roadside on Highway 14, southeast of Edmonton and the Trans-Canada Highway northwest of Medicine Hat respectively, both showed no visible bitumen staining in the sampling pits. The surrounding surficial geology for both samples is predominantly glacial moraine deposits. Glacial sediments were also sampled from a moraine, M1-M4, in the Cooking Lake area of Beaver County (Figure SI1 in Supplement). The exposure face is approximately 1.5 m high and composed of sandy diamict.
To compare the geochemical characteristics of different oil deposits, all the samples described above were compared with processed Cold Lake bitumen from the Clearwater Formation. This set of samples () allowed for the comparison of the geochemical characteristics of different oil deposits; (i) mined and processed bitumen (Cold Lake), (ii) surface extractable oil sand from Athabasca (Aurora Mine), (iii) naturally exposed oil sands deposits (Amphitheatre Outcrop), and (iv) surficial sediments.
3.2. Sample preparation
The Aurora Mine and Amphitheatre outcrop samples were ground using an agate mortar and pestle and the surficial sediments were pulverised with a Tema laboratory disc mill. The ground Aurora Mine bitumen (∼4 g), Amphitheatre Outcrop A1 (∼9 g), Amphitheatre Outcrop A2 (∼21 g), and surficial roadside (Rx) and moraine (Mx) sediments (∼6–10 g) were added to individual Dionex™ ASE™ stainless steel extraction cells and extracted using 25 ml of 90:10 (v/v) dichloromethane:methanol DCM:MeOH for 35 mins using a Dionex™ ASE™ 350 Accelerated Solvent Extractor (ASE). The extracts were collected in 50 ml extraction vials, after which, they were rotary evaporated down to a final volume of approximately 10 ml.
The sample extracts (in DCM:MeOH) were subsequently solvent exchanged into petroleum ether (CAS 64742-49-0) before being separated into saturated and aromatic hydrocarbon fractions using column chromatography. The columns used were 150 mm disposable glass pasteur pipettes plugged with pre-extracted cotton wool and filled with 50 mm column length of pre-extracted and activated chromatography grade silica. An aliquot of extract and petroleum ether was added to the silica column and the saturated hydrocarbon fraction was eluted using petroleum ether (2 ml) and collected in a vial. The aromatic fraction was then eluted using 1:1 (v/v) petroleum ether:dichloromethane (2 ml) and collected in a vial. The saturated fraction was evaporated down to 500 µL and the aromatic fraction to 50 µL using a gentle flow of nitrogen gas and transferred to a vial for analysis by GC-MS.
3.3. GC-MS analysis of target compounds
GC-MS analysis of saturated and aromatic hydrocarbon fractions was performed on an Agilent 7890B GC fitted with a split/splitless injector (at 280 °C) linked to an Agilent 5977B mass selective detector (electron voltage: 70 eV; source temperature: 230 °C; quadrupole temperature: 150 °C, multiplier voltage: 1800 v; interface temperature: 310 °C). All samples were analysed in selected ion monitoring (SIM) mode (30 ions, 35 ms dwell). Each sample (in 1 μL) was injected in splitless (for 1 min) mode using an Agilent G4567A autosampler. Separation was performed on an Agilent fused silica capillary column (60-m, 0.25-mm i.d.) coated with 0.25 mm HP-1 phase. The GC was temperature programmed from 50 °C to 310 °C at 5 °C/min and held at final temperature for 10 min with helium as the carrier gas (flow rate of ∼1 ml/min, initial inlet pressure of 50 kPa, split at 30 ml/min). The concentrations of individual compounds were measured using n-heptadecylcyclohexane (HDCH) and 1,1′-binaphthyl (1,1-BN) internal standards using response factors of 1, for the saturated and aromatic components, respectively.
To calculate the diagnostic ratios, peak area integration was performed on the Agilent Chemstation software. The ratios were then used to create biomarker cross-plots to aid in the correlation and characterisation of the samples. To calculate the concentration of individual compounds of interest, the peak areas of the compounds were compared with those of internal standard of known concentration (HDCH for saturate fraction and 1,1-BN for aromatics fraction). The concentration was then calculated using the following equations (EquationEquation 1(1)
(1) ):
(1)
(1)
where WA is the weight of analyte in µg, in the GC vial. WI S is the weight of internal standard in µg in the GC vial, AA is the area of the analyte peak, and AI S is the area of the internal standard peak. The concentration of the analyte is then calculated using EquationEquation 2
(2)
(2) :
(2)
(2)
where CA is the concentration of analyte in µg/mg of sample and WA is the weight of extract (mg) used in the column separation giving the concentration of the analyte in µg/mg of the total extractable organic matter of the sample.
The specific diagnostic ratios used in this study are shown in . The diagnostic ratios were firstly used to characterise the Alberta Oil Sands samples and to compare the results here with those in the existing literature to determine a set of key diagnostic ratios that can be used to their contamination in sediments. Secondly, the diagnostic ratios were measured for the surficial sediment samples and compared with those from the Alberta Oil Sands to determine their contamination status.
Table 2. Compounds and parameters used to calculate the diagnostic ratios in and .
4. Geochemical results and discussion
4.1. Characterisation of Alberta Oil Sands
In the saturated hydrocarbon fraction, the gas chromatograms of all oil sand samples exhibit prominent unresolved complex mixture (UCM) signals in the n-C15 to n-C40 range, with no identifiable peaks corresponding to n-alkanes and isoprenoids (such as pristane and phytane) (Figure SI2 in Supplement). The removal of n-alkanes and isoprenoids due to biodegradation and water washing is typically seen in other Alberta Oil Sands characterisations, such as Yang et al. (Citation2011), as well as the presence of UCM which is also indicative of heavily degraded oils and bitumens (e.g. Andriashek and Pawlowicz, Citation2002; Peters and Fowler, Citation2002; Yang et al., Citation2011).
In the sterane series (m/z 217 and m/z 218), although pregnanes are present and identifiable, the steranes could not be confidently identified in the Aurora Mine bitumen (), potentially due to extensive contemporary biodegradation processes. For the other Alberta Oil Sands samples (Cold Lake, Amphitheatre Outcrop (A1 and A2)), the diagnostic ratios of C27, C28, and C29 regular steranes abundance showed some variability between samples (). Both the Cold Lake bitumen and the Amphitheatre Outcrop (A2) samples have a nearly equal abundance of C27 and C29 steranes (), which is typical of oil sands from Alberta, with these results being comparable to those previously presented by Fowler and Brooks (Citation1987) and Brooks et al. (Citation1988). However, the Amphitheatre Outcrop (A1) sample has a slightly higher predominance of the C29 steranes (). The lack of consistency in these particular sterane ratios are highlighted by the high standard deviations (±1.7–3.4) between samples. Due to this high variability, these ratios were not considered key diagnostic indicators of Alberta Oil Sands contamination when characterising the surficial sediment samples.
Figure 2. m/z 217 and m/z 218 ion chromatograms of the saturated hydrocarbon fractions of the Alberta Oil Sands samples showing sterane distributions. The grey shading highlights the key compounds used to calculate the diagnostic ratios in .
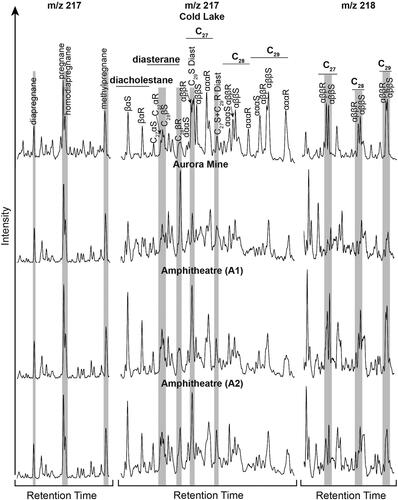
Table 3. Extracted Organic Matter (EOM), selected concentrations, and biomarker and non-biomarker diagnostic ratios from the Alberta Oil Sands samples.
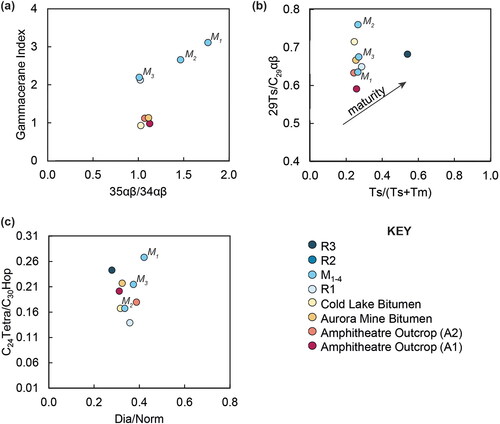
The two Amphitheatre Outcrop samples have the highest pregnane (0.63–0.70) and diasterane ratios (0.25–0.40). The heavy degrees of biodegradation suggested by these ratios is also supported by other geochemical signature studies of the Alberta Oil Sands (e.g. Brooks et al., Citation1988; Bennett and Larter, Citation2008; Strausz et al., Citation2010). However, these ratios also have high standard deviations and ranges between samples of the Alberta Oil Sands (), and therefore may not be suitable for oil-oil correlation in this instance. Whereas the sterane St29S/R and St29I/R diagnostic ratios show consistent values of 0.68–0.71 and 0.59–0.69 respectively, between the Alberta Oil Sands samples. These two ratios have the lowest standard deviations and ranges in the sterane series (), making them key ratios for this oil-oil correlation.
In the terpane series (m/z 191), the Alberta Oil Sands samples show a similar hopane distribution pattern (). The presence of gammacerane and 28,30-bisnorhopane (28,30-BNH) in all Alberta Oil Sands samples is ubiquitous in the oil sands and widely reported in other characterisations (e.g. Brooks et al., Citation1988; Andriashek and Pawlowicz, Citation2002; Bennett et al., Citation2009; Yang et al., Citation2011; Bennett and Jiang, Citation2021). These two compounds are therefore considered key indicators of Alberta Oil Sands contamination in this study.
Figure 3. m/z 191 ion chromatograms of the saturated hydrocarbon fraction of the Alberta Oil Sands samples showing the terpane, including hopane, distributions. The grey shading highlights the key compounds used to calculate the diagnostic ratios in .
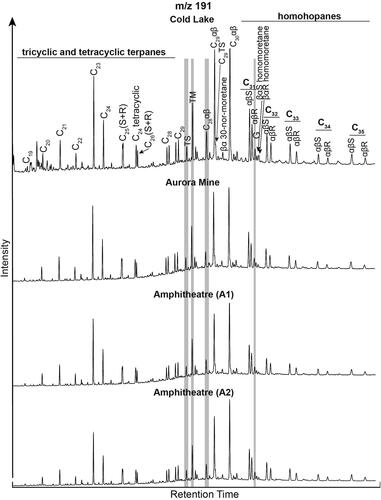
The Ts/(Ts + Tm) ratio is also consistent in the Alberta Oil Sands samples, with a range between 0.24 and 0.26, similar to Yang et al.’s (Citation2011) recorded values of 0.24–0.32 in raw Alberta Oil Sands, and the range of values calculated by Hoffmann and Strausz, (Citation1986) and Brooks et al., (Citation1988) for heavy oils in the Western Canada basin and Athabasca bitumen. All terpane ratios used here ( and ) have low standard deviations (<0.5) between Alberta Oil Sands samples making them key ratios for characterising the surficial sediments.
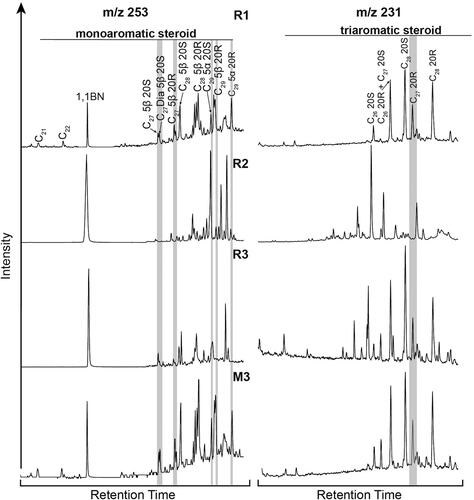
In the aromatic fraction, the aromatic steroid series (m/z 231 and 253) in shows some variation in the Alberta Oil Sands samples with the absence of C20 and C21 triaromatic steroids (TAS) in the Aurora Mine bitumen and Amphitheatre Outcrop (A2) samples. This is consistent with observations by Yang et al., (Citation2011) who found that the C20 to C22 TAS were preferentially removed in the most severely biodegraded samples of Alberta Oil Sands. These differences are to be expected due to the different degradation levels at the sampling sites, and suggest gradual removal of the C20 and C21 TAS through contemporary surficial weathering rather than during their formation (e.g. Barakat et al., Citation2002).
Figure 4. m/z 253 and m/z 231 ion chromatograms of the aromatic hydrocarbon fractions of the Alberta Oil Sands samples showing the aromatic steroid distributions. The grey shading highlights the key compounds used to calculate the diagnostic ratios in .
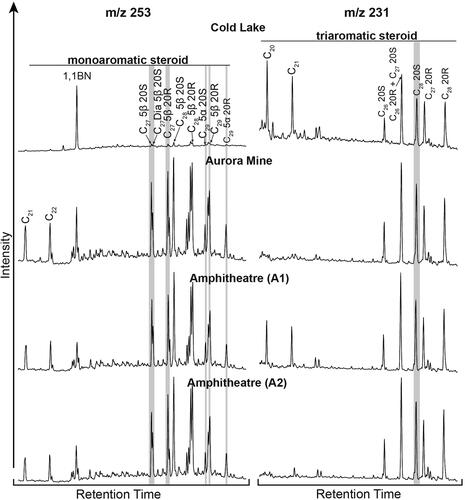
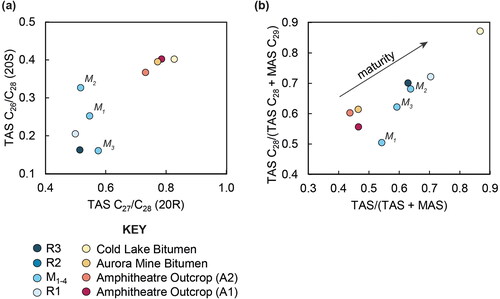
The TAS C27/C28 (20 R) and C26/C28 (20S) ratios better illustrate similarities in the aromatic steroid series in the Alberta Oil Sands samples (). The low ranges (≤0.1) and standard deviations (≤ ±0.05) indicate a similar source for all of the oil sands samples. These compounds are especially resistant to biodegradation where the C20 and C21 TAS are not (Yang et al. Citation2011), making them useful compounds in oil-oil correlations. The TAS/(TAS + MAS) and the C28TAS/C28TAS + C29MAS diagnostic ratios indicate some differences between the Cold Lake bitumen and the other samples making these ratios useful indicators of processed Alberta Oil Sands contamination, allowing for the distinction between potential spills and natural contamination.
PAHs were also analysed from the aromatic fraction and partial mass chromatograms (m/z 178, 192, 202, and 228) in show their distribution was partly dependent on sampling location. Although chrysene is present in all samples, phenanthrene and the methylphenanthrenes is only detected in the Cold Lake bitumen and Amphitheatre Outcrop (A1) sample, whereas pyrene is only present in the Aurora Mine bitumen and Amphitheatre Outcrop (A2) samples. This mixed presence of compounds could be due to biodegradation and water washing leading to the removal of phenanthrene and methylphenanthrenes in some of the Alberta Oil Sands samples (e.g. Forsythe et al. Citation2019). Although the methylphenanthrenes are not consistently found in the Alberta Oil Sands, the similarity in Methylphenanthrene Index (MPI-2) in the Cold Lake bitumen and A1 samples make this ratio useful for identifying other hydrocarbon sources in the surficial sediment. MPI-2 can also be combined with calculated vitrinite reflectance (%Rc) ratio which allows for the determination of the oil/contaminants maturity and oil window (discussed further in Section 4.2).
Figure 5. m/z 178, m/z 192, m/z 202, and m/z 228 ion chromatograms of the polycyclic aromatic hydrocarbons of the Alberta Oil Sands samples. The grey shading highlights the key compounds used to calculate the diagnostic ratios in .
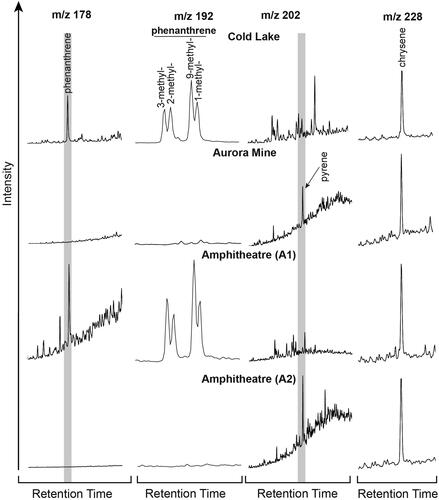
For the purpose of this oil-oil correlation, the absence of naphthalene, methylnaphthalene, and fluoranthene in all of the oil sands samples is particularly useful for identifying alternative sources of hydrocarbons in the surficial sediments. The naphthalenes in particular tend to be present in high abundances in lighter oils, whereas heavy and biodegraded oils, such as the Alberta Oil Sands, contain relatively more of the higher-ring compounds such as fluoranthene and pyrene (Peters et al., Citation2004; Pies et al., Citation2008).
Based on this analysis, and with a particular emphasis on low ranges between Alberta Oil Sands diagnostic ratios, the ratios most consistent and therefore key to Alberta Oil Sands identification can be established. In the sterane series biodegradation appears to have affected several ratios, whereas the St29S/R and St29I/R ratios were most consistent between Alberta Oil Sands samples illustrated by the low ranges and standard deviations in . These two ratios were therefore identified as key indicators of Alberta Oil Sands contamination using the sterane series. More consistent values were calculated for ratios in the terapane series. The Gammacerane Index, 35αβ/34αβ hopane, Ts/(Ts + Tm), 29Ts/C29αβ, Dia/Norm, and C24 Tetra/C30 were all identified as key indicators of Alberta Oil Sands material due to their low ranges and standard deviations between the Alberta Oil Sands samples. In the aromatic fraction, the key indicators identified were TAS C27/C28 (20 R) and C26/C28 (20S) ratios, which proved most consistent amongst the Alberta Oil Sands samples. Whereas the PAHs, such as the MPI-2 ratio and the presence of fluoranthene are useful indicators of other petroleum sources.
4.2. Evaluation of Alberta Oil Sands in sediments
The full range of diagnostic ratios outlined in could then applied to the surficial sediment samples in order to identify Alberta Oil Sands contamination, and assess the suitability of the key ratios identified in the previous section.
All saturated hydrocarbon chromatograms contained long-chain odd-carbon-number n-alkane peaks (Figure SI3 in Supplement), indicative of modern organic debris from plant waxes (e.g. Wang et al. Citation2009). This pattern was expected due to the sampling location and contemporary nature of the surficial sediments. However, a UCM hump was also detected in the bitumen-stained surficial sediment sample R1 and moraine samples M1 and M3 (Figure SI3 in Supplement), which is prominent in the Alberta Oil Sands samples in this study and is not normally associated with recent sources of n-alkanes (Andriashek and Pawlowicz, Citation2002; Peters and Fowler, Citation2002; Yang et al., Citation2011). The presence of a UCM in this case indicates contribution from an oil in the geochemical signature of these samples.
In the sterane series, the m/z 217 and m/z 218 ion chromatograms of samples R1, M2 and M3 show similar patterns to those seen in the Alberta Oil Sands with clearly defined steranes and diasteranes ( and SI5 in Supplement). The ternary diagram of the regular sterane abundance shows all samples plot within the open and shallow marine depositional environment source field (), with almost equal abundance of C27 and C29 steranes detected in samples R1, M2, and M3 ().
Figure 6. m/z 217 and m/z 218 ion chromatograms of the saturated hydrocarbon fractions of the surficial sediment samples showing sterane distributions. The grey shading highlights the key compounds used to calculate the diagnostic ratios in .
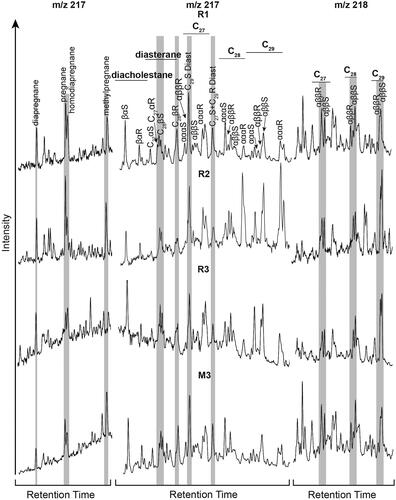
Figure 7. Ternary and cross-plot diagrams of diagnostic ratios from the sterane series using m/z 217 and 218; (a) Ternary diagram of the C27, C28, and C29 regular steranes abundance from the m/z 218 ion chromatogram. Depositional environment interpretational overlay from Integrated Geochemical Interpretation (p:IGI 3.5) software (modified after Huang and Meinschein, Citation1979). (b) Cross-plot of the Preg and DiaSt diagnostic ratios from the m/z 217 ion chromatogram. (c) Cross-plot of the St29S/R and St29I/R diagnostic ratios from the m/z 217 ion chromatogram.
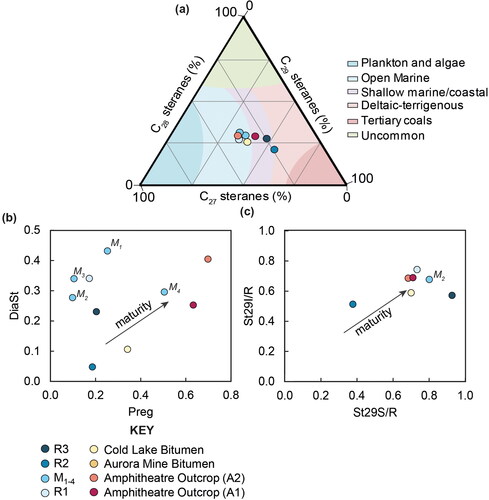
Table 4. Extracted Organic Matter (EOM), selected concentrations, and biomarker and non-biomarker diagnostic ratios from the surficial sediment samples.
Samples R1 and M3 also display a diasterane ratio similar to the Alberta Oil Sands, however, the pregnane ratio is lower than that of the Alberta Oil Sands (). This could be due to another hydrocarbon source of steranes influencing the biomarker signature in these samples, or partial removal of some sterane biomarkers could have occurred due to contemporary biodegradation and weathering such as water washing. Although some variability between both the Alberta Oil Sands samples and surficial sediment samples occurs in the sterane series, using the key diagnostic ratios identified in the previous section, show samples R1 and M2 clustering closer to the Alberta Oil Sands samples in their St29S/R and St29I/R cross-plot.
In the terpane series (m/z 191), all the surficial samples, apart from sample R2, contained gammacerane and 28,30-BNH (as highlighted in ). The Gammacerane Index and 35αβ/34αβ hopane ratios shown in also shows samples R1 and M3 having 35αβ/34αβ hopane values within the same range as the Alberta Oil Sands samples. Clustering of these samples with the Alberta Oil Sands continues in and c with cross-plots of the key diagnostic ratios identified in the previous section. In comparison, although sample R3 contained mature hopane signatures, it plots separately from the Alberta Oil Sands in indicating the presence of another hydrocarbon contaminant. Furthermore, the clear lack of gammacerane and 28,30-BNH in sample R2 provides further evidence to the lack of Alberta Oil Sands contamination in this sample and supports the identification of these compounds as key for determining Alberta Oil Sands contamination.
Figure 8. m/z 191 ion chromatograms of the saturated hydrocarbon fraction of the surficial sediment samples showing the terpane, including hopane, distributions. The grey shading highlights the key compounds used to calculate the diagnostic ratios in .
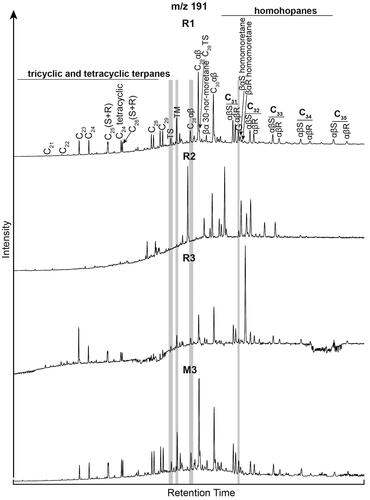
Figure 9. Cross-plot diagrams of diagnostic ratio results from the terpane series using m/z 191; (a) Cross-plot of the 35αβ/34αβ hopane and Gammacerane Index. (b) Cross-plot of the Ts/(Ts + Tm) and 29Ts/C29αβ diagnostic ratios. (c) Cross-plot of the Dia/Norm and C24Tetra/C30αβ Hopane diagnostic ratios.
In the aromatic hydrocarbon series, as with the Alberta Oil Sands samples, the C20 and C21 TAS are also absent in all surficial sediment sample chromatograms (). The full range of monoaromatic steroids (MAS) and TAS are absent from samples R2 and M4 samples ( and SI7). This, combined with an analysis of the saturated hydrocarbon biomarkers indicates that there is no contamination with the Alberta Oil Sands deposits and little contribution from alternative petrogenic or pyrogenic sources in these samples.
Figure 10. m/z 253 and m/z 231 ion chromatograms of the aromatic hydrocarbon fractions of the surficial sediment samples showing aromatic steroid distributions. The grey shading highlights the key compounds used to calculate the diagnostic ratios in .
In assessing the diagnostic ratios, shows clear separability of the surficial sediment from the Alberta Oil Sands samples in the TAS C27/C28 (20 R) and C26/C28 (20S) cross-plot. These differences suggest there is some input from an alternative hydrocarbon source that is contributing to the distribution of TAS in the samples. However, a cross-plot of the TAS/(TAS + MAS) and the C28TAS/C28TAS + C29MAS diagnostic ratios show the surficial sediment samples plotting closer to the Alberta Oil Sands although still with a large amount of scatter. Along with the wide range of values and high standard deviation in the aromatic series diagnostic ratios calculated for the Alberta Oil Sands, the cross-plot analysis here suggests that this series may not be reliable in identifying Alberta Oil Sands contamination without also assessing other biomarker and non-biomarker distributions.
Figure 11. Cross-plot diagrams of diagnostic ratio results from the aromatic steroid series using m/z 253 and 231; (a) Cross-plot of the TAS C27/C28 (20 R) and TAS C26/C28 (20S) diagnostic ratios. (b) Cross-plot of the TAS/(TAS + MAS) and TAS C28/(TAS C28 + MAS C29) diagnostic ratios.
An analysis of the PAHs was used primarily to identify alternative petrogenic (including oil sands, crude oils, and their products) or pyrogenic (incomplete combustion of fossil fuels and contemporary organic matter) hydrocarbon sources in the samples. The surficial sediments R1, R3, M3, and M4 had no detectable naphthalene and methylnaphthalenes, comparable to the Alberta Oil Sands. However, fluoranthene was present in all surficial sediment samples (), which must originate from a different hydrocarbon source. To determine the source of the phenanthrenes (P), methylphenanthrenes (Mp), fluoranthene (Fla), and pyrene (Pyr) in the samples, a cross-plot of Mp/P and Fla/Pyr ratios was created () with all surficial sediment samples plotting within the boundaries of a petrogenic source or a petrogenic and pyrogenic mixture (). Due to the roadside sampling locations, it is likely that these samples could have experienced contamination from road runoff and combustion products influencing the biomarker and non-biomarker diagnostic ratios. This highlights the importance of PAH analysis for oil-oil correlation studies of potentially complex and mixed contamination.
Figure 12. m/z 178, m/z 192, m/z 202, and m/z 228 ion chromatograms of the polycyclic aromatic hydrocarbons of the surficial sediment samples. The grey shading highlights the key compounds used to calculate the diagnostic ratios in .
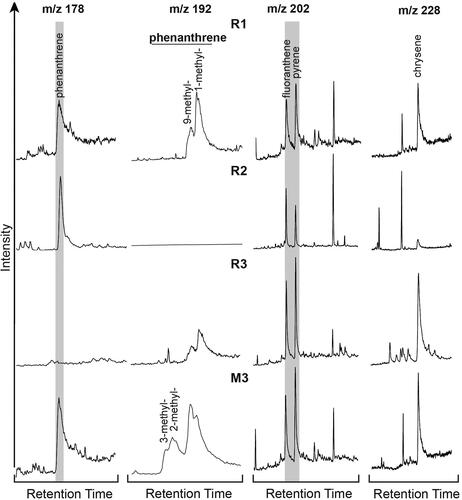
Figure 13. Cross-plots of diagnostic ratios of polycyclic aromatic hydrocarbons using m/z 178, 192, 202, and 228; (a) Mp/P and Fla/Pyr ratios with interpretation overlay adapted from Ahmed et al. (Citation2006). (b) MPI-2 and %Rc ratios with overlay from Esegbue et al. (Citation2020).
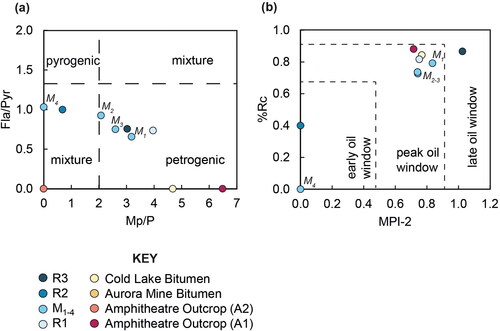
An analysis of the aromatic fraction MPI-2 and %Rc ratios allows for the identification of the contaminants oil window maturity level. The cross-plot in shows a grouping of samples R1, M1, M2, and M3 in the peak oil window field with the Alberta Oil Sands samples. Samples R2 and M4, however, plot outside of the maturity windows indicating limited oil contamination is present in these samples. Whereas sample R3 plots in the late oil window, indicative of the presence of another mature hydrocarbon source other than the Alberta Oil Sands is present in this sample.
Although the PAHs may not be key in identifying Alberta Oil Sands contamination, their use in identifying alternative hydrocarbon sources should not be neglected. As shown here the plotting of both the source and maturity diagnostic ratios from the PAH series has revealed alternative contamination sources in all surficial sediment samples thus highlighting the complicated nature of oil-source fingerprinting in contemporary sediments.
5. Alberta Oil Sands contamination in surficial sediments
5.1. Synthesis of hydrocarbon sources in sediments
Surficial sediment samples R1, M2 and M3 appear to contain Alberta Oil Sands-sourced hydrocarbons, since these samples plot within a similar range to the Alberta Oil Sands in the diagnostic ratio cross-plots (e.g. ). These three samples also had the highest concentrations of gammacerane and 28,30-BNH (0.45–2.3 µg/mg and 0.36–0.65 µg/mg respectively), which supports the diagnostic ratio analysis. As samples M2 and M3 were taken from high on a glacial moraine landform (Figure SI1 in Supplement), it is unlikely that these samples were contaminated by other hydrocarbon spills but are instead Alberta Oil Sands contaminated sediments that have been eroded and mobilised during glaciation.
Due to the presence of tar bands in the sampling pit, sample R1 was anticipated to show a similar geochemical signature to the Alberta Oil Sands. However, as it is located approximately 30 km north-east of Shell’s Scotford Upgrader plant where oil sands bitumen is processed, it is possible that emissions from the plant could have contributed to the contamination signature in this particular sample. The presence of an alternative contamination source in sample R1 is also illustrated in , and in the presence of fluoranthene in the sample (). However, as bitumen tar balls were identified in the sampling pit (Figure SI1 in Supplement), it is most likely that the predominant signature can be attributed to the presence of raw Alberta Oil Sands material.
Despite being most similar to the Alberta Oil Sands, samples R1, M2 and M3 also display an n-alkane signature indicative of contemporary leaf wax hydrocarbon input (Figure SI3 in Supplement), and contain a peak due to fluoranthene in the m/z 202 chromatograms ( and SI8). This suggests that when sampling sediments from contemporary surficial sediments, contamination by pyrogenic PAHs such as fluoranthene from nearby roads or atmospheric deposition are likely. This finding highlights that n-alkanes alone cannot be used to differentiate hydrocarbon sources, but a small UCM in the n-alkane chromatogram such as that present in the R1 and M3, may indicate the presence of a heavily biodegraded oil such as the Alberta Oil Sands.
A more complex biomarker signature was detected in sample M1, which does not always correlate with the oil sands samples, even though the sample contained a UCM hump and relatively high concentrations of gammacerane and 28,30-BNH (Figure SI4 and ). As this samples was taken from a glacial landform, it is possible that the transport, reworking and deposition of the sediment and the hydrocarbons present could have influenced the geochemical signature. However, this sample also contained naphthalene and methylnaphthalenes, which are typically present in high concentrations in undegraded crude oils, diesel fuels, or diluents but were not seen in the Alberta Oil Sands samples analysed here, or in previous studies (e.g. Wang et al., Citation2006; Yang et al., Citation2011). This suggests sample M1 has been contaminated with a different petrogenic hydrocarbon or possibly multiple hydrocarbon sources post-deposition.
The geochemical signatures of samples R2, R3, and M4 do not show evidence of significant Alberta Oil Sands contamination. In sample R3, there is evidence of hydrocarbon contamination illustrated by the mature sterane signature and the presence of PAHs, but this does not match with the Alberta Oil Sands signature in the diagnostic ratios (). Most importantly, the very low concentrations of key indicator compounds, like gammacerane and 28,30-BNH (0.05 and 0.06 μg/mg respectively), suggests the sample contains mainly an alternative petrogenic or pyrogenic hydrocarbon. In sample R2, neither the two indicator compounds nor the petrogenic compound phytane were detected, and the diagnostic ratios in shows a primarily immature signature in the sterane, hopane, and aromatic steroid ratios. This suggests that the dominant sources of hydrocarbons are biogenic in this sample, with possible petrogenic and pyrogenic input evidenced from the PAH distribution. A lack of Alberta Oil Sands or heavy oils contamination is also the case for sample M4 which lacks aromatic steroids (as well as phenanthrenes), contains low concentration of gammacerane and 28,30-BNH and has low EOM (0.01 mg/g). This suggests potential input of Alberta Oil Sands derived compounds through leaching from the surrounding sediment which have clearer oil sands biomarker signatures.
5.2. Sediment transport and mobilisation
This work has identified geochemical signatures consistent with the Alberta Oil Sands deposits beyond the boundaries of their current known limits and exposures. The location of Alberta Oil Sands material away from these deposits in the north of the province and from depth within the sediment profile, suggests that historic natural sediment transport processes mobilised the oils. This is especially suggestive of the glacial moraine samples from the Cooking Lake area, which showed geochemical similarities to the oil sands that is unlikely to be due to anthropogenic contamination owing to the glacial origin of the deposit. However, variations in the diagnostic ratios were detected at different sampling points in the landform. This could be due to the oil signature being localised to the occurrences of transported Alberta Oil Sands material in the larger landform, meaning some parts of the moraine would comprise of different sediment types with a greater impact of uncontaminated surrounding sediment at some sampling points.
The surficial geology of the sampling locations is predominantly moraine and glaciolacustrine deposits indicating glacial reworking of sediments during the Laurentide glaciation. The different geochemical signatures detected within the moraine sediments suggests that the oil contamination is occurring as isolated deposits much like the tar bands and balls identified by Andriashek and Pawlowicz (Citation2002), Paragon (Citation2006), and Fleming et al. (Citation2012) in northern Alberta. This type of isolated oil deposit was also evident in sample R1, located north of the moraine sample, which displayed a similar geochemical signature to the Alberta Oil Sands, and contained visible bitumen staining as discrete bands in the sampling pit. Due to the geochemical similarity of these samples to the Alberta Oil Sands and their location south of natural exposures and extraction sites it is possible that these deposits have been mobilised by a historic sediment transport mechanism, such as glacial erosion.
An analysis of the diagnostic ratios also shows that contemporary weathering and biological processes that occurred in these sediments post-mobilisation and deposition has clearly affected some of the compound distributions. This is evident in the n-alkane series where high concentrations of oil sands material, such as those samples from the Alberta Oil Sands area, mask any contemporary biogenic n-alkane input. The pregnane diagnostic ratios which are highly sensitive to biodegradation processes will also vary depending on the sampling environment. The presence of other hydrocarbon contaminants was highlighted by the PAHs which showed alternative petrogenic and pyrogenic hydrocarbon signatured in the samples. As some samples were collected from the near surface and close to the roadside (R1-3), it was expected that the sediments will have experienced some form of alternative contamination from road runoff and fuel combustion. This was evidenced by the presence of fluoranthene throughout all surficial and exposure samples.
Combined with the heterogeneity of the Alberta Oil Sands deposits biodegradation signatures, this work highlights the complexities of identifying naturally eroded and deposited oil sands material in potentially heterogenous sediments. Due to the geology and glacial origin of the sediments analysed here, it is most likely that the Alberta Oil Sands signatures originate from naturally eroded and transported oils and not anthropogenic spills and industrial operations. However, using a range of diagnostic ratios that are consistent and therefore indicative of the Alberta Oil Sands material, combined with identifying key compounds that could only occur from other petrogenic and pyrogenic sources, allows for a holistic characterisation of hydrocarbon input in potentially contaminated sediments. It is therefore crucial that when performing an oil-oil correlation analysis multiple biomarkers and diagnostic ratios are utilised to factor for these sensitivities and the presence of multiple contamination sources.
6. Conclusions
Using biomarker and non-biomarker diagnostic ratios, geochemical signatures consistent with Alberta Oil Sands hydrocarbons have been detected in sediments from Central Alberta with previously unknown contamination status. All surficial samples showed complex geochemical signatures with a mixture of biogenic n-alkanes and pyrogenic PAHs. However, it was possible to differentiate samples that contained hydrocarbons from the Alberta Oil Sands and those with biogenic, pyrogenic, or alternative petrogenic sources.
In the Alberta Oil Sands samples, a set of key diagnostic ratios were identified; St29S/R, St29I/R, Gammacerane Index, 35αβ/34αβ hopane, Ts/(Ts +Tm), 29Ts/C29αβ, Dia/Norm, C24 Tetra/C30, MPI-2, TAS C27/C28 (20 R), and C26/C28 (20S). An analysis of these key diagnostic ratios show sediment samples R1, M2, and M3 indicate Alberta Oil Sands contamination due to the presence and high concentrations of gammacerane and 28,30-BNH, and similar biomarker diagnostic ratio values. All three of these samples are found outside of active oil sands extraction areas and indicate historical sediment transport processes, such as glacial erosion and mobilisation. In addition, an alternative petrogenic or pyrogenic hydrocarbon source input was also detected by the presence of PAHs not detected in the Alberta Oil Sands samples. This highlights the complexities of identifying and differentiating different hydrocarbon sources and whether contamination has occurred through natural hydrocarbon seepage or anthropogenic activities. This study provides a set of criteria to determine if sediments from different environments contained hydrocarbons from Alberta Oil Sands. The identification of mobilised oils in surficial sediments in the province is useful for remediation and reclamation activities, as well as understanding the sediment transport processes that mobilise the oil sands deposit.
Supplemental Material
Download MS Word (2.5 MB)Acknowledgements
This research was funded by Northumbria University Research Development Fund. The authors would also like to thank Northumbria University for fieldwork and logistical support and Newcastle University School of Natural and Environmental Sciences for laboratory training and access to analytical facilities.
Data availability statement
The authors confirm that the data supporting the findings of this study are available within the article and its supplementary materials.
Disclosure statement
No potential conflict of interest was reported by the authors.
References
- Adams, J., Riediger, C., Fowler, M., and Larter, S. 2006. Thermal controls on biodegradation around the Peace River tar sands: Paleo-pasteurization to the west. Journal of Geochemical Exploration 89(1–3):1–4.
- Ahmed, A. S., Webster, L., Pollard, P., Davies, I. M., Russell, M., Walsham, P., et al. 2006. The distribution and composition of hydrocarbons in sediments from the Fladen Ground, North Sea, an area of oil production. Journal of Environmental Monitoring: JEM 8(2) :307–316.
- Alberta Energy Regulator/Alberta Geological Survey. 2013. Surficial Geology of Alberta, Generalized Digital Mosaic. Alberta, Canada: Alberta Geological Survey Digital Data 2013-0002. https://open.alberta.ca/opendata/gda-dig_2013_0001.
- Andriashek, L. D. 2018. On the Origin of Oil Sand and Related Bedrock Erratics in Glacial Sediments of Central Alberta. Alberta, Canada: Alberta Energy Regulator/Alberta Geological Survey, AER/AGS Open File Report.
- Andriashek, L. D., and Pawlowicz, J. 2002. Observations of Naturally Occurring Hydrocarbons (Bitumen) in Quaternary Sediments, Athabasca Oil Sands Area and Areas West, Alberta. Alberta, Canada: Alberta Energy and Utilities Board, Alberta Geological Survey.
- Auch, T. 2014. Potential extent of Athabasca oil sands. www.arcgis.com/home/item.html?id=cf6eb687c5394f489ca7321f2dceb4ce.
- Barakat, A. O., Qian, Y., Kim, M., and Kennicutt, M. C. 2002. Compositional changes of aromatic steroid hydrocarbons in naturally weathered oil residues in the Egyptian western desert. Environmental Forensics 3(3–4):219–225.
- Bennett, B., and Jiang, C. 2021. Oil-source and oil-oil correlations and the origin of the heavy oil and bitumen accumulations in Northern Alberta, Canada. Organic Geochemistry 153:104199.
- Bennett, B., and Larter, S. R. 2008. Biodegradation scales: Applications and limitations. Organic Geochemistry 39(8):1222–1228.
- Bennett, B., Jiang, C., and Larter, S. R. 2009. Identification and occurrence of 25-norbenzohopanes in biodegraded bitumen from Palaeozoic carbonates in northern Alberta. Organic Geochemistry 40(6):667–670.
- Brooks, P. W., Fowler, M. G., and Macqueen, R. W. 1988. Biological marker and conventional organic geochemistry of oil sands/heavy oils, Western Canada basin. Organic Geochemistry 12(6):519–538.
- Conly, F. M., Crosley, R. W., and Headley, J. V. 2002. Characterizing sediment sources and natural hydrocarbon inputs in the lower Athabasca River, Canada. Journal of Environmental Engineering and Science 1(3):187–199.
- Curiale, J. A. 2008. Oil-source rock correlations - Limitations and recommendations. Organic Geochemistry 39(8):1150–1161.
- Droppo, I. G., di Cenzo, P., Parrott, J., and Power, J. 2019. The Alberta oil sands eroded bitumen/sediment transitional journey: Influence on sediment transport dynamics, PAH signatures and toxicological effect. The Science of the Total Environment 677:718–731.
- Droppo, I. G., di Cenzo, P., Power, J., Jaskot, C., Chambers, P. A., Alexander, A. C., et al. 2018. Temporal and spatial trends in riverine suspended sediment and associated polycyclic aromatic compounds (PAC) within the Athabasca oil sands region. The Science of the Total Environment 626:1382–1393.
- Esegbue, O., Jones, M. D., van Bergen, P. F., and Kolonic, S. 2020. Quantitative diamondoid analysis indicates oil cosourcing from a deep petroleum system onshore Niger Delta Basin. AAPG Bulletin 104(6):1231–1259.
- Ferguson, A., Solo-Gabriele, H., and Mena, K. 2020. Assessment for oil spill chemicals: Current knowledge, data gaps, and uncertainties addressing human physical health risk. Marine Pollution Bulletin 150:110746.
- Fleming, M., Fleming, I., Headley, J., Du, J., and Peru, K. 2012. Surficial bitumen in the Athabasca oil sands region, Alberta, Canada. International Journal of Mining, Reclamation and Environment 26(2):134–147.
- Forsythe, J. C., Kenyon-Roberts, S., O’Donnell, M., Betancourt, S. S., Masurek, N., Gisolf, A., et al. 2019. Biodegradation and water washing in a spill-fill sequence of oilfields. Fuel 237:707–719.
- Fowler, M. G., and Brooks, P. W. 1987. Organic geochemistry of Western Canada Basin tar sands and heavy oils. 2. Correlation of tar sands using hydrous pyrolysis of asphaltenes. Energy & Fuels 1(6):459–467.
- Fustic, M., Hubbard, S. M., Spencer, R., Smith, D. G., Leckie, D. A., Bennett, B., et al. 2012. Recognition of down-valley translation in tidally influenced meandering fluvial deposits, Athabasca Oil Sands (Cretaceous), Alberta, Canada. Marine and Petroleum Geology 29(1):219–232.
- Headley, J. V., Akre, C., Conly, F. M., Peru, K. M., and Dickson, L. C. 2001. Preliminary characterisation and source assessment of PAHs in tributary sediment of the Athabasca River, Canada. Environmental Forensics 2(4):335–345.
- Hein, F. J., and Cotterill, D. K. 2006. The Athabasca oil sands - A regional geological perspective, Fort McMurray area, Alberta, Canada. Natural Resources Research 15(2):85–102.
- Hein, F. J., Langenberg, C. W., Kidston, C., Berhane, H., Berezniuk, T., and Cotterill, D. K. 2001. A Comprehensive Field Guide for Facies Characterization of the Athabasca Oil Sands, Northeast Alberta. Alberta, Canada: Alberta Energy and Utilities Board/Alberta Geological Survey. EUB Special Report.
- Hoffmann, C. F., and Strausz, O. P. 1986. Bitumen accumulation in Grosmont platform complex, Upper Devonian, Alberta, Canada. AAPG Bulletin 70(9):1113–1128.
- Huang, W.-Y., and Meinschein, W. G. 1979. Sterols as ecological indicators. Geochimica et Cosmochimica Acta 43(5):739–745.
- Hunt, J. M., Philp, R. P., and Kvenvolden, K. A. 2002. Early developments in petroleum geochemistry. Organic Geochemistry 33(9):1025–1052.
- Kelly, E. N., Short, J. W., Schindler, D. W., Hodson, P. V., Ma, M., Kwan, A. K., et al. 2009. Oil sands development contributed polycyclic aromatic hydrocarbon compounds to the Athabasca River and its tributaries. Proceedings of the National Academy of Sciences of the United States of America 106(52):22346–22351.
- Marcano, N., Larter, S., and Mayer, B. 2013. The impact of severe biodegradation on the molecular and stable (C, H, N, S) isotopic compositions of oils in the Alberta Basin, Camada. Organic Geochemistry 59:114–132.
- Meyer, B. M., Overton, E. B., and Turner, R. E. 2014. Oil Source Identification Using Diagnostic Biomarker Ratio Analyses. International Oil Spill Conference Proceedings 2014(1):2064–2073.
- Paragon. 2006. Hydrocarbons in Natural Oil Sands Soils: Field Survey. Fort McMurray, Alberta, Canada: Cumulative Environmental Management Association.
- Parnell, J., Bowden, S., Osinski, G. R., Taylor, C. W., and Lee, P. 2008. The transfer of organic signatures from bedrock to sediment. Chemical Geology 247(1–2):242–252.
- Peters, K. E., and Fowler, M. G. 2002. Applications of petroleum geochemistry to exploration and reservoir management. Organic Geochemistry 33(1):5–36.
- Peters, K. E., Walters, C. C., and Moldowan, J. M. 2004. The Biomarker Guide Volume 1: Biomarkers and Isotopes in the Environment and Human History. 2nd ed. Cambridge: Cambridge University Press.
- Pies, C., Hoffmann, B., Petrowsky, J., Yang, Y., Ternes, T. A., and Hofmann, T. 2008. Characterization and source identification of polycyclic aromatic hydrocarbons (PAHs) in river bank soils. Chemosphere 72(10):1594–1601.
- Pinedo, J., Ibáñez, R., Lijzen, J. P. A., and Irabien, Á. 2013. Assessment of soil pollution based on total petroleum hydrocarbons and individual oil substances. Journal of Environmental Management 130:72–79.
- Rodríguez-Estival, J., and Smits, J. E. G. 2016. Small mammals as sentinels of oil sands related contaminants and health effects in northeastern Alberta, Canada. Ecotoxicology and Environmental Safety 124:285–295.
- Strausz, O. P., Morales-Izquierdo, A., Kazmi, N., Montgomery, D. S., Payzant, J. D., Safarik, I., et al. 2010. Chemical composition of Athabasca bitumen: The saturate fraction. Energy & Fuels 24(9):5053–5072.
- Timoney, K. P., and Lee, P. 2009. Does the Alberta Tar Sands industry pollute? The scientific evidence. The Open Conservation Biology Journal 3:65–81.
- Wang, Z., and Fingas, M. 1995. Differentiation of the source of spilled oil and monitoring of the oil weathering process using gas chromatography-mass spectrometry. Journal of Chromatography A 712(2):321–343. parag
- Wang, Z., Fingas, M., and Sigouin, L. 2000. Characterization and source identification of an unknown spilled oil using fingerprinting techniques by GC-MS and GC-FID. LC GC North America 18(10):1058–1067.
- Wang, Z., Stout, S. A., and Fingas, M. 2006. Forensic fingerprinting of biomarkers for oil spill characterization and source identification. Environmental Forensics 7(2):105–146.
- Wang, Z., Yang, C., Kelly-Hooper, F., Hollebone, B. P., Peng, X., Brown, C. E., et al. 2009. Forensic differentiation of biogenic organic compounds from petroleum hydrocarbons in biogenic and petrogenic compounds cross-contaminated soils and sediments. Journal of Chromatography A 1216(7):1174–1191.
- Wang, Z., Yang, C., Parrott, J. L., Frank, R. A., Yang, Z., Brown, C. E., et al. 2014. Forensic source differentiation of petrogenic, pyrogenic, and biogenic hydrocarbons in Canadian oil sands environmental samples. Journal of Hazardous Materials 271:166–177.
- Yang, C., Wang, Z., Liu, Y., Yang, Z., Li, Y., Shah, K., et al. 2013. Aromatic steroids in crude oils and petroleum products and their applications in forensic oil spill identification. Environmental Forensics 14(4):278–293.
- Yang, C., Wang, Z., Yang, Z., Hollebone, B., Brown, C. E., Landriault, M., et al. 2011. Chemical fingerprints of Alberta Oil Sands and related petroleum products. Environmental Forensics 12(2):173–188.
- Yin, M., and Huang, H. 2020. Quaternary exhumation history of the NE Tibetan Plateau revealed by peculiar distributions of polycyclic aromatic hydrocarbons in core extracts from the Sanhu depression, eastern Qaidam basin. Journal of Quaternary Science 35(7):869–880.