
 ?Mathematical formulae have been encoded as MathML and are displayed in this HTML version using MathJax in order to improve their display. Uncheck the box to turn MathJax off. This feature requires Javascript. Click on a formula to zoom.
Abstract
People living in the rural areas of Suihua City rely mainly on groundwater. Determining the chemical characteristics of groundwater and its impact on human health is very important to support drinking water safety engineering. We conducted a systematic study of water chemistry and human health by using software such as SPSS, SQLEVAL, MapGIS, and other methods such as statistical analysis, correlation analysis, Shukarev analysis, Piper’s trilinear plot analysis, scale factor analysis, and N.L. Nemerow index analysis. It is concluded that the cation in the groundwater is mainly of calcium type, and the anion is of mixed type of chloride, sulfate, and bicarbonate. The four types of water chemistry that account for greater than 10% of the total are 11-A, 4-A, 8-A, and 22-A. The chemical composition of groundwater is mainly controlled by rock weathering; Na+ and K+ come from rock salt and silicate rock; while Ca2+ and Mg2+ mainly come from carbonate rock. Cation Exchange interaction occurs in shallow groundwater. Fe and Mn in groundwater are mainly influenced by geological and lithological factors, while NO3− and F− are mainly influenced by anthropogenic activity. This study is of great significance for the management of healthy drinking water in rural areas of Suihua City.
Introduction
Water is the lifeblood of humanity and the pioneer of industry (Sun et al. Citation2020a, Citation2020b; Tian et al. Citation2020a, Citation2021). Groundwater is accounting for approximately 30% of the global freshwater resources. China’s groundwater resources account for only 31% of the national water resources, but provide drinking water for nearly 70% of the country’s population (Tian et al. Citation2020b; Sun et al. Citation2017, Citation2019). In the natural water cycle, the exchange of water and chemical components occurs simultaneously between groundwater and the atmosphere, hydrosphere and biosphere (Sun et al. Citation2022b; Tian et al. Citation2020c, Citation2020d). Water is a carrier for the migration, dispersion, and enrichment of elements in rocks. Many geological processes cannot be studied without involving the chemical action of groundwater (Sun et al. Citation2021). The chemical characteristics and formation of groundwater are important research topics in the field of hydrogeology, and the conduct of related research is of great importance, especially for the use and management of regional groundwater resources, as well as for the construction and protection of the ecological environment. (Sun et al. Citation2022a; Chen et al. Citation2018; Xiaoqing et al. Citation2019; Honarbakhsh et al. Citation2019). The chemical characteristics of groundwater are determined by the sedimentary environment and sedimentary assemblage characteristics of the provenance and are influenced by natural and human factors (Rotiroti et al. Citation2017; Barthel and Banzhaf Citation2016; Bian et al. Citation2018; Hao et al. Citation2022; Li et al. Citation2012). The value of groundwater as a resource depends not only on its quantity, but also on its quality (Mukherjee and Singh Citation2018; Farooq et al. Citation2018; Palanisamy et al. Citation2019). High quality groundwater is beneficial to human health, but toxic and harmful substances in groundwater are released into the surface environment through various groundwater uses (e.g. water supply, irrigation, aquaculture, etc.) and enter the human body, animals and ecosystems through the drinking water and food chain, endangering human life and environmental health (Kukillaya and Narayanan Citation2014; Luo, Gao, and Zhang Citation2018; Li et al. Citation2018). Scholars at home and abroad used mathematical statistics, Schukalev classification, Pip diagrams, and other technical methods to study the hydrochemical characteristics of groundwater (Chen et al. Citation2021). They used the Nemero index method to analyze groundwater quality. They used correlation analysis and ion proportion coefficient method to understand the formation and evolution of groundwater (Gui, Song, and Lin Citation2017; Xu et al. Citation2022; Wang et al. Citation2019; Beatriz, Rafael, and Marisol Citation2000). Beatriz et al. used principal component analysis to study the temporal evolution of groundwater composition in alluvial aquifers (Pisurga River, Spain) (Tiwari and Singh Citation2014); Tiwari, A.K, etc. conducted hydrogeochemical survey and groundwater quality assessment in Pratapgarh, Uttar Pradesh (Marco et al. Citation2019); Marco et al. conducted a study on the impact of irrigation on groundwater quality and water volume in the Oglio River basin of the northern Italian Po Plain under human improved water conservancy systems (Soma et al. Citation2021); Soma and others used a comprehensive method of determining the main control factors of groundwater chemistry and quality assessment to determine the suitability for different uses in West Simbum, India (Stefania et al. Citation2018); Stefania et al. conducted a study on determining the triggering level of groundwater quality in landfill sites in historically human affected areas (State Administration of Market Supervision and Administration Citation2022). These methods have laid the foundation for this study. Domestic water use in the rural areas of Suihua City relies mainly on drinking groundwater. This study identified the chemical characteristics and genesis of groundwater, which is of great significance for rural drinking water safety.
Materials and Methods
Study Area
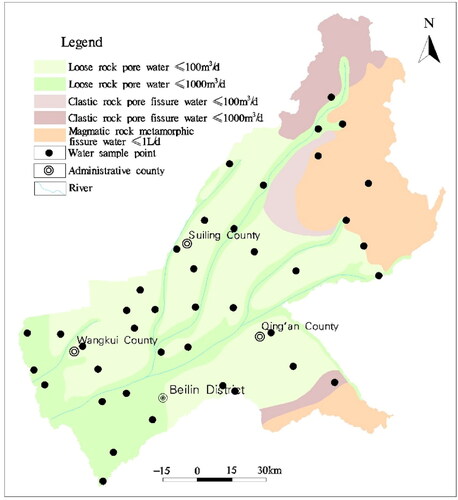
The study area is located in the middle of Heilongjiang Province, China, including Beilin District, Wangkui County, Suiling County, and Qing’an County, with an area of 15,135 km2 and a population of 2.06 × 10⁶, spanning latitude 45° 3′–48° 02′ N, longitude 124° 13′–128° 30′ E. The terrain of the research area is high in the northeast and low in the southwest, transitioning from low hills and high plains to valley plains. The low hill area slopes gently from northeast to southwest, with a slope of 5°–10°; The slightly inclined high plain has a wide and flat terrain, slightly inclined towards the river, with a slope of 3°–5°; The riverine terrace has a wide and flat surface, slightly inclined towards the riverbed, with a slope of less than 3°. High floodplain, which is wide and flat, is mainly distributed on both sides of the river, with an altitude of 155–175 meters; The low floodplain is distributed in strips along both sides of the river, generally 0.5–1 kilometers wide. The land use type is mainly cultivated land, followed by forest and grassland, urban land, industrial and mining land, water area land, wetlands, and gardens. It is a continental climate with four distinct seasons. The average annual temperature is about 2.9 °C, the average annual sunshine time is 2395 h, the average annual precipitation is 552.5 mm, the average annual evaporation is 1337 mm, and the average frost-free period is 140 days. The river network density in the study area is relatively large, belonging to the Songhua River system. Most of its land is in the Hulan River basin, which is the primary tributary of the Songhua River. The average annual total water resources of the city is 44.77 × 10⁸ m3. The stratum in the area mainly exposes Paleozoic carbonate, clastic rock and metamorphic volcanic rock, Mesozoic volcanic rock series, sedimentary rock series, and Quaternary Holocene alluvial-pluvial layer. The main fault in this area is the Hulan River fault, which extends in the northeast direction. According to the occurrence conditions and hydraulic characteristics of groundwater, the groundwater in Suihua can be divided into three categories: Quaternary loose rock pore water, Cretaceous loose rock pore fissure water, and bedrock fissure water. Infiltration recharge of atmospheric precipitation is one of the recharge sources of groundwater. The runoff and discharge of groundwater are mainly affected by the characteristics of aquifers, and then by topography, geomorphology, geological structure, characteristics of aeration zone, and other factors.
Sampling and Measurements
The sampling points are uniformly distributed in the study area, and the sampling time is in August 2022. A total of 40 groups of groundwater samples were collected (). The water samples were collected, stored, and sent in strict accordance with the Technical Specifications for Groundwater Environmental Monitoring (H/164 – 2004).
Figure 1. Distribution of sampling points.
The water sample was analyzed by the laboratory of Harbin Center of Natural Resources Integrated Survey with national testing qualifications. Na+, K+, Ca2+, and Mg2+ were determined by ICP–OES, Cl– and SO42– were determined by ion chromatography (IC), H2SiO3 was determined by ultraviolet spectrophotometry (UV), total dissolved solids (TDS) was determined by gravimetric method (GR), Fe, Mn, and Ni were determined by flame atomic absorption spectrophotometry (FAAS), Cr was determined by catalytic polarography, and HCO3− was determined by volumetric method (VOL).
The spiked recovery method was used to ensure the accuracy and reliability of the analysis method. Each sample was analyzed 12 times, and the average analysis value and spiked recovery rate were calculated. The recovery rate (average of 12 times) of the item for spiked recovery determination should be controlled between 90% and 110%, and the relative standard deviation (RSD%) of 12 analyses of a single standard sample (or spiked recovery sample) should be calculated, with a requirement of RSD% ≤ 15%.
Insert 4 laboratory internal quality control samples and one national standard sample, such as GBW08606, into each batch of samples, and simultaneously analyzed and control accuracy with 5 recovered samples. Strictly follow the requirements of the specifications and control the recovery rate of spiking according to different spiking quantities. Control at 80% to 120%, 90% to 110%, and 95% to 105%, respectively.
The reliability test of water sample data is carried out by using the anion and cation balance test method, and the absolute value of the relative error E of the anion and cation balance is less than 5% as the reliable data. After the test, all data are reliable data.
Data Analysis Methods
This time, SPSS19 software was used to analyze the characteristics and construct a correlation coefficient matrix between the main ions in groundwater. The geographic information system software MapGIS was used to draw the groundwater geochemical map. Groundwater quality was analyzed by using groundwater analysis software SQLEVAL. The Shukalev classification method is used to classify the groundwater types. The method, which is created by Former Soviet scholar Shukalev (C.A Щукалев), is of combined classification based on the relative content of the seven main ions in groundwater (K+ and Na+ are combined and divided into six types).
If the content of a certain ion (milligram equivalent percentage, or depending on the millimole percentage) is ≥25%, participate in the combination naming, and assign a number; Three types of cations (Ca2+, Mg2+, K++ Na+) can be combined in seven ways; Three types of anions (HCO3−, SO42−, Cl−) can also be combined into seven types; The total number of anion and cation recombinations is: 7 × 7 = 49 water types, see .
Table 1. Shukalev classification chart.
Secondly, it is further divided into four groups based on the degree of mineralization (M), namely
A——M ≤ 1.5 g/L,
B——1.5 < M ≤ 10 g/L
C——10 < M ≤ 40 g/L
D——M > 40 g/L
Finally, a classification table of groundwater chemical types is obtained.
The quality standard for groundwater of China is adopted for evaluation (GB/T14848-2017) (General Administration of Quality Supervision, Inspection and Quarantine of the People’s Republic of China Citation2017; WHO Citation1984; Gibbs Citation1970).
For the comprehensive evaluation of groundwater quality, the scoring method is used to evaluate the individual component of the samples, divide the levels of the components, and determine the evaluation score of the individual component respectively according to the standards in , the formula for calculating the F value of comprehensive evaluation score is as follows.
(7)
(7)
where:
is the average value of evaluation score
of each single component.
is the maximum value in the evaluation score
of a single component.
is the number of samples.
Table 2. Quality evaluation and grading of a single component.
Then, according to the F value, the groundwater quality is classified according to the method specified in the standard. See .
Table 3. Classification of comprehensive evaluation of groundwater quality.
Results and Discussion
Analysis of Groundwater Variability
Statistical analysis of groundwater test data in Suihua City showed that the four heavy metal elements Pb, Zn, Cd, and Cu were not detected. The coefficients of variation of the six elements Cr, Ni, As, Hg, Fe, and Mn were all large and in a highly variable state, probably influenced by human activity or changes in stratigraphic lithology. Li, Sr, Zn, Se, free carbon dioxide (CO2), metasilicic acid (H2SiO3), and total dissolved solids (TDS) showed that dissolved total solids (TDS) of some samples meets the mineral water standard (1000 mg/L). The largest coefficient of variation was for Sr and the smallest for metasilicic acid, indicating that each substance is differentiated. Although the coefficients of variation of the cations Li+, Na+ and NH4+ are lower than those of the heavy metals, they all belong to a highly variable state. The coefficients of variation of anions F−, Cl−, NO3−, and SO42− were similar to those of cations. The variation coefficient of pH is the smallest (0.11), belonging to a low degree of variation state; The variation coefficient of total hardness is 0.98, belonging to a highly variable state (, ).
Figure 2. Chemical concentration distribution map of groundwater (pH- dimensionless, other material units: mg/L).
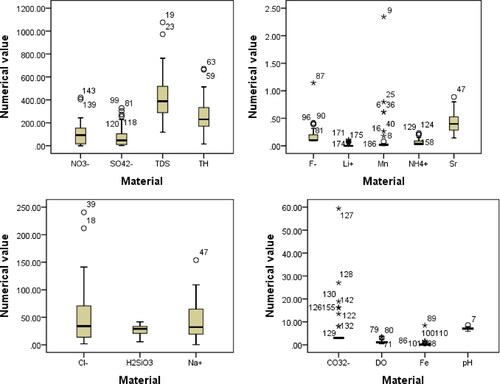
Table 4. Statistical table of various indicators (pH dimensionless, other indicators in mg/L).
Chemical Type of Groundwater
Groundwater chemistry is a spatiotemporal process influenced by natural and human factors. Natural factors include the formation lithology, sediment composition, hydrogeological conditions, and water–rock interactions (such as oxidation and reduction). Human factors include groundwater exploitation, fertilizer use, and biological or microbiological factors.
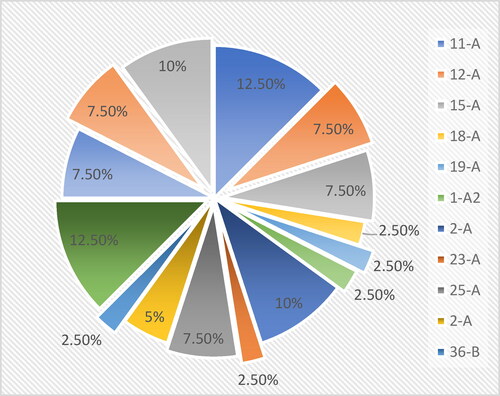
The chemical types of groundwater in Suihua City were classified into 15 categories by using the Shukalev classification method. They are 11-A, 12-A, 15-A, 18-A, 19-A, 1-A, 22-A, 23-A, 25-A, 2-A, 36-B, 4-A, 5-A, 7-A, 8-A, respectively, with samples of 5, 3, 3, 1, 1, 4, 1, 3, 2, 1, 5, 3, 3, and 4, the proportion is shown in .
Figure 3. Proportion diagram of various types of groundwater.
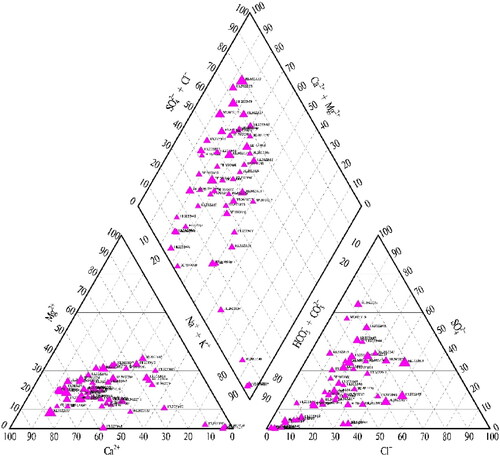
Piper three line diagram, which is first proposed by Piper in 1944, is represented by the percentage per liter milligram equivalent of three main groups of cations (Ca2+, Mg2+, Na++K+) and anions (Cl−, SO42−, HCO3−+CO32−).
To accurately describe the groundwater chemistry of the study area, a Piper diagram was drawn by using MapGIS 6.7 software (). The Piper diagram showed that the cations in groundwater were mainly Ca2+, while the anions were mainly HCO3− and SO42−.
Figure 4. Piper three-line diagram of water chemistry in the study area.
Groundwater Correlation Analysis
Correlation analysis of various chemical indicators was conducted using SPSS software ().
Table 5. Correlation analysis table.
From , it could be seen that at the 0.01 level, total hardness (CaCO3) was significantly correlated with TDS, Mg2+, Ca2+, Cl−, NO3−, SO42−, and NH4+; CO32− and F− were significantly correlated; HCO3− was significantly correlated with TDS, Mn, Mg2+, and Na+; TDS was significantly correlated with Mg2+, Ca2+, Na+, Cl−, NO3−, SO42−; Mn was significantly correlated with Mg2+; Mg2+ was significantly correlated with Mg2+, Na+, Cl−, SO42−, and NH4+; Ca2+ was significantly correlated with Cl−, NO3−, and SO42−; There was a significant correlation between Na+ and SO42−; Cl− is significantly correlated with NO3−, SO42−, and NH4+; There was a significant correlation between SO42−, and NH4+. This indicated that these substances had the same source.
Groundwater Quality Assessment
After calculation, the single index evaluation result of groundwater is shown in .
Figure 5. Water quality accumulation histogram of the single index of groundwater.
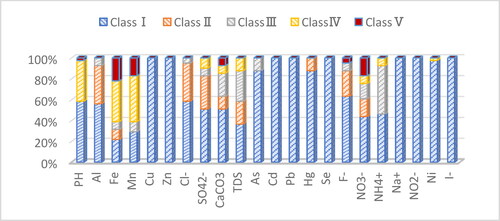
It could be seen from that the single index evaluation of groundwater quality in the study area is generally good, most indicators are in Class I–III, and only six indicators were in Class V, namely Fe, Mn, NO3−, CaCO3, F−, pH. The order and ratio of exceeding the Class V are: Fe (21.95%) > Mn (17.07%) > NO3− (17.06%) > CaCO3 (7.32%) > F− (4.88%) > pH (2.44%); There were four indicators met Class IV, namely TDS, SO42−, NH4+ and Ni. The order and ratio of exceeding the Class IV are TDS (12.20%) > SO42− (9.76%) > NH4+ (7.32%) > Ni (2.44%).
According to the comprehensive evaluation results, the groundwater quality classification map () is prepared.
Figure 6. Spatial distribution of groundwater quality.
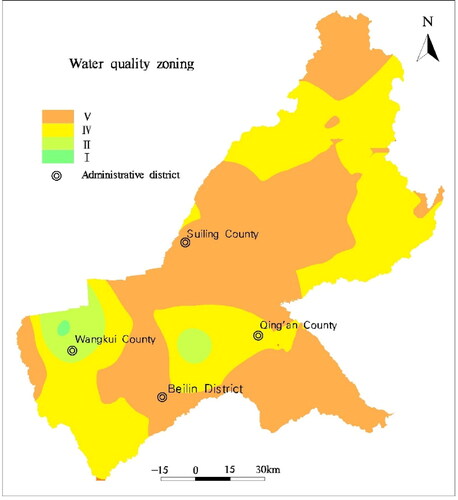
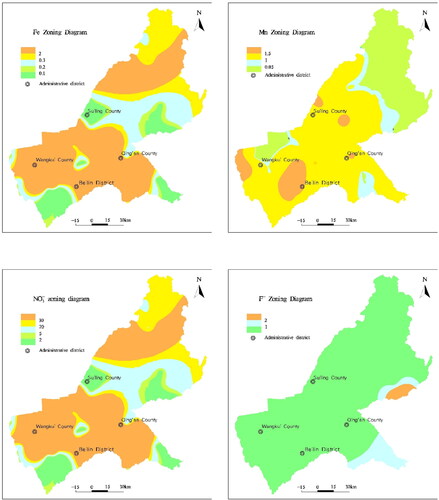
According to the calculation results, the quality of groundwater in the area could be divided into four levels. In general, the quality of groundwater is a concern. Class I, II, IV, and V water accounted for 2%, 5%, 71%, and 22%, respectively. There was no Class III water. Class IV and V water were primary affected by Fe and Mn, which were mainly affected by geology, hydrogeology, and hydro-geochemistry. Additionally, due to the excessive use of pesticides and fertilizers by human activities, especially in agricultural product area, NO3− and F− exceed health standards ().
Figure 7. Distribution diagram of main natural and artificial impact factors.
Gibbs Diagram of Groundwater Genesis
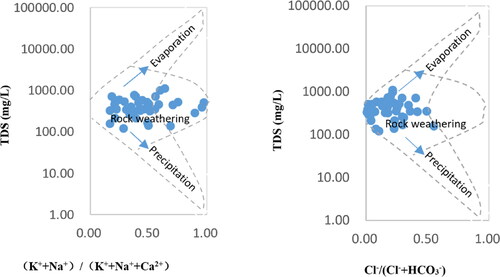
The Gibbs diagram can intuitively evaluate the chemical composition, formation causes, and relationships of groundwater (Gibbs, Citation1970). shows the Gibbs diagram of major ions in Suihua City. The ordinate is the logarithmic coordinate of the total dissolved solids (TDS) mass concentration in groundwater, and the abscissa is the common coordinate, representing the major cations ρ (Na+)/ρ (Na++Ca2+) or major anion ρ (Cl−)/ρ (Cl−+HCO3−) ratio. The Gibbs diagram divides the factors affecting the chemical composition of the groundwater into three regions: the rock weathering zone in the middle left, the evaporation concentration zone in the upper right, and the precipitation impact zone in the lower right. As can be seen from , the chemical components in Suihua City mainly fall in the middle part of the rock weathering zone, which is controlled by rock weathering.
Figure 8. Gibbs diagram of groundwater samples.
Analysis of Proportional Coefficient of Chemical Origin of Groundwater
In the chemical composition of water, the content ratio coefficients between different components are often used to study certain hydrogeochemical problems. Due to significant differences in numerical values of certain ratio coefficients for groundwater formed under different origins or conditions, such coefficients can be used to determine the genesis of groundwater.
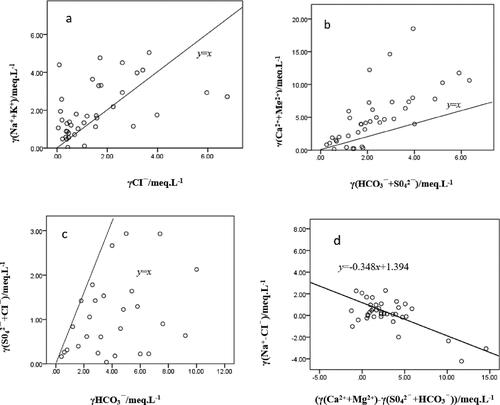
The milligram equivalent ratio relationship between (Na++K+) and Cl− can reflect the source of Na+ and K+. When γ(Na++K+)/γCl− >1, it indicates that the dissolution of rock salt occurs at this time, and when γ(Na++K+)/γCl− <1, it indicates that the dissolution of silicate rock occurs at this time. As can be seen from (a), most of the sampling points in the study area are located on both sides of γ(Na++K+)/γCl-=1, with equal opportunities above and below γ(Na++K+)/γCl-=1. This indicates that both Na+ and K+ in the shallow groundwater in the study area come from the dissolution of rock salt and silicate rock.
The main sources of Ca2+ and Mg2+ in groundwater are from the dissolution of carbonates or silicates and evaporites. Therefore, the milligram equivalent ratio between (Ca2++Mg2+) and (HCO3−+SO42−) can be used to determine the main sources of Ca2+ and Mg2+. When γ(Ca2++Mg2+)/γ(HCO3−+SO42−)>1, Ca2+ and Mg2+ in groundwater are mainly from the dissolution of carbonates. When γ(Ca2++Mg2+)/γ(HCO3−+SO42−)<1, Ca2+ and Mg2+ in groundwater are mainly from the dissolution of silicates and evaporites, as can be seen from , Most of the groundwater sampling points are located above γ(Ca2++Mg2+)/γ(HCO3−+SO42−) = 1, indicating that the Ca2+ and Mg2+ in the shallow groundwater in the study area mainly come from the dissolution of carbonate.
The milligram equivalent ratio of (SO42−+Cl−) to HCO3− reflects the main source of chemical components in groundwater. When γ(SO42−+Cl−)/γHCO3− >1, the chemical components in groundwater mainly come from the dissolution of evaporite, and when γ(SO42−+Cl−)/γHCO3− <1, the chemical components in groundwater mainly come from the dissolution of carbonate. As shown in , except for individual shallow groundwater sampling points located at the upper left of γ(SO42−+Cl−)/γHCO3− = 1, most sampling points are located at the lower right, indicating that carbonate dissolution dominates.
The ratio relationship between γ(Na+–Cl−) and γ(Ca2++Mg2+)–γ(SO42−+HCO3−) can be used to reflect cation exchange. If cation exchange occurs in groundwater, the relationship between γ(Na+–Cl−) and γ(Ca2++Mg2+)–γ(SO42−+HCO3−) will exhibit a negative correlation, with a negative slope. That is, as the Na content increases, the Ca and Mg content decreases. During the dissolution process of minerals, γ(Na+–Cl−) can reflect the increase or decrease of Na content. shows the relationship between γ(Ca2++Mg2+)–γ(SO42−+HCO3−) in different water bodies. The shallow groundwater samples in the study area are distributed around a straight line with a slope of –0.348, and R2 is 0.444, that is, around the straight line y = –0.348x + 1.394. R2 = 0.444 indicates that cation exchange has occurred in the shallow groundwater ().
Figure 9. Correlation diagram of ion ratio of groundwater.
Discussion
Water resources are closely related to people’s lives. Groundwater is an important component of water resources and is important for human beings. As surface water pollution intensifies and is no longer suitable as a drinking water source, people’s dependence on groundwater will continue to rise. The typical problem of groundwater quality in the research area is that iron, manganese, and fluorine are widely distributed, with high content and seriously exceeding standards. Influenced by geology, hydrogeology, and hydrogeochemistry, Fe and Mn in groundwater exceed the standard. Due to human activities, especially the excessive use of pesticides and fertilizers in agricultural production, NO3− and F− concentrations exceed health standards. The long-term intake of excessive iron and manganese in the human body can cause chronic poisoning and induce certain diseases. Agricultural non-point source pollution leads to the continuous accumulation of nitrate and fluoride in groundwater. High nitrate concentrations can cause serious harm to human health. Hypermethemoglobinemia is a health problem caused by high nitrate levels in drinking water. When the nitrate level in newborns is high, cyanosis may occur, which may lead to blueness of the baby’s mucosa, digestive and respiratory diseases, as well as excessive intake of nitrate and cancer. There is a complex relationship between adverse reproductive outcomes and other health issues, and further research is needed in the future. When the fluoride content in drinking water exceeds 4 mg/L, people are prone to fluorosis and bone marrow abnormalities. It is very important to study the source, formation mechanism, and quality status of groundwater pollution to prevent health risks caused by groundwater and water supply safety.
Li et al., in the evaluation of multi-layer groundwater quality in the Hongdunzi coal mine in northwest China (Li et al. Citation2018), Chen et al., in the evaluation of the causes of groundwater salinization in mining cities (Chen et al. Citation2021), Xu et al., in the comparison of hydrogeochemical mechanisms of low sulfate and high sulfate in limestone aquifers of large coal fields in China (Xu et al. Citation2022), analyzed from different perspectives the impact of mining, mineral transportation, and mineral storage on groundwater quality; Xiaoqing et al. (Citation2019), Bian et al. (Citation2018), Marco et al. (Citation2019) all believe that irrigation water will have an impact on the quality and quantity of groundwater in the context of irrigation; Stefania et al., in determining the triggering level of groundwater quality in historically human affected areas of landfill sites (Stefania et al. Citation2018), believed that improper treatment of landfill sites would cause pollution to groundwater. The above researchers have explained the impact of human production and life on groundwater from different aspects such as irrigation, mining, and garbage disposal. There are many aspects of production and living that can cause impacts on groundwater, such as the use of fertilizers, pesticides, etc. in agricultural production, which are all areas worth our attention.
Conclusion
The groundwater in the study area is significantly affected by primary geological processes and human activities; The overall quality of groundwater is poor, with Class IV accounting for 71% and Class V accounting for 22%. The cations in groundwater are mainly Ca, while the anions are a mixture of Cl, HCO3, and SO4; The four hydrochemical types that account for over 10% are 11-A, 4-A, 8-A, and 22-A. From the source analysis, the chemical composition of groundwater is mainly controlled by the weathering of rocks. Na+ and K+ are both derived from the dissolution of rock salt and silicate rocks, Ca2+ and Mg2+ are mainly derived from the dissolution of carbonate, and cations have undergone ion Exchange interaction in shallow groundwater.
Availability of Data and Material
The data and material data provided by the laboratory of Harbin Center of Natural Resources Comprehensive Survey, CGS are reliable.
Author Contributions
Qifa Sun (1966 -), male, senior engineer, doctor, mainly engaged in hydrogeology and environmental geology survey and research. email: [email protected], Mailing address: No. 1, Baojianfu Road, Nangang District, Heilongjiang Province.
Acknowledgements
We thank the editors and reviewers for their constructive comments.
Disclosure statement
No potential conflict of interest was reported by the authors.
Additional information
Funding
References
- Barthel, R., and S. Banzhaf. 2016. “Groundwater and Surface Water Interaction at the Regional-Scale–a Review with Focus on Regional Integrated Models.” Water Resources Management 30 (1): 1–32. https://doi.org/10.1007/s11269-015-1163-z
- Beatriz, H., P. Rafael, and V. Marisol. 2000. “Temporal Evolution of Groundwater Composition in an Alluvial Aquifer (Pisuerga River, Spain) by Principal Component Analysis.” Water Research 34 (3): 807–816.
- Bian, J., S. Nie, R. Wang, H. Wan, and C. Liu. 2018. “Hydrochemical Characteristics and Quality Assessment of Groundwater for Irrigation Use in Central and Eastern Songnen Plain, Northeast China.” Environmental Monitoring and Assessment 190 (7): 382. https://doi.org/10.1007/s10661-018-6774-4
- Chen, H., W. Zhang, H. Gao, and N. Nie. 2018. “Climate Change and Anthropogenic Impacts on Wetland and Agriculture in the Songnen and Sanjiang Plain, Northeast China.” Remote Sensing 10 (3): 356. https://doi.org/10.3390/rs10030356
- Chen, X., C. L. Jiang, L. G. Zheng, L. Q. Zhang, X. J. Fu, S. G. Chen, Y. C. Chen, and J. Hu. 2021. “Evaluating the Genesis and Dominant Processes of Groundwater Salinization by Using Hydrochemistry and Multiple Isotopes in a Mining City.” Environmental Pollution (Barking, Essex: 1987) 283: 117381. https://doi.org/10.1016/j.envpol.2021.117381
- Farooq, S. H., P. Prusty, R. K. Singh, S. Sen, and D. Chandrasekharam. 2018. “Fluoride Contamination of Groundwater and Its Seasonal Variability in Parts of Purulia District, West Bengal, India.” Arabian Journal of Geosciences 11 (22): 709. https://doi.org/10.1007/s12517-018-4062-9
- General Administration of Quality Supervision, Inspection and Quarantine of the People’s Republic of China. 2017. Standard for groundwater quality (GB14848-2017). Beijing.
- Gibbs, R. J. 1970. “Mechanisms Controlling World Water Chemistry.” Science (New York, N.Y.) 170 (3962): 1088–1090. https://doi.org/10.1126/science.170.3962.1088
- Gui, H. R., X. M. Song, and M. L. Lin. 2017. “Waterinrush Mechanism Research Mining above Karst Confined Aquifer and Applications in North China Coalmines.” Arabian Journal of Geosciences 10 (7): 1–9. https://doi.org/10.1007/s12517-017-2965-5
- Hao, C. M., X. M. Sun, B. Xie, and S. L. Hou. 2022. “Increase in Fluoride Concentration in Mine Water in Shandong Mining Area, Northwest China: Insights from Isotopic and Geochemical Signatures.” Ecotoxicology and Environmental Safety 236: 113496. https://doi.org/10.1016/j.ecoenv.2022.113496
- Honarbakhsh, A., A. Azma, F. Nikseresht, M. Mousazadeh, M. Eftekhari, and Y. Ostovari. 2019. “Hydro-Chemical Assessment and GIS-Mapping of Groundwater Quality Parameters in Semi-Arid Regions.” Journal of Water Supply: Research and Technology-Aqua 68 (7): 509–522. https://doi.org/10.2166/aqua.2019.009
- Kukillaya, J. P., and T. Narayanan. 2014. “Role of Weathering of Ferromagnesian Minerals and Surface Water Irrigation in Evolving and Modifying Chemistry of Groundwater in Palakkad District, Kerala, with Special Reference to Its Fluoride Content.” Journal of the Geological Society of India 84 (5): 579–589. https://doi.org/10.1007/s12594-014-0165-4
- Li, P., J. Wu, R. Tian, S. He, X. He, C. Xue, and K. Zhang. 2018. “Geochemistry, Hydraulic Connectivity and Quality Appraisal of Multilayered Groundwater in the Hongdunzi Coal Mine, Northwest China.” Mine Water and the Environment 37 (2): 222–237. https://doi.org/10.1007/s10230-017-0507-8
- Li, S. J., X. J. Wang, J. Zhou, X. M. Tang, and Z. T. Wang. 2012. “Distribution Law of High Fluoride Groundwater in Quaternary in Daxing District of Beijing.” Geoscience 26 (2): 407–414. (in Chinese).
- Luo, W. T., X. B. Gao, and X. Zhang. 2018. “Geochemical Processes Controlling the Groundwater Chemistry and Fluoride Contamination in the Yuncheng Basin, China-an Area with Complex Hydrogeochemical Conditions.” PLoS One 13 (7): e0199082. https://doi.org/10.1371/journal.pone.0199082
- Marco, R., B. Tullia, S. Elisa, M. M. John, A. S. Gennaro, Z. Chiara, T. Sara, et al. 2019. “The Effects of Irrigation on Groundwater Quality and Quantity in a Human-Modified Hydro-System: The Oglio River Basin, Po Plain, Northern Italy.” Science of the Total Environment 672: 342–356.
- Mukherjee, I., and U. K. Singh. 2018. “Groundwater Fluoride Contamination, Probable Release, and Containment Mechanisms: A Review on Indian Context.” Environmental Geochemistry and Health 40 (6): 2259–2301. https://doi.org/10.1007/s10653-018-0096-x
- Palanisamy, A., D. Karunanidhi, T. Subramani, K. Srinivasamoorthy, and B. Anand. 2019. “Geochemical Evaluation of Fluoride Contamination in Groundwater from Shanmuganadhi River Basin, South India: Implication on Human Health.” Environmental Geochemistry and Health 42 (7): 1937–1967.
- Rotiroti, M., T. Bonomi, L. Fumagalli, C. Zanotti, S. Taviani, G. A. Stefania, and B. Leoni. 2017. Hydrochemical Characterization of Groundwater and Surface Water Supported by Multivariate Statistical Analysis: A Case Study in the Po Plain (in Italy). Flowpath 3rd National Meeting on Hydrogeology 2017, held in Cagliari, 14-16 June 2017.
- Soma, G., K. T. Ashwani, K. M. Mukesh, and K. S. Abhay. 2021. “Integrated Approaches to Identify the Major Controlling Factors of Groundwater Chemistry and Quality Assessment for Suitability of Different Uses in West Singhbhum, India.” Environmental Earth Sciences 80 (22): 1–14. https://doi.org/10.1007/s12665-021-09981-0
- State Administration of Market Supervision and Administration. 2022. Standard for drinking water (GB5749-2022). Beijing.
- Stefania, G. A., C. Zanotti, T. Bonomi, L. Fumagalli, and M. Rotiroti. 2018. “Determination of Trigger Levels for Groundwater Quality in Landfills Located in Historically Human-Impacted Areas.” Waste Management (New York, N.Y.) 75: 400–406. https://doi.org/10.1016/j.wasman.2018.01.043
- Sun, Q. F., H. Tian, X. D. Guo, and H. M. Yu. 2019. “Strontium-Enriched Areas Discovered in Lianhuashan, Changchun.” Geology in China 46: 430. (in Chinese with English abstract).
- Sun, Q. F., H. Tian, X. D. Guo, H. M. Yu, S. M. Ma, and L. J. Li. 2017. “The Discovery of Silicic Acid and Strontium Enrichment Areas in Groundwater of Changchun Area, Jilin Province.” Geology in China 44: 1031. (in Chinese with English abstract).
- Sun, Q. F., K. Yang, Z. A. Sun, L. G. Jia, H. Tian, X. D. Guo, X. G. Li, and W. Zhu. 2022a. “Characteristics of Groundwater Quality in Changchun New Area and Its Evaluation on Ecological Health.” Geology in China 49: 834. (in Chinese with English abstract).
- Sun, Q. F., L. G. Jia, H. Tian, X. G. Li, X. D. Guo, H. M. Yu, and W. Zhu. 2020a. “Chemical Characteristics and Genesis Analysis of the Groundwater in Lianhuashan Area, Changchun City.” Geology and Resources 29: 476. (in Chinese with English abstract).
- Sun, Q. F., L. G. Jia, Z. A. Sun, W. G. Xing, G. J. Hao, H. Tian, and X. G. Li. 2022b. “Characteristics and Applicability of Groundwater Quality in Oroqen Qi, Inner Mongolia.” Geology and Resources 31: 88. (in Chinese with English abstract).
- Sun, Q. F., Z. A. Sun, H. Tian, X. D. Guo, H. M. Yu, X. G. Li, and X. Li. 2020b. “Dynamic Characteristics and Difference Analysis of the Groundwater in Changchun New District.” Geology and Resources 29: 369. (in Chinese with English abstract).
- Sun, Q. F., Z. A. Sun, L. G. Jia, H. Tian, X. D. Guo, X. G. Li, and W. Zhu. 2021. “A Study of Groundwater Characteristics in the Songhua River Basin of China.” Arabian Journal of Geosciences 14 (9): 788. https://doi.org/10.1007/s12517-021-07083-6
- Tian, H., J. Z. Du, Q. F. Sun, Q. Liu, Z. Kang, and H. T. Jin. 2020a. “Using the Water Quality Index (WQI), and the Synthetic Pollution Index (SPI) to Evaluate the Groundwater Quality for Drinking Purpose in Hailun, China.” Sains Malaysiana 49 (10): 2383–2401. https://doi.org/10.17576/jsm-2020-4910-05
- Tian, H., Q. F. Sun, Z. Kang, X. G. Li, J. Z. Du, and H. T. Jin. 2020b. “Groundwater Chemistry and Health Risks Associated with Nitrate Intake in Hailun.” Northeast China.Journal of Water and Health 18: 1033.
- Tian, H., X. J. Liang, Q. F. Sun, Q. Liu, Z. Kang, and Y. Gong. 2021. “Evaluation of Drinking Water Quality Using the Water Quality Index (WQI), the Synthetic Pollution Index (SPI) and Spatial Tools in Lianhuashan District, China.” Polish Journal of Environmental Studies 30: 141.
- Tian, H., X. J. Liang, Y. Gong, L. L. Qi, Q. Liu, Z. Kang, Q. F. Sun, and H. T. Jin. 2020c. “Health Risk Assessment of Nitrate Pollution in Shallow Groundwater: A Case Study in China.” Polish Journal of Environmental Studies 29 (1): 827–839. https://doi.org/10.15244/pjoes/104361
- Tian, H., X. J. Liang, Y. Gong, S. M. Ma, Z. Kang, Q. F. Sun, and H. T. Jin. 2020d. “Risk Assessment of Metals from Shallow Groundwater in Lianhuashan District, China.” La Houille Blanche 106 (1): 5–15. https://doi.org/10.1051/lhb/2019063
- Tiwari, A. K., and A. K. Singh. 2014. “Hydrogeochemical Investigation and Groundwater Quality Assessment of Pratapgarh District, Uttar Pradesh.” Journal of the Geological Society of India 83 (3): 329–343. https://doi.org/10.1007/s12594-014-0045-y
- Wang, M. C., H. R. Gui, R. J. Hu, H. H. Zhao, J. Li, H. Yu, and H. X. Fang. 2019. “Hydrogeochemical Characteristics and Water Quality Evaluation of Carboniferous Taiyuan Formation Limestone Water in Sulin Mining Area in Northern Anhui, China.” International Journal of Environmental Research and Public Health 16 (14): 2512. https://doi.org/10.3390/ijerph16142512
- WHO. 1984. Guidelines for Drinking-Water Quality. 2nd ed. Geneva: World Health Organization. 1–15.
- Xiaoqing, S., B. Jianmin, Z. Chunpeng, W. Yu, W. Hanli, and J. Zhuo. 2019. “Hydrochemistry Characteristics and Water Quality Assessment for Irrigation along the Second Songhua River in the South of the Songnen Plain, Northeast China.” Polish Journal of Environmental Studies 29 (1): 371–395. https://doi.org/10.15244/pjoes/103029
- Xu, J. Y., H. R. Gui, C. F. Wu, Y. Guo, J. Li, C. Li, and J. Y. Chen. 2022. “Hydrogeochemistry Mechanism Contrasts between Low and High Sulfate in Limestone Aquifers at the Massive Coalfield in Anhui Province, China.” Water Supply 22 (8): 6978–6993. https://doi.org/10.2166/ws.2022.265