
Abstract
Occupational exposure to indium compound particles has recently been associated with lung disease among workers in the indium–tin oxide (ITO) industry. Previous studies suggested that excessive alveolar surfactant and reactive oxygen species (ROS) may play a role in the development of pulmonary lesions following exposure to indium compounds. However, toxicity at the cellular level has not been comprehensively evaluated. Thus, the aim of this study was to assess which, if any, compounds encountered during ITO production are toxic to cultured cells and ultimately contribute to the pathogenesis of indium lung disease. The compounds used in this study were collected from eight different processing stages at an ITO production facility. Enhanced dark field imaging showed 5 of the compounds significantly associated with cells within 1 h, suggesting that cellular reactions to the compound particles may be occurring rapidly. To examine the potential cytotoxic effects of these associations, ROS generation, cell viability, and apoptosis were evaluated following exposures in RAW 264.7 mouse monocyte macrophage and BEAS-2B human bronchial epithelial cell lines. Both exhibited reduced viability with exposures, while apoptosis only occurred in RAW 264.7 cells. Our results suggested that excessive ROS production is likely not the predominant mechanism underlying indium-induced lung disease. However, the effects on cell viability reveal that several of the compounds are cytotoxic, and therefore, exposures need to be carefully monitored in the industrial setting.
Production of indium–tin oxide (ITO) is a relatively new and growing industry. During the last decade, the demand for indium compounds such as indium hydroxide, indium oxide, and indium–tin oxide has rapidly increased as they have been used to make transparent conductive coatings for touch-screen phones, televisions with liquid crystal displays (LCD), and solar panels. ITO is synthesized by mixing indium oxide and tin oxide in a 90:10 ratio (w:w), then melding the materials through a process called sintering. This method uses high temperatures to combine the two powdered materials into a solid ITO tile that can be used to make the “thin film” coatings (Kim et al., Citation2002; Udawatte and Yanagisawa, Citation2001).
The increased production has resulted in more workers being exposed to indium compounds, which has led to an emerging occupational syndrome termed indium lung disease. Following a case study that determined inhalation of ITO particles as a probable cause of fatal interstitial pneumonia in a worker (Homma et al., Citation2003), multiple studies have since examined the relationship between serum indium levels and lung disease (Chonan et al., Citation2007; Hamaguchi et al., Citation2008; Nakano et al., Citation2009; Cummings et al., Citation2013). However, the underlying mechanisms remain unclear. Studies of indium compounds suggested that reactive oxygen species (ROS) generation is an underlying mechanism of indium-mediated toxicity (Lison et al., Citation2009; Liu et al., Citation2012). Lison et al. (Citation2009) found Fenton-like activity in an acellular system with sintered ITO. This finding is not unexpected, given the presence of post-transition metals (indium and tin) in these compounds. Certain metals are capable of producing ROS through various reactions with hydrogen peroxide (H2O2) (Leonard et al., Citation2004; Valko et al., Citation2006; Jomova and Valko, Citation2011; Li et al., Citation2014), and cellular effects of ROS production include damage to proteins, lipids, and DNA. Thus, it was hypothesized that free radical generation may be an initiating component in the pathogenesis of indium lung disease.
In terms of clinical features, ITO-exposed workers displayed symptoms such as cough, dyspnea, and abnormal pulmonary function tests and chest computed tomography (CT) scans (Nakano et al., Citation2009; Cummings et al., Citation2013; Homma et al., Citation2003). The resulting diseases were identified as pulmonary alveolar proteinosis (within 6–14 mo of hire) and fibrotic interstitial lung disease with and without emphysema (within 2–14 yr of hire), based on a comprehensive clinical and epidemiologic analysis of 10 reported cases, including 2 from an ITO production facility in the United States (Cummings et al., Citation2012). Our study utilizes indium compounds collected from this facility at various stages in the ITO production process, from the starting materials to waste generated during the indium reclamation process (). Thus, it was possible to examine both cellular responses to and properties of compound particles that workers are exposed to in this industry. In addition, correlation of these findings with epidemiologic data from ongoing studies at the National Institute for Occupational Safety and Health (NIOSH) was undertaken by determining potential biomarkers to be used in health surveys of current workers at this facility.
FIGURE 1. Flow chart of indium–tin oxide production and sample collection from facility. The numbers indicate the stages in which samples were collected for analysis. “Green bodies” refers to the unsintered compound mixture before it has been fired.
Due to relatively recent emergence and recognition of indium lung disease, the pathogenesis remains to be elucidated. Given the multistep procedure and various mixtures encountered during each step in ITO production, it is also unclear which of the compounds may display toxicity and contribute to the observed diseases. Therefore, this study aimed to determine which, if any, of these compounds are cytotoxic to cultured cells. This effort included examining their ability to generate damaging free radicals and reduce cellular viability, with the ultimate goals of developing a better understanding of the molecular basis underlying an emerging occupational health issue and assisting in the prevention of indium lung disease.
MATERIALS AND METHODS
Indium Compounds
The eight compounds used in this study were collected at a U.S. ITO production facility from containers of feedstock materials or production processes (NIOSH, Citation2012). Previous evaluations showed that workers in the various departments at the ITO facility are exposed to mean respirable dust concentrations in the range of approximately 0.024–0.429L mg/m3, based on personal air sampling monitors (NIOSH, Citation2012, Citation2013). Taking into account these airborne particle concentrations of 0.1 mg/m3 at breathing rate for an 8-h workday, deposition fraction (from an International Commission on Radiological Protection [ICRP] model for conducting airways based on particle sizes), and estimated human lung burden (based on cell culture treatments used in our studies), it was possible to estimate how many years of workplace exposure our doses represent. For cellular exposure experiments, particles were suspended in sterile filtered 1× phosphate-buffered saline (PBS) at various stock concentrations (1 mg/ml–10 mg/ml), vortexed, and diluted into cell culture media at final concentrations of 50 μg/ml or 1 mg/ml. The human lung burden was determined based on the 50-μg/ml dose being approximately 15 μg/cm2 (accounting for well volumes and surface areas) and the estimated surface area of the human airways being approximately 2300 cm2 (Mercer et al., Citation1994).
Therefore:
To determine how many years it would take to reach this amount, the following calculation was performed:
Therefore, the lower dose of 50 μg/ml represents approximately 3 yr of average workplace exposure. Using these same calculations, it was estimated the high dose of 1 mg/ml represents more of a career-long exposure (i.e., approximately 30–65 yr depending on department). Indium compound stocks were prepared fresh for experiments. Equal volumes of 1× phosphate-buffered saline (PBS) were used as control conditions for each experiment, and 1 mM potassium dichromate (Cr(VI)) was used as a positive control for experiments in which intracellular ROS were measured (Ye et al., Citation1999). Crystalline silica (Min-U-Sil 5 μm) was used as a control particle in the MTT and caspase activation assays as silica was shown to be cytotoxic in vitro (Allison et al., Citation1966; Pfau et al., Citation2012; Castranova, Citation2004; Lison et al., Citation2009).
Particle Characterization
Compound particle morphology and size were characterized using field emission scanning electron microscopy (FE-SEM). For each compound, a 0.1% (w/w) suspension was prepared using deionized water, subjected to agitation using a probe tip sonicator for 3 min (delivered energy = 1000 J), diluted to a final concentration of 0.02% (w/w), and 1 ml was passed through a track-etched polycarbonate filter with 0.1 μm pore size (Steriltech Corp., Kent, WA). A section of each filter was imaged at 10K times magnification using a 5-kV accelerating voltage (Hitachi S-4800 FE-SEM, Hitachi High Technologies America, Inc., Dallas, TX). Aerodynamic equivalent particle diameter (Dae) is a key property for characterizing deposition in the respiratory tract. Values of Dae account for differences in particle shape, density, and physical size from a unit density sphere and were calculated from the relationship , where ρp and ρ0 are the densities of the particle and of a unit sphere, respectively, and χ is the shape factor (Hinds, Citation1999).
The density of each compound was determined using a calibrated helium pycnometer (Multipycnometer, Quantachrome Corp., Boynton Beach, FL). A sample of powder was placed in a preweighed 1-cm3 sample cup, dried in an oven at 80°C overnight, and placed in a desiccator to cool. The sample cup with powder was reweighed to 0.1 mg to determine the mass of dry powder. The sample was purged 20 times in the pycnometer by gently passing dry helium across the sample prior to analysis. In total, 25 volume measurements were recorded for each sample. Volume data were normalized by dry sample mass to calculate density.
The Brunauer, Emmett, and Teller (BET) surface area of each compound was measured using nitrogen gas adsorption (Quadrasorb SI, Quantachrome Corp.). For each material, 0.5 to 2 g of powder was placed into a preweighed glass sample cell. The powders were degassed under light vacuum at 200°C for 2 to 4 hrand allowed to cool. A value of 1.62 × 10⁻¹⁹ m2 was used for the molecular cross-sectional area of N2 at 77 K. The BET surface area was calculated from at least 5 adsorption points in the range p/p° = 0.01 to 0.3; measured values were normalized to dry sample mass to calculate specific surface area (SSA), with units of square meters per gram (m2/g). Replicate measurements were made on each sample. The BET surface area is a measure of total powder surface area from both internal pores and external particle surface irregularities. Hence, total BET surface area may not be equivalent to the amount of surface area available for interaction (e.g., particle interaction with a cell membrane likely only involves the external surface area, not internal surface area attributed to pores).
The electrophoretic mobility of each compound was determined using light scattering in an applied electric field and used to calculate zeta potential using the Henry equation. A dilute suspension of each compound was prepared using deionized water and subjected to ultrasonic agitation using a probe tip for 5 min (delivered energy = 2300 J) and an ice-water bath just prior to measurement. The parameters for the 10 mM sodium chloride dispersant used for analyses were: viscosity = 0.891 cP, dielectric constant = 78.6, and Smoluchowski approximation, f(κa) value = 1.5. The pH of the sample dispersions was 8.2 to 8.7 depending upon the compound. All measurements were performed at 25°C using a Malvern Zetasizer Nano ZS90 equipped with a 633-nm laser at a 90° scattering angle. Samples were equilibrated inside the instrument for 2 min, and 5 measurements (60-s delay between measurements), each consisting of 5 runs (2-s delay between runs), were recorded.
Surface chemistry characterization was performed by a commercial lab (Rocky Mountain Laboratories, Golden, CO) to determine the elemental composition and oxidation state information for indium (In) and tin (Sn) in the compound mixtures. X-ray photoelectron spectroscopy (XPS) is an elemental analysis technique that is capable of detecting all elements (except H and He) and has a nominal detection limit of ˜0.1 atom%. Samples were measured at a 90° take-off angle yielding a sampling depth of ˜10 nm. The analysis area was ˜500 μm in diameter. Analyses were performed with a monochromatic Al Kα x-ray source. Charge neutralization of the sample surface was achieved with the use of a low-energy electron flood gun.
The crystalline composition of each powder was characterized using powder x-ray diffraction (EB Scientific Enterprises, Golden, CO). Each powder was compacted into a sample holder without use of a binder and scanned from 2θ = 10° to 100° (scan step = 0.05°, step residence time = 4 s) using a Cu Kα radiation source at a potential of 30 kV and current of 25 mA. Phase identifications were made by comparing diffraction spectra to the International Centre for Diffraction Data Powder Diffraction File and to pertinent literature.
Cell Culture
The adherent mouse monocyte-derived macrophage cell line RAW 264.7 (RAW) and the human bronchial epithelial cell line BEAS-2B were obtained from ATCC (Manassas, VA). RAW cells were cultured in Dulbecco’s modified Eagle’s medium (DMEM) with 2 mM L-glutamine, 10% fetal bovine serum (FBS), and 50 mg/ml penicillin/streptomycin (Invitrogen Life Sciences, Grand Island, NY). RAW cells were selected for these studies because of their potential to react with and engulf particles (Leonard et al., Citation2010; Gwinn et al., Citation2013). BEAS-2B cells were grown in DMEM F12 with 10% FBS and 50 mg/ml penicillin/streptomycin. The inclusion of BEAS-2B bronchial epithelial cells in these analyses is due to the potential role of the lung epithelium in indium lung disease. BEAS-2B cells represent the cellular lining of the airways and therefore would likely encounter inhaled particles. Both cell lines were grown at 37°C in a 5% CO2 incubator. RAW cells were passaged by scraping into medium or PBS, depending on the experiment. BEAS-2B cells were trypsinized prior to reaching 70% confluency by using 0.25% trypsin-EDTA and passage number was kept under 20.
Electron Spin Resonance
To detect and measure short-lived free radical intermediates, electron spin resonance (ESR) spin-trapping was used. To assess whether the indium compounds are capable of producing hydroxyl radicals (•OH) after exposure to H2O2, final concentrations of 10 mg/ml indium compounds, 1 mM H2O2, and 100 mM DMPO spin trap (5,5‘-dimethylpyrroline N-oxide, Sigma Chemical Co., St. Louis, MO) were mixed for 3 min at room temperature and transferred to a quartz flat cell for ESR measurement in a Bruker EMX spectrometer (Bruker Instruments, Inc., Billerica, MA). For each sample, the machine was set to run 10 scans with a 41-s scan time, a receiver gain of 2.5 × 10⁴, a 40-ms time constant, 1 G modulation amplitude, 126.9 mW power, 9.751 frequency, and 3475 ± 100 G magnetic field. Signal intensity from the 1:2:2:1 spectra, which is characteristic of •OH (Halliwell, Citation2007), was used to measure the relative amount of short-lived radicals trapped and is represented as peak height for each sample.
For cellular ESR, final concentrations of 2 × 10⁶ RAW cells/ml, 10 mg/ml indium compounds, and 200 mM DMPO in PBS were mixed, incubated at 37°C for 5 min, and loaded into a flat cell to be scanned as in previous cellular ESR experiments (Leonard et al., Citation2003, Citation2004; Msiska et al., Citation2010; Stefaniak et al., Citation2010). Again, peak heights represent relative levels of trapped hydroxyl radicals.
Enhanced Dark-Field Microscopy
RAW cells were grown to 70% confluency on coverslips and treated with a final concentration of 50 μg/ml indium compounds for 5 min, 1 h, or 3 h. Following treatments, cells were washed thrice with 1× PBS, fixed for 10 min with 10% formalin, and mounted onto ultraclean glass slides (Schott Nexterion, Arlington, VA) with Fluoromount G. Experiments were performed in duplicate, and images of cells were acquired using a CytoViva enhanced dark-field microscopy system (Aetos Technologies, Inc., Auburn, AL) integrated into an Olympus BX41 upright microscope equipped with an Olympus DP73 digital camera (Olympus, Center Valley, PA) to attain images of high-contrast particles (bright spots) against a dark background. To determine percent of cells with associated particles, cells containing one or more colocalized particles (or agglomerates, as one could not distinguish whether they were individual particles) were counted along with the total number of cells in a field, and this was converted to a percentage.
Intracellular Reactive Oxygen Species (DCFH Assay)
RAW cells were grown to 70% confluency in 96-well dishes and treated with the cell-permeable fluorogenic probe DCFH-DA (2′,7′-dichlorodihydrofluorescein diacetate; Cell Biolabs, Inc., San Diego, CA) at a final concentration of 1 mM in serum-free DMEM for 45 min at 37°C. Cells were washed twice with 1× PBS and DMEM was added back to the wells, along with 50 μg/ml indium compounds or 1 m× Cr(VI) as a positive control. Upon ROS production, DCFH-DA is oxidized to form DCF, which is highly fluorescent. The cells were incubated at 37°C for 7 h, and plates were read at 485 nm excitation/530 nm emission each hour to measure any change in fluorescence, indicating ROS production. To ensure the fluorescent signal was due to DCF product and not any autofluorescence that may emit from the indium compounds, separate wells of DMEM and each indium compound were included in the plates, and these readings were subtracted from their respective wells that had treated cells.
Comet Assay
RAW cells were grown to 50% confluency in 24-well plates, treated with or without 50 μg/ml indium compounds or 1 mM Cr(VI) as a positive control for 3 h, washed twice and scraped into 1× PBS, added to glass slides with agarose, then lysed and subjected to electrophoresis according to manufacturer’s instructions (Trevigen, Inc., Gaithersburg, MD). This produces fragmented DNA to migrate out of the nuclear region, forming a comet-like tail, which was labeled with SYBR green (binds double-stranded DNA). Images were acquired using an Olympus AX70 microscope equipped with an Olympus DP73 digital camera (Olympus, Center Valley, PA). Two independent experiments were performed and at least 50 total cell comets per condition (22–29 comets per replicate) were measured for percent DNA in comet heads versus tails. This was calculated by determining the background-corrected fluorescence from the nuclear region of interest in a cell (nuclear ROI) and the total cell fluorescence for a defined region of interest (total cell ROI, including both the nuclear region and the tail). ImageJ software (Schneider et al., Citation2012) was used to measure the “integrated density” (the sum of the values of the pixels in the selection) for regions of interest, and Microsoft Excel was used to calculate the corrected fluorescence values and ratios of nuclear ROI to total cell ROI. The percent DNA in the “tail” was determined by essentially calculating the fraction of fluorescent signal not within the nuclear ROI (100 – [(nuclear ROI/total cell ROI) × 100]), with elevated percentage indicating DNA damage.
MTT Viability Assay
RAW cells were plated at 25,000 cells per well, and BEAS-2B cells were plated at 10,000 cells per well in 96-well dishes, treated with indium compounds or Min-U-Sil (50 μg/ml or 1 mg/ml), and incubated at 37°C for 24 or 48 h. At 4 h prior to the endpoint time, medium was removed and replaced with phenol red- and serum-free minimal essential medium (MEM). Cell-free indium compound blanks were set up at this time (appropriate volumes of MEM plus the indium compound solution). Each well was then treated with 0.5 mg/ml MTT (Invitrogen Life Sciences, Grand Island, NY) for 4 h at 37°C. At 24 or 48 h, 2 volumes DMSO was added to each well and incubated for 10 min at 37°C to solubilize formazan crystals. Each well was pipetted again to mix, and plates were read at 570 nm to measure change in absorbance. Following blanks subtractions, all values were normalized to PBS-treated control wells, which were calculated to represent 100% viability.
Caspase Activation Assay
RAW and BEAS-2B cells were grown to about 50% confluency in 96-well dishes, treated with indium compounds or Min-U-Sil (50 μg/ml or 1 mg/ml), and incubated at 37°C for 24 h. Each well was treated with 5 μM (RAW 264.7 cells) or 10 μM (BEAS-2B) caspase-3/7 green detection substrate (Invitrogen Life Sciences, Grand Island, NY) for 30 min prior to the 24-h time point. Plates were read at 500 nm excitation/530 nm emission to measure change in fluorescence compared to PBS-treated control cells, indicating caspase-3/7 activation and apoptosis. To ensure the fluorescent signal was not due to autofluorescence that may emit from the indium compounds, separate wells of media and each indium compound were included in the plates, and these readings were subtracted from their respective wells that had treated cells.
Statistical Analysis
All data are represented as mean ± standard deviation for each condition. A one-way analysis of variance (ANOVA) with a Tukey post-test was performed using GraphPad Prism 6 software (GraphPad Software, Inc., La Jolla, CA) for each experiment to compare the responses between groups, and statistical significance is shown when p < .05.
RESULTS
Particle Morphology and Characteristics
The eight indium compounds used in this study were collected from various stages of production within an ITO production facility. illustrates the indium compound samples and their respective collection sites. Indium hydroxide (In(OH)3) and indium oxide (In2O3) are from the refinery; tin oxide (SnO2), unsintered ITO (UITO), and sintered ITO (SITO) are from the ITO department; and sintered/unsintered ITO (SUITO), ventilation dust (VD), and reclaim by-product (RB) are from the reclamation department. Besides those starting materials, the other 5 samples are mixtures. Thus, field emission scanning electron microscopy (FE-SEM) was used to examine the structure, shape, and relative sizes of the eight indium compounds (). VD is perhaps the most interesting, due to the irregular, jagged angles of the particles. Further physical characteristics were determined to measure the mean density, surface area, and zeta potential of the compounds (). The physical characteristic studies reveal differences among the 8 samples, but in general, they are approximately 0.2–0.5 μm in physical diameter. The In2O3 particles have the largest range of sizes, with particles up to 2 μm in diameter. The surface chemistry of each sample was determined using x-ray photoelectron spectrometry (XPS) for elemental analysis. The samples containing ITO (UITO, SITO, and SUITO) have 22–26% indium (in the form of indium metal and In2O3) and 2.7–3.3% tin at their surfaces (). The VD and RB samples collected from the reclaim department have less indium (12 and 4.8%, respectively) and tin (0 and 0.1%, respectively) at their surfaces compared to the ITO samples. The starting materials (In(OH)3, In2O3, and SnO2) were crystallographically pure. All ITO materials were crystalline ITO, and the particles from the VD and RB were also highly crystalline materials.
TABLE 1. Summary of Physical Characteristics of Indium Compounds
FIGURE 2. Field emission scanning electron microscopy (FE-SEM) images of the collected indium compounds. Images were acquired at 10,000× magnification using a 5-kV accelerating voltage. Scale bar, 2 μm. Images of the starting materials are not included due to potential trade secret information. SITO, sintered ITO; SUITO, sintered/unsintered ITO; VD, ventilation dust; RB, reclaim by-product.
TABLE 2. Summary of the Relative Elemental Composition and Indium Species on Particle Surfaces as Determined by X-Ray Photoelectron Spectroscopy High-Resolution Analysis
Free Radical Production From Indium Compounds
Due to the electrical conductance and post-transition metal properties of ITO, along with previous data suggesting that it produces ROS (Lison et al., Citation2009), the compounds were each tested for their ability to generate hydroxyl radicals via electron spin resonance (ESR) measurements using spin trapping with DMPO (5,5′-dimethylpyrroline N-oxide). The acellular Fenton-like reactions showed that the only compounds capable of producing significant ESR peaks compared to all the other samples were UITO and VD ().
FIGURE 3. Electron spin resonance measurement of •OH radicals following reaction of indium compounds with H2O2 or cells. (A) A mixture of indium compounds (10 mg/ml), H2O2 (1 mM), and spin trap DMPO (100 mM) in PBS was incubated in test tubes for 3 min at room temperature, and scanned via ESR. Negative controls contained the mixture without compounds (PBS). Signal intensity (peak height) is used to measure the relative amount of hydroxyl radicals. Error bars represent the mean ± SD. Asterisk indicates significant at p < .05 compared to all other treatments. Inset: representative control and VD spectra. (B) The same as in (A), except without H2O2 but including RAW 264.7 cells (2 × 10⁶). Samples were incubated at 37°C for 5 min prior to measurements. Error bars represent the mean ± SD (n = 3). Asterisk indicates significant at p < .05 compared to untreated cells (PBS).
Subsequently it was of interest to determine how exposures to these occupational dusts induce damage at the cellular level, so ESR was also carried out with the compounds incubated for 5 min at 37°C with RAW 264.7 (RAW) cells. The goal was to examine whether these phagocytic inflammatory cells produce free radicals as a quick, oxidative burst reaction to the indium compounds. Compared to PBS-treated control cells, only VD treatment produced significantly greater peaks in the spectra (86 ± 20.9 mm VD vs. 25.3 ± 1.8 mm PBS, mean ± SD) ().
Intracellular ROS Production by Reclaim By-Product
To further explore the influence of indium compounds on ROS production by exposed cells, an intracellular ROS assay was used. Utilizing DCFH-DA (2′,7′-dichlorodihydrofluorescein diacetate) as a fluorescent probe for ROS within cells, it was possible to monitor changes in fluorescence over a time course of 7 h. At 50 μg/ml, indium compound exposures in RAW cells did not generate significant amounts of ROS (). The only significant increase over control cells was with RB treatment at 2 and 6 h, but the difference is minor compared to the Cr(VI) positive control (974 ± 85.9 PBS vs. 1396 ± 128 RB vs. 4730 ± 357.5 Cr(VI), mean ± SD at 6 h).
FIGURE 4. Intracellular ROS production in cells following treatment with indium compounds. (A) RAW 264.7 cells were pretreated with DCFH-DA, exposed to 50 μg/ml indium compounds or 1 mM chromium(VI) as a positive control, and plates were read each hour to measure intracellular ROS. Error bars represent the mean ± SD (n = 6). Asterisk indicates significant at p < .05 compared to control cells (PBS) at that time point. (B) A comet assay was used to examine DNA damage from intracellular ROS. Cells were treated with 50 μg/ml indium compounds or 1 mM chromium(VI) for 3 h, washed and scraped into PBS, added to glass slides with agarose, then lysed and subjected to electrophoresis. SYBR green was added to stain double-stranded DNA. Images were acquired using fluorescence microscopy and a 40× objective. Cell comets were measured by comparing the corrected nuclear region fluorescence to the corrected total cell fluorescence. This was converted to a percentage to indicate DNA damage. Error bars represent the mean ± SD. Asterisk indicates significant at p < .05 compared to untreated cells (PBS). (C) Representative comets. RB; reclaim by-product, Cr(VI); chromium(VI).
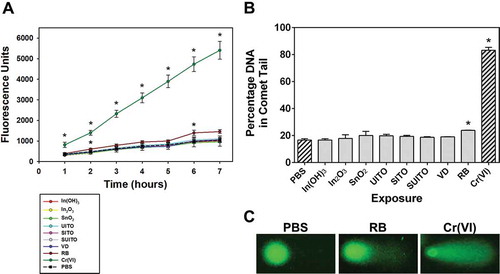
An alkaline comet assay was performed to determine whether indium compound exposures led to oxidative damage to nuclear DNA. The comet assay has long been used to visualize DNA strand breakage as an indicator of genotoxic insult (Ostling and Johanson, Citation1984; Fairbairn et al., Citation1995). Our findings indicated that RAW cells treated for 3 h with 50 μg/ml indium compounds significantly produced DNA damage with RB exposure (). Because the RB treatment also significantly increased intracellular ROS (), it was postulated that DNA damage at 3 h may be due to oxidative strand breaks. When imaging the RB-treated cells, it was observed that not all cells have the same extent of comet “tails” or damage. Rather, there is a heterogeneous response with only a fraction of the cells in a field having pronounced tails (). This accounts for the enhanced mean percentage DNA in tails for this treatment group.
Indium Compound Interactions With RAW 264.7 Cells
Our ROS results indicated there was a measurable amount of cellular free radical production with VD and RB ( and ). Thus, it was postulated that perhaps these particles exhibit stronger associations with, and are engulfed by, the cells. RAW cells interact with and phagocytose particles, since macrophages are the first line of defense in sensing and taking up foreign particles (Aderem and Underhill, Citation1999). Enhanced dark-field microscopy, which removes any unscattered light and illuminates small particles without the need for labeling (De Waele et al., Citation1988), was used to image these interactions. Contrary to our theory of particle-induced ROS production by cell engulfment, the strongest associations with the cells were not the compounds that induced ROS generation (). The images show SnO2 and SITO coating or associating with most, if not all, of the cells in a representative field by 1 h post-exposure (), but these samples did not produce measurable ROS. Interestingly, the In(OH)3, In2O3, and RB samples did not display significant associations over 3 h of exposure compared to PBS controls (). VD appeared to interact with cells, but only in about 50% or fewer, and only a particle or two per cell were observed. A longer treatment of 7 h was imaged as well, but the results were not significantly different from the 3-h treatment (data not shown).
FIGURE 5. Indium compounds associate with RAW 264.7 cells over a time course of treatment. A. Representative images for some of the cell-particle interactions over a 3-h time course. RAW cells were grown on coverslips and treated with 50 μg/ml indium compounds for 5 min, 1 h, or 3 h. Cells were washed three times in PBS, fixed, and mounted onto ultraclean glass slides with Fluoromount G. Experiments were performed in duplicate, and cells were imaged using a CytoViva enhanced dark-field microscopy system and a 60× objective to attain images of high-contrast particles (bright spots) against a dark background. (B) At least 50 cells were counted from 3 fields for each condition and time point. Any particles in the PBS control samples are believed to be silica, due to residual glass pieces on the coverslips. Error bars represent the mean ± SD. Asterisk indicates significant at p < .05 compared to PBS controls; Δ, significant at p < .05 compared to the corresponding 5-min exposure for that treatment. Scale bar, 10 μm.
Indium Compounds Reduce Cell Viability
Due to a relative lack (and low levels) of ROS production by the ITO facility samples, it was of interest to examine other cellular effects following exposures. To test whether the indium compounds are cytotoxic to cells in culture, an MTT (formazan) assay was carried out on RAW and BEAS-2B cells following 24- and 48-h treatments with 50 μg/ml or 1 mg/ml concentrations. Viability of RAW cells at the 50 μg/ml for 24 h showed no marked reduction with any of the treatments. However, at 48 h, SITO significantly reduced viability; 59.8 ± 9.0%, mean ± SD, was noted, which was normalized to represent 100% viability ( and ). Min-U-Sil was used as a control particle and did not reduce RAW cell viability at the same concentration (50 μg/ml), suggesting that this effect is likely due to a specific reaction to these particles versus a particle overload response. Out of all eight compounds, SITO also exerted the greatest impact on cell survival at the higher concentration (1 mg/ml), showing the most dramatic decrease at both time points (18.1 ± 7.0% at 24 h and 8.6 ± 2.6% at 48 h, mean ± SD). The 1-mg/ml concentration at both 24 and 48 h produced decreased viability with many of the other compounds, but was more pronounced at the 48-h time point for UITO, SITO, SUITO, VD, and RB ().
FIGURE 6. Indium compounds reduce cell viability. (A, B) RAW 264.7 cells were treated with indium compounds or Min-U-sil (Si) and incubated at 37° C for 24 h (A) or 48 h (B). MTT was added to wells for the last 4 h, and absorbance was read at 570 nm. All values were normalized to PBS-treated control wells, which were calculated to represent 100% viability. (C, D) The same as in (A) and (B), except with BEAS-2B cells. Error bars represent the mean ± SD (n = 6). Asterisk indicates significant at p < .05 compared to PBS controls.
Following a 24-h treatment, BEAS-2B cells displayed significantly reduced viability with SnO2 and SITO at 50 μg/ml (74.8 ± 6.1% SnO2 and 73.4 ± 1.9% SITO, mean ± SD; ). At 1 mg/ml, most of the compounds reduced viability to about 50% or less compared to control-treated cells. When viability was measured after 48 h, the results essentially resembled 24-h measurements, but with more marked reduction in viability (). This is similar to the findings from the RAW cell exposures, where, in general, there is a time- and concentration-dependent decrease in cell viability with many of the indium compounds.
Indium Compounds Induce Apoptosis in Macrophage Cells
Upon seeing reduced viability in the MTT assay, experiments to determine if cell death was due to apoptosis were undertaken. A series of cysteine proteases known as caspases are activated during programmed cell death, but caspase-3 and caspase-7 are considered executioner caspases that participate in the terminal destruction of the cell (Slee et al., Citation2001; Thornberry and Lazebnik, Citation1998). When caspase-3/7 activation was measured in RAW cells following exposure to indium compounds, several compounds were found to significantly increase over the PBS controls (). At 50 μg/ml, only SITO and VD caused caspase activation, while all but In(OH)3, In2O3, and SnO2 activated caspases-3/7 at the 1 mg/ml dose. Although Min-U-Sil induced significant activation at the high concentrtion, the response appeared to be lower than with some of the indium compounds (i.e., SITO, SUITO, and RB). Data suggest that the responses to these compounds were more specific than merely a particle overload effect that may be induced at this concentration. With the exception of VD at 50 μg/ml, these results correlated with MTT findings in and , such that reduced viability was observed with those compounds that induce caspase-3/7.
FIGURE 7. Caspase activation occurs following indium compound exposure in RAW 264.7 cells but not in BEAS-2B cells. (A) RAW 264.7 cells were treated with indium compounds or Min-U-Sil (Si) for 24 h, 5 μM Caspase-3/7 Green Detection substrate was added, and plates were read at 500 nm excitation/530 nm emission. (B) The same as in (A), except BEAS-2B cells were treated with 10 μM Caspase-3/7 Green Detection substrate. Error bars represent the mean ± SD (n = 6). Asterisk indicates significant at p < .05 compared to PBS controls.
The caspase assay was also performed with BEAS-2B cells following indium compound exposures, and no marked changes in activation compared to PBS control cells were noted (). The experiment was repeated for a longer time point of 48 h, and still there was no marked caspase activation measured (data not shown). These findings suggest that although cell death and reduced viability are evident in these cells, they are not due to apoptosis.
DISCUSSION
The present study aimed to characterize the properties of indium compounds collected from an ITO production facility and to determine whether they induce cytotoxicity when incubated with cultured cells. Depending on the job description, workers in the ITO industry may be exposed to a variety of compounds. Thus, it is necessary to determine which stages of production pose the most risk for disease by studying multiple particle types present in the workplace environment. The characteristic studies reveal differences among the compounds ( and ), but these variances do not clearly predict cytotoxicity. For example, the total indium and tin content at the particle surface did not appear to correlate with capacity to produce ROS, as both VD and RB compounds contain the least of these metals () yet are the only samples with measurable ROS ( and ). This is in contrast to what was expected, as metal ions have long been associated with the potential to induce free radical generation (Valko et al., Citation2006; Jomova and Valko, Citation2011; Leonard et al., Citation2004).
Perhaps the form of indium at the particle surface is important, as both VD and RB contain highly soluble indium salts on their particle surfaces while the other materials do not (). In our lab, dissolution of indium from VD and RB was greater than from In2O3 or any of the other ITO compounds (unpublished data). Therefore, dissolution of indium ions from the surface of particles may be crucial for their ability to generate ROS. Lison et al. (Citation2009) indicated that sintered ITO is capable of producing ROS in the presence of H2O2, but this was not observed in our acellular ESR experiment (). In their investigation, 36 mg/ml of sintered ITO and 80 mM H2O2 were used, which is higher concentrations than used in our study (10 mg/ml SITO, 1 mM H2O2). Thus, the differences in our results are likely due to dissimilar reaction mixture ratios.
A potential explanation for the rapid bursts of hydroxyl radicals produced by VD in the ESR experiments ( and ) may be due to its positive zeta potential (). Studies suggested that particles with positive surface charge are more readily taken up by cells and tend to produce more ROS in phagocytic cells (Bhattacharjee et al., Citation2010). However, since our dark-field images suggest that VD particles do not significantly interact with the RAW cells at early time points, one cannot fully attribute the results to the zeta potential. In addition, this characteristic does not account for the ROS produced by the RB compound, which has a negative zeta potential. However, it is important to note that zeta potential is influenced by the suspension media, and thus the values reported in (using a dilute NaCl solution) may not reflect the actual values in cell culture media because of differences in salt concentrations, presence of proteins, and differences in pH. Due to the significant cellular ROS production by RB (), deleterious intracellular effects may be occurring, such as damage to DNA, proteins, and lipids. The comet assay results indicated that RB particles do induce DNA damage after 3 h of exposure (). At this early time point, this damage is likely oxidative versus the result of apoptosis (Collins et al., Citation2008; Morley et al., Citation2006). Further, RB at this concentration (50 μg/ml) did not induce apoptosis, according to . However, the damage is not a global phenomenon among RB-treated cells, as comet tails were observed in only a fraction of the cellular population. An explanation might be that only a small fraction of the cells have interactions with the particles, which was seen using enhanced dark-field microscopy ().
Cellular associations also do not clearly predict free radical production. Our enhanced dark-field microscopy results showed that greater than 60% of cells interact with SnO2, UITO, SITO, and SUITO by 1 h postexposure (), but these compounds did not produce any measureable ROS when incubated with RAW cells in the assays tested. VD, which led to ROS production, only had significant cell associations after 3 h. Data suggest that most of the indium compounds are engulfed or at least interact at the cell surface within a few hours, and those that highly associate with cells do not necessarily induce cellular ROS production. However, compounds that strongly associate with (and are likely engulfed by) RAW cells appear to produce changes in viability over a longer exposure (24–48 h). This was seen with UITO, SITO, SUITO, and VD in RAW cell exposures ( and ). Interestingly, none of the starting materials (In(OH)3, In2O3, and SnO2) produced changes in RAW cell viability. Based on our findings, a scenario where macrophage cells phagocytose these compounds but are unable to clear them, which may overwhelm their capacity to function and lead to cell death, is postulated. This may explain the caspase activation that was seen at 24 h postexposure in RAW cells (). Macrophage dysfunction and toxicity from particle overload were observed in several previous studies, where cells preloaded with various particles can not perform their phagocytic duty (Lundborg et al., Citation2006; Zhou and Kobzik, Citation2007; Yang et al., Citation2001; Oberdorster, Citation1995) and succumb to toxicity from the engulfed particles (Allison et al., Citation1966; Hiura et al., Citation1999; Li et al., Citation2002).
BEAS-2B cells had reduced viability with all 8 compounds when treatments were carried out to 48 hr (). Data suggest that epithelial cells are more sensitive to the adverse effects of compound exposures compared to the macrophage cell line. Other studies noted similar findings, where pulmonary epithelial cells exhibited greater susceptibility to particle-induced cell death than macrophages (Li et al., Citation2002; Xia et al., Citation2007; Diabaté et al., Citation2002). Our results also indicate that the mechanism of cell death by ITO particles differs among the two cell lines. There was an apoptotic response observed in RAW cells, but reduced BEAS-2B viability did not appear to involve caspase-induced apoptosis and is likely necrotic in nature (). Tanaka et al. (Citation2010) showed that intratracheal instillation of ITO particles in hamsters resulted in significant necrotic debris within alveolar macrophages, which may be a result of necrotic epithelial cell death. Tanaka et al. (Citation2010) also observed localized bronchiolar or alveolar cell hyperplasia with ITO-treated groups indicating pulmonary ITO induced changes in hamster airway epithelium.
SITO exerted the greatest effects on cell death and viability in both RAW and BEAS-2B cells. It is interesting that unsintered (UITO) and sintered ITO (SITO) have similar physical and surface characteristics ( and ), yet SITO was more cytotoxic than UITO at the lower concentration and in both cell lines. Therefore, the process of sintering appears to increase the toxicity of these particles, a phenomenon that has been implicated in other studies of unsintered versus sintered particles (Lison et al., Citation2009; Stefaniak et al., Citation2010). Our findings are also consistent with the results of an in vivo investigation showing that while both In2O3 and SITO exerted pulmonary toxicity, SITO induced histopathological changes at a lower inhalational exposure than did In2O3 (Nagano et al., Citation2011). Such observations may ultimately have implications for protecting workers who use indium compounds.
Although our studies are preliminary, the implications of cell damage and death from indium compound exposures may provide some insight into the pathogenesis of indium-induced lung disease. If epithelial cells are damaged, one can expect disruption of the epithelial barrier, leading to edema and impaired gas exchange. If pulmonary macrophages are injured and cannot perform their normal functions, phagocytosis of pathogens is reduced, leading to increased risk of infections. Furthermore, it is hypothesized that indium lung toxicity results in the accumulation of alveolar surfactant proteins due to macrophage dysfunction (Cummings et al., Citation2012). This is seen in pulmonary alveolar proteinosis, which is one of the main lung diseases seen in workers from the ITO industry (Cummings et al., Citation2010, Citation2012). In addition to the consequences of cell death, it is possible that prior to a loss in viability, release of cytokines, and initiation of an inflammatory response might further damage the epithelium and propagate the disease.
These studies indicate that in general, there is minimal free radical production from the ITO facility samples. Only VD and RB samples produced measurable ROS when incubated with RAW cells, and the results were inconsistent among different methods of measurement (e.g., VD was significant with ESR but not with intracellular ROS or comet assays). However, there appears to be a cytotoxic effect with several of the eight compounds, with SITO compound exerting the greatest effects on cell death and viability. Which cellular pathways and signaling mechanisms are activated prior to toxicity remains to be seen. Therefore, further studies are required to better elucidate these pathways, and results may be used to better predict and monitor indium lung disease in workers within this industry.
DISCLAIMER
The findings and conclusions in this report are those of the authors and do not necessarily represent the views of the National Institute for Occupational Safety and Health.
ACKNOWLEDGMENTS
We thank Katherine Dunnick for her technical help with the free radical assays.
REFERENCES
- Aderem, A., and Underhill, D. M. 1999. Mechanisms of phagocytosis in macrophages. Annu. Rev. Immunol. 17: 593–623.
- Allison, A. C., Harington, J. S., and Birbeck, M. 1966. An examination of the cytotoxic effects of silica on macrophages. J. Exp. Med. 124: 141–154.
- Bhattacharjee, S., de Haan, L. H., Evers, N. M., Jiang, X., Marcelis, A. T., Zuilhof, H., Rietjens, I. M., and Alink, G. M. 2010. Role of surface charge and oxidative stress in cytotoxicity of organic monolayer-coated silicon nanoparticles towards macrophage NR8383 cells. Part. Fibre Toxicol. 7: 25.
- Castranova, V. 2004. Signaling pathways controlling the production of inflammatory mediators in response to crystalline silica exposure: Role of reactive oxygen/nitrogen species. Free Radical Biol. Med. 37: 916–925.
- Chonan, T., Taguchi, O., and Omae, K. 2007. Interstitial pulmonary disorders in indium-processing workers. Eur. Respir. J. 29: 317–324.
- Collins, A. R., Oscoz, A. A., Brunborg, G., Gaivao, I., Giovannelli, L., Kruszewski, M., Smith, C. C., and Stetina, R. 2008. The comet assay: Topical issues. Mutagenesis 23: 143–151.
- Cummings, K. J., Donat, W. E. Ettensohn, D. B., Roggli, V. L., Ingram, P., and Kreiss, K. 2010. Pulmonary alveolar proteinosis in workers at an indium processing facility. Am. J. Respir. Crit. Care Med. 181: 458–464.
- Cummings, K. J., Nakano, M., Omae, K., Takeuchi, K., Chonan, T., Xiao, Y. I., Harley, R. A., Roggli, V. L., Hebisawa, A., Tallaksen, R. J., Trapnell, B. C., Day, G. A., Saito, R., Stanton, M. L.,Suarthana, E., and Kreiss, K. 2012. Indium lung disease. Chest 141: 1512–1521.
- Cummings, K. J., Suarthana, E., Edwards, N., Liang, X., Stanton, M. L., Day, G. A., Saito, R., and Kreiss, K. 2013. Serial evaluations at an indium-tin oxide production facility. Am. J. Ind. Med. 56: 300–307.
- De Waele, M., Renmans, W., Segers, E., Jochmans, K., and Van Camp, B. 1988. Sensitive detection of immunogold-silver staining with darkfield and epi-polarization microscopy. J. Histochem. Cytochem. 36: 679–683.
- Diabaté, S., Mülhopt, S., Paur, H. R., Wottrich, R., and Krug, H. F. 2002. In vitro effects of incinerator fly ash on pulmonary macrophages and epithelial cells. Int. J. Hyg. Environ. Health 204: 323–326.
- Fairbairn, D. W., Olive, P. L., and O’Neill, K. L. 1995. The comet assay: A comprehensive review. Mutat. Res. 339: 37–59.
- Gwinn, W. M., Qu, W., Shines, C. J., Bousquet, R. W., Taylor, G. J., Waalkes, M. P., and Morgan, D. L. 2013. Macrophage solubilization and cytotoxicity of indium-containing particles in vitro. Toxicol. Sci. 135: 414–424.
- Halliwell, B., and Gutteridge, J. M. 2007. Free radicals in biology and medicine, 4th ed. Oxford, UK: Oxford University Press.
- Hamaguchi, T., Omae, K., Takebayashi, T., Kikuchi, Y., Yoshioka, N., Nishiwaki, Y., Tanaka, A., Hirata, M., Taguchi, O., and Chonan, T. 2008. Exposure to hardly soluble indium compounds in ITO production and recycling plants is a new risk for interstitial lung damage. Occup. Environ. Med. 65: 51–55.
- Hinds, W. C. 1999. Uniform particle motion. In Aerosol technology: Properties, behavior, and measurement of airborne particles, chap. 3. Hoboken, NJ: Wiley and Sons.
- Hiura, T. S., Kaszubowski, M. P., Li, N., and Nel, A. E. 1999. Chemicals in diesel exhaust particles generate reactive oxygen radicals and induce apoptosis in macrophages. J. Immunol. 163: 5582–5591.
- Homma, T., Ueno, T., Sekizawa, K., Tanaka, A., and Hirata, M. 2003. Interstitial pneumonia developed in a worker dealing with particles containing indium-tin oxide. J. Occup. Health 45: 137–139.
- Jomova, K., and Valko, M. 2011. Advances in metal-induced oxidative stress and human disease. Toxicology 283: 65–87.
- Kim, B.-C., Lee, J.-H., Kim, J.-J., and Ikegami, T. 2002. Rapid rate sintering of nanocrystalline indium tin oxide ceramics: Particle size effect. Mater. Lett. 52: 114–119.
- Leonard, S. S., Chen, B. T., Stone, S. G., Schwegler-Berry, D., Kenyon, A. J., Frazer, D., and Antonini, J. M. 2010. Comparison of stainless and mild steel welding fumes in generation of reactive oxygen species. Part. Fibre Toxicol. 7: 32.
- Leonard, S. S., Harris, G. K., and Shi, X. 2004. Metal-induced oxidative stress and signal transduction. Free Radical Biol. Med. 37: 1921–1942.
- Leonard, S. S., Roberts, J. R., Antonini, J. M., Castranova, V., and Shi, X. 2004. PbCrO4 mediates cellular responses via reactive oxygen species. Mol Cell Biochem, 255: 171–179.
- Leonard, S. S., Xia, C., Jiang, B. H., Stinefelt, B., Klandorf, H., Harris, G. K., and Shi, X. 2003. Resveratrol scavenges reactive oxygen species and effects radical-induced cellular responses. Biochem. Biophys. Res. Commun. 309: 1017–1026.
- Li, N., Wang, M., Oberley, T. D., Sempf, J. M., and Nel, A. E. 2002. Comparison of the pro-oxidative and proinflammatory effects of organic diesel exhaust particle chemicals in bronchial epithelial cells and macrophages. J. Immunol. 169: 4531–4541.
- Li, S., Wallis, L. K., Ma, H., and Diamond, S. A. 2014. Phototoxicity of TiO2 nanoparticles to a freshwater benthic amphipod: Are benthic systems at risk? Sci. Total Environ. 466–467:800–808.
- Lison, D., Laloy, J., Corazzari, I., Muller, J., Rabolli, V., Panin, N., Huaux, F., Fenoglio, I., and Fubini, B. 2009. Sintered indium-tin-oxide (ITO) particles: A new pneumotoxic entity. Toxicol. Sci. 108: 472–481.
- Liu, H. H., Chen, C. Y., Chen, G. I., Lee, L. H., and Chen, H. L. 2012. Relationship between indium exposure and oxidative damage in workers in indium tin oxide production plants. Int. Arch. Occup. Environ. Health 85: 447–453.
- Lundborg, M., Dahlen, S. E., Johard, U., Gerde, P., Jarstrand, C., Camner, J., and Lastbom, L. 2006. Aggregates of ultrafine particles impair phagocytosis of microorganisms by human alveolar macrophages. Environ. Res. 100: 197–204.
- Mercer, R. R., Russell, M. L., Roggli, V. L., and Crapo, J. D. 1994. Cell number and distribution in human and rat airways. Am. J. Respir. Cell Mol. Biol. 10: 613–624.
- Morley, N., Rapp, A., Dittmar, H., Salter, L., Gould, D., Greulich, K. O., and Curnow, A. 2006. UVA-induced apoptosis studied by the new apo/necro-Comet-assay which distinguishes viable, apoptotic and necrotic cells. Mutagenesis 21: 105–114.
- Msiska, Z., Pacurari, M., Mishra, A., Leonard, S. S., Castranova, V., and Vallyathan, V. 2010. DNA double-strand breaks by asbestos, silica, and titanium dioxide: Possible biomarker of carcinogenic potential? Am. J. Respir. Cell Mol. Biol. 43: 210–219.
- Nagano, K., Nishizawa, T., Eitaki, Y., Ohnishi, M., Noguchi, T., Arito, H., and Fukushima, S. 2011. Pulmonary toxicity in mice by 2- and 13-week inhalation exposures to indium-tin oxide and indium oxide aerosols. J. Occup. Health 53: 234–239.
- Nakano, M., Omae, K., Tanaka, A., Hirata, M., Michikawa, T., Kikuchi, Y., Yoshioka, N., Nishiwaki, Y., and Chonan, T. 2009. Causal relationship between indium compound inhalation and effects on the lungs. J. Occup. Health 51: 513–521.
- National Institute for Occupational Safety and Health. 2012. Hazard evaluation and technical assistance report: An evaluation of preventive measures at an indium-tin oxide production facility. Morgantown, WV: U.S. Department of Health and Human Services, Public Health Service, Centers for Disease Control and Prevention. HETA 2009−0214-3153.
- National Institute for Occupational Safety and Health. 2013. Understanding and preventing indium lung disease: Interim report.
- Oberdorster, G. 1995. Lung particle overload: Implications for occupational exposures to particles. Regul. Toxicol. Pharmacol. 21: 123–135.
- Ostling, O., and Johanson, K. J. 1984. Microelectrophoretic study of radiation-induced DNA damages in individual mammalian cells. Biochem. Biophys. Res. Commun. 123: 291–298.
- Pfau, J. C., Seib, T., Overocker, J., Roe, J., and Ferro, A. S. 2012. Functional expression of system xc− is upregulated by asbestos but not crystalline silica in murine macrophages. Inhal. Toxicol. 24: 476–485.
- Schneider, C. A., Rasband, W. S., and Eliceiri, K. W. 2012. NIH Image to ImageJ: 25 Years of image analysis. Nat. Methods 9: 671–675.
- Slee, E. A., Adrain, C., and Martin, S. J. 2001. Executioner caspase-3, -6, and -7 perform distinct, non-redundant roles during the demolition phase of apoptosis. J. Biol. Chem. 276: 7320–7326.
- Stefaniak, A. B., Harvey, C. J., Bukowski, V. C., and Leonard, S. S. 2010. Comparison of free radical generation by pre- and post-sintered cemented carbide particles. J. Occup. Environ. Hyg. 7: 23–34.
- Tanaka, A., Hirata, M., Homma, T., and Kiyohara, Y. 2010. Chronic pulmonary toxicity study of indium-tin oxide and indium oxide following intratracheal instillations into the lungs of hamsters. J. Occup. Health 52: 14–22.
- Thornberry, N. A., and Lazebnik, Y. 1998. Caspases: Enemies within. Science 281: 1312–1316.
- Udawatte, C. P., and Yanagisawa, K. 2001. Fabrication of low-porosity indium tin oxide ceramics in air from hydrothermally prepared powder. J. Am. Ceramic Soc. 84: 251–253.
- Valko, M., Rhodes, C. J., Moncol, J., Izakovic, M., and Mazur, M. 2006. Free radicals, metals and antioxidants in oxidative stress-induced cancer. Chem. Biol. Interact. 160: 1–40.
- Xia, T., Kovochich, M., Liong, M., Zink, J. I., and Nel, A. E. 2007. Cationic polystyrene nanosphere toxicity depends on cell-specific endocytic and mitochondrial injury pathways. ACS Nano 2: 85–96.
- Yang, H. M., Antonini, J. M., Barger, M. W., Butterworth, L., Roberts, J. R., Ma, J. K., Castranova, V., and Ma, J. Y. 2001. Diesel exhaust particles suppress macrophage function and slow the pulmonary clearance of Listeria monocytogenes in rats. Environ. Health Perspect. 109: 515–521.
- Ye, J., Wang, S., Leonard, S. S., Sun, Y., Butterworth, L., Antonini, J., Ding, M., Rojanasakul, Y., Vallyathan, V., Castranova, V., and Shi, X. 1999. Role of reactive oxygen species and p53 in chromium(VI)-induced apoptosis. J. Biol. Chem. 274: 34974–3480.
- Zhou, H., and Kobzik, L. 2007. Effect of concentrated ambient particles on macrophage phagocytosis and killing of Streptococcus pneumoniae. Am. J. Respir. Cell Mol. Biol. 36: 460–465.