
ABSTRACT
Exposure to fuels continues to be a concern in both military and general populations. The aim of this study was to examine effects of in vivo rat repeated exposures to different types of jet fuel utilizing microelectrode arrays for comparative electrophysiological (EP) measurements in hippocampal slices. Animals were exposed to increasing concentrations of four jet fuels, Jet Propellant (JP)-8, Jet A, JP-5, or synthetic Fischer Tropsch (FT) fuel via whole-body inhalation for 20 d (6 hr/d, 5 d/week for 28 d) and synaptic transmission as well as behavioral performance were assessed. Our behavioral studies indicated no significant changes in behavioral performance in animals exposed to JP-8, Jet A, or JP-5. A significant deviation in learning pattern during the Morris water maze task was observed in rats exposed to the highest concentration of FT (2000 mg/m3). There were also significant differences in the EP profile of hippocampal neurons from animals exposed to JP-8, Jet A, JP-5, or FT compared to control air. However, these differences were not consistent across fuels or dose dependent. As expected, patterns of EP alterations in brain slices from JP-8 and Jet A exposures were more similar compared to those from JP-5 and FT. Further longitudinal investigations are needed to determine if these EP effects are transient or persistent. Such studies may dictate if and how one may use EP measurements to indicate potential susceptibility to neurological impairments, particularly those that result from inhalation exposure to chemicals or mixtures.
Introduction
Jet fuels are employed abundantly in both the military and the commercial settings. As such, the effects of exposure to these complex mixtures continue to raise concerns. Several investigators examined the potential adverse health effects of jet fuel exposure (Porter Citation1990; Proctor et al. Citation2011; Smith et al. Citation1997; Tu et al. Citation2004). Occupational exposure limits (OELs) were developed for various jet fuel(s) in military populations. Currently, the OEL is set at 200 mg/m3 aerosol and vapor for Jet Propellant (JP)-8 (Mattie and Sterner Citation2011). However, unusual circumstances may lead to unintended exposure of military personnel to concentrations of jet fuel that exceed the OEL.
JP-8 is a kerosene-type jet fuel widely used by the U.S. Air Force, Army, and Navy. Jet A, which is virtually identical to JP-8, is currently used for commercial aircraft and may likely replace JP-8 in military operations in the future. The U.S. Navy also uses JP-5, similar to JP-8 in composition but possesses a higher flash point, which provides an additional layer of safety in fuel handling on aircraft carriers. Main components of JP-8, Jet A, and JP-5 are aliphatic and aromatic hydrocarbons (Risher et al. Citation2017; ). Jet A is the base fuel used for the production of JP-8 and JP-5. Typical additives to JP-8 and JP-5 include antioxidants, static inhibitors, corrosion inhibitors, fuel system icing inhibitors, lubrication improvers, biocides, and thermal stability improvers. Fischer Tropsch (FT) is a kerosene-type fuel similar to JP-8 and JP-5 but contains only trace amount (<1%) of aromatic compounds and produced from alternative energy resources (Lamprecht Citation2007) (). There is a great deal of interest by the U.S. Department of Defense (DoD) in jet fuels derived from alternative energy mainly because their use might reduce our dependence on import of crude oil from foreign sources.
Table 1. Jet Fuel Constituents for Jet A, JP-8, JP-5, and FT. Analysis Was Performed Using the Striebich et al. (Citation2014) Method. All Values Are in % by Weight
There are several toxicity studies on JP-8, JP-5, and Jet A using rats, assessing fuel influence on multiple physiological systems including respiratory, cardiovascular, gastrointestinal, hepatic, renal, and hematopoietic systems, as well as weight changes, all of which are comprehensively summarized in a publication entitled Toxicological Profile for JP-5, JP-8, and Jet A Fuels, furnished by the U.S. Department of Health and Human Services of the Agency for Toxic Substances and Disease Registry (Risher et al. Citation2017). The most recent update was posted as March 2017, and publication can be freely accessed online at https://www.atsdr.cdc.gov/toxprofiles/tp121.pdf. The no-observed-adverse-effect levels (NOAELs) for JP-8 and JP-5 inhalational exposures of 24 hr/d for 90 d in Fischer-344 (F344) rats were determined to be at 1000 and 750 mg/m3, respectively (Gaworski, MacEwen, and Vernot Citation1984, Citation1985; Mattie, Alden, and Newell Citation1991; Risher et al. Citation2017). Previously, a 14-d inhalational exposure of Jet A (4 hr/d, 5 d per week) on female F344 and Sprague Dawley rats found an NOAEL of 1980 mg/m3 (Risher et al. Citation2017; Sweeney, Prues, and Reboulet Citation2013). A 90-d inhalational FT exposure study at 6 hr/d, 5 d per week, revealed few adverse clinical observations such as decreased weight gain and scaly skin in the high exposure group (2000 mg/m3) that were not dose–response related (Mattie et al. 2011b).
Studies on military and civilian personnel with occupational exposures to jet fuels revealed that there may be some adverse effects on the nervous system. Reports in the late 1970s documented cases of self-reported symptoms that included neurasthenia, dizziness, depression, headache, and memory impairment among personnel chronically exposed to the European military jet fuels MC 75 and MC 77 (Knave et al. Citation1976). Later investigations also reported neurophysiological symptoms due to JP-5 or JP-8 exposures. Two aviators suffered from burning eyes, poor coordination, and memory deficits due to intoxication by JP-5 fuel vapor in the cockpit (Porter Citation1990). Another study noted that chronic low-level exposure to JP-8 led to an increased postural sway response suggesting effects on the vestibular and proprioception systems (Smith et al. Citation1997). Tu et al. (Citation2004) evaluated members of the U.S. Air National Guard for effects of jet fuel exposure and found significant impairments in attention-based tasks and information processing speed attributed to chronic exposure to JP-8. Further, Proctor et al. (Citation2011) in an epidemiology study addressing occupational repeated workday JP-8 exposure among U.S. Air Force personnel suggested significant differences on total recall, delayed recall, and retention tasks in a certain age group. Taking these observations into account and widespread use of jet fuel in a multitude of military settings, ongoing vigilance for potential indicators of neurological effects is necessary in protecting service members.
In order to address these concerns, a series of animal studies that focused on jet fuel-induced nervous system effects were conducted. The NOAELs of JP-5 and JP-8, when neurological effects were examined, were reported as 750 mg/m3 for JP-5 based upon histology assessment of the brain and sciatic nerve (Gaworski, MacEwen, and Vernot Citation1984, Citation1985; Risher et al. Citation2017) and 1500 mg/m3 for JP-8 based upon assessment of auditory function (Fechter et al. Citation2012; Risher et al. Citation2017). However, later investigators found that utilizing electrophysiology on the auditory system the presence of small effects of JP-8 with a low-observed-adverse-effect level of 1000 mg/m3 was detected (Guthrie et al. Citation2015, Citation2014; Risher et al. Citation2017). Neurobehavioral studies performed in rats exposed to 1000–2000 mg/m3 of JP-5 or JP-8 revealed behavioral response alterations (Baldwin et al. Citation2007; Rossi, Nordholm, and Carpenter Citation2001). Data indicated that there may be subtle differences of neurological effects between JP-5 and JP-8. Exposures to JP-5 over a 6-week period (6 hr/d, 5 d/week) at 1200 mg/m3 produced a change only in forelimb grip strength, whereas similar exposures to JP-8 at 1000 mg/m3 only induced alterations in appetitive reinforce approach sensitization (Rossi, Nordholm, and Carpenter Citation2001). Baldwin et al. (Citation2001) noted a rise in central nervous system (CNS) excitability or spontaneous activity in the form of increased rearing behavior and ambulation but no marked changes in muscle tone parameter or motor coordination following a 28-d inhalational JP-8 exposure (1 hr/d, 5 d/week, 1236.8 mg/m3). Neurotoxicity assessments following a 90-d inhalational FT exposure in rats were previously conducted using open field testing and functional observational battery of tests (Mattie et al. Citation2011). A high concentration of FT (2000 mg/m3) was associated with reduction in motor activity (Mattie et al. Citation2011). Further, biochemical assays showed significant alterations in neurotransmitter levels, specifically those of dopamine (DA), serotonin (5-HT), and their metabolites (DOPAC) following JP-8 exposure (Baldwin et al. Citation2007; Rossi, Nordholm, and Carpenter Citation2001). DA and 5-HT are important neurotransmitters that play critical roles in motor coordination, mood regulation, and other cognitive functions (Xu et al. Citation2012). A neurotoxicity assessment in rats due to Jet A inhalational exposures was not apparently found.
Thus far, results from the animal studies cannot yet clearly explain or account for the neurological symptoms observed in military personnel. The primary objective of our study was to determine whether jet fuel exposures induce significant changes in cognition processes such as learning and memory. Based upon previous reports of adverse neurological effect in military personnel who were occupationally exposed to jet fuel (mainly JP-8), our initial hypothesis was that there may be some cognitive impairment initiated by each of the four fuels at the highest concentrations. To assess cognitive function, the Morris water maze (MWM) testing was used and spatial learning and memory compared between control and treated.
The hippocampus is a critical region of the brain that has been correlated with cognition, especially spatial learning and memory (Muller et al. 1996; Konishi et al. 2017). Thus, our secondary objective was to investigate the suitability of an electrophysiological (EP) method using hippocampal slices for neurotoxicity assessments obtained from in vivo whole animal exposures to JP-8, Jet A, JP-5, or FT and determine whether findings might be utilized to indicate adverse neurological effects. The fuels selected were JP-8, JP-5, and Jet A which are currently used by DoD and the civilian population, whereas FT fuel is predominantly devoid of aromatic hydrocarbons and is the only synthetic fuel in which some adverse neurological effects were significantly detected (Mattie et al. Citation2011). Although electrophysiology techniques have been widely used in medical research, these are rarely employed in a neurotoxicology assessment, especially when combined together with in vivo whole animal exposures. Electrophysiology in conjunction with in vivo jet fuel exposures was reported thus far in studies in which only the auditory system was addressed (Guthrie et al. Citation2014, Citation2015). In contrast, electrophysiology in conjunction with in vitro exposures was used in a few studies. In vitro exposures of neuronal cells to JP-8 or Jet A resulted in cellular impairment ability to fire action potentials (Grant et al. Citation2000). However, the cells from this neuronal cell line do not form physiological synapses, making overall assessments not possible. In addition, in vitro incubation with jet fuel does not truly reflect an inhalation exposure scenario.
This investigation characterized the influence of occupational in vivo exposures (20 actual exposure days at 5 d/week, 6 hr/d for 28 d) to increasing concentrations of JP-8, Jet A, JP-5, or FT fuel on rat hippocampal function using MWM behavioral testing in vivo to assess the integrity of spatial learning and memory as well as microelectrode arrays to electrophysiologically assess neuronal function in vitro.
Materials and methods
Study design
The study was approved by the Wright-Patterson Air Force Base Institution Animal Care and Use Committee as protocol number F-WA-2014-0152. The study was conducted in accordance with the Guide for the Care and Use of Laboratory Animals (NRC Citation2011). Overall project was completed within 2 years, in four distinct phases. In Phase 1 through 4, exposures were performed using JP-8 (POSF #11747), Jet A (POSF #4658), FT (POSF #5109), or JP-5 (POSF #12804), respectively, in that precise order. Analyses of fuel constituents were conducted utilizing methods described by Striebich et al. (2014) (). Different batches of F344 rats were purchased from Charles River Laboratories for each study phase. Within each phase, there were a total of four experimental groups consisting of control (0 mg/m3), low (200 mg/m3), medium (1000 mg/m3), and high (2000 mg/m3) groups. Fuel exposures follow an occupational exposure pattern, and thus, animals were exposed for 6 hr/d, 5 d per week for a total of 28 d, assuming no unexpected base closures or holidays, which translate into a total of 20 actual exposure days (not counting weekends). When there were holidays or base closures, duration was prolonged such that there were still 20 actual exposure days. There were 16 animals per experimental group and thus there were a total of 64 animals per study phase. Ten out of 16 animals from each experimental group were bled before initiation of treatments and at completion of exposures for cytokine analysis. In Phase 4 (JP-5), blood was additionally collected within 24 hr after 4 d of exposures and also at 2 weeks after completion of exposures. Those same animals were subjected to MWM testing within 1 week after completion of exposures. The remaining six rats from each experimental groups were used for brain slice electrophysiology, within 24 hr following completion of treatment. Animals were 7–8 weeks at the initiation of exposures. For Phase 1 (JP-8), the average body weight of animal at initiation of exposure was 221 ± 12.7 g. For Phase 2 (Jet A), the mean body weight at initiation of exposure was 222 ± 14.2 g. For Phase 3 (FT), the average body weight was 217 ± 13.8 g. For Phase 4 (JP-5), the mean body weight was 221 ± 13.5 g.
Exposure system description
The same exposure system was employed as described by Sterner et al. (Citation2015). Animals were exposed by inhalation in 1 m3 stainless steel and glass whole body exposure chambers (H1000, Lab Products, Inc., Seaford, DE). One chamber was used per dose group. Each chamber held up to three stainless steel wire mesh cages, and each cage housed up to 16 or 24 rats (R-16 or R-24, respectively, Lab Products, Inc., Seaford, DE). The 1 m3 exposure chambers were operated at a flow rate of approximately 225 L/min to provide at least one complete air change in 4.4 min (13.5 air changes per hour; minimum guideline requirements are 10 air changes per hour) and a T99 equilibrium time of approximately 20.5 min (T99 is the time for the concentration of test substance in the chamber to rise from background or 0 to 99% of the equilibrium or target level). This chamber size and airflow rate were considered adequate to maintain an oxygen level that is at least 19%, the minimum required by the guidelines. At the end of an exposure, the chamber was operated at approximately the same, or higher, flow rate using clean air. All animals remained in the chamber for at least the T99 equilibrium time such that the bulk of the test material is cleared from the chamber. To minimize exposure to off-gassed test material, rats in the control chamber were transferred from the chamber to their domiciliary caging and returned to the animal housing room in the vivarium prior to removing the test material-exposed rats from their chambers. The jet fuel-exposed rats were held in a different animal room from controls to minimize exposure of control animals to any off-gassing from exposed. All rats were singly housed and moved to the appropriate animal housing rooms during non-exposure periods.
A nominal exposure concentration was calculated. The flow of air through the chamber was monitored using appropriate, calibrated equipment. The test substance consumed during the exposure and total volume of air passing through the chamber (volumetric flow rate times total exposure time) were used to calculate nominal concentration. During the exposure, measurements of airborne concentrations were performed in the animal breathing zone. Aerosol concentration was measured using a gravimetric filter or equivalent method. Vapor concentration was measured utilizing an appropriate sampling procedure and analytical method (Fourier-transform infrared spectrophotometry, Nicolet 380, ThermoScientific, or equivalent). The analytical method was developed in the pre-study trials and documented in the study file. Particle size distribution measurement was performed employing an appropriate particle size instrument such as cascade impactor (7-stage, In-Tox Products, Moriarity, NM, or equivalent) or an optical particle size spectrometer (Aerodynamic Particle Sizer or APS, Model 3321, TSI, Inc., Shoreview, MN, or equivalent). The distribution of material within the chamber was checked for uniformity prior to start of exposures. Measurements of concentration were taken at nine port locations under steady generation conditions. Chamber temperature, humidity, airflow rate, and static pressure were monitored continuously and recorded at least three times during the exposure. Chamber temperature and relative humidity were maintained, to the maximum extent possible, between 20 and 24°C and 30 and 70%, respectively.
Brain slice preparation
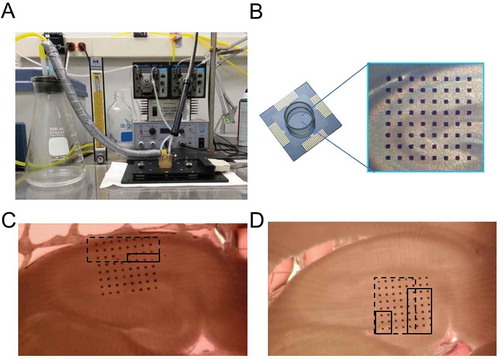
Brain slices were prepared as previously described (Rohan et al. Citation2015). Brains were rapidly removed following euthanasia and kept viable with ice-cold artificial cerebrospinal fluid (ACSF) that was continuously oxygenated (95%/5% O2/CO2). ACSF (prepared fresh daily) consisted of (in mM): 124 NaCl, 3 KCl, 1.25 KH2PO4, 10 D-Glucose, 1 MgSO4, 36 NaHCO3, and 2 CaCl2 (pH 7.4). Cerebellum and approximately 1 cm of frontal cortex were excised and remaining brain sectioned at 350 µm thickness using a vibratome (VT1000S Leica Microsystems, Buffalo Grove, IL) in the transverse plane, at 20–30°, lateral from the horizontal axis. Brain slices were maintained in warmed oxygenated ACSF and allowed to recover for at least 60 min prior to recording. Recordings were conducted utilizing a microelectrode array system (MED-64, Automate, Berkeley, CA) as pictured in ). Just prior to initiation of Phase 4 of our study (JP-5 exposures), MED-64 system was upgraded to Quad II system (Automate, Berkeley, CA) in which four brain slices may be simultaneously measured. One hippocampal slice was placed onto the pre-coated microelectrode array probe ()), using small weights to anchor the slices down. The slice was positioned such that CA1 and surrounding region were recorded, as shown in ). For Jet A, FT, and JP-5 exposure studies (Phases 2–4), slices were also positioned such that the dentate gyrus (DG) region of the hippocampus was recorded ()). Just prior to initiation of Phase 4 (JP-5), our collaborator’s preliminary unpublished results indicated some protein expression changes in the cerebellum region resulting from JP-8 exposures. Thus in Phase 4 (JP-5) of this study, EP parameters from neurons within the cerebellum region were also recorded. Coronal slices of the cerebellum were prepared at 350 µm thickness. The probe containing the brain slice was then assembled with the MED64 or Quad II system per manufacturer’s instructions. A perfusion cap was employed to circulate fresh oxygenated ACSF into the probe and prevent slices from drying. The ACSF solution and oxygen entering the probe chamber were maintained at 32–34°C. Flow rates were maintained at approximately 0 to 1 ml/min while ensuring a liquid–air interphase. Sections were perfused with humidified oxygen to prevent drying and maintain viability.
Figure 1. Alphamed’s microelectrode array system (MED-64). (a, b) Picture of our microelectrode array system setup, consisting of 64 microelectrodes arranged in 8 × 8 array. Each microelectrode is 50 µm in width and microelectrode inter-distance is 150 µm. (c) Image showing the positioning of our hippocampal slices when we are stimulating the Schaffer collateral and measuring from the CA1 neurons. (d) Image showing the positioning of our hippocampal slices when we are stimulating the perforant path and measuring from the granule cells as well as other neurons within the dentate gyrus region. (c,d) Dotted rectangular box indicates the typical area that is being recorded, whereas the solid rectangular box indicates the typical position where stimulation occurs.
Electrophysiology
All electrophysiology data were obtained using AlphaMed’s MED64 or Quad II systems (Automate, Berkeley, CA) as previously described (Rohan et al. Citation2015). Probes were initially pretreated with 0.1% polyethylenimine in 25-mM borate buffer for 12 hr prior to use. Data acquisition and stimulation protocols were performed using Mobius software (Automate, Berkeley, CA). A biphasic stimulating current of 10–100 µA was applied to the Schaffer collateral or the DG region of the hippocampus to obtain an input/output relationship curve. Evoked field potentials consisting of inward and outward deflections were recorded from neurons within the CA1 and DG region of the hippocampus at a sampling frequency of 20 kHz using a MED64 multichannel amplifier, digitized, and graphically displayed using Mobius software. Input/output data were obtained by delivering multiple biphasic stimuli at various intensities, ranging from 10 to 100 µA. Baseline field potentials were set between 50 and 60% of maximum amplitude for each slice. Paired pulse facilitation (PPF) and paired pulse depression (PPD) were obtained by delivering three sets of two consecutive stimuli of equal intensity that were 40 msec apart. Degrees of PPF and PPD were quantified by calculating the paired pulse (PP) ratio in which the response amplitude from the second stimulating pulse was divided by the response amplitude from the first pulse. Thus, a PP ratio of >1 indicates PPF, whereas a PP ratio of <1 indicates PPD. Spontaneous spiking activity of neurons within the CA1 and surrounding regions was recorded for 5 min, and frequency of firing was calculated using the Mobius software.
Data analysis of electrophysiology data
Amplitudes of evoked field potentials were calculated using Mobius software (Automate, Berkeley, CA). Quantitation of PPF and PPD was obtained by dividing the amplitude of the field potential response due to the second stimulus by the amplitude of the response due to the first stimulus to obtain the PP ratio. Data from multiple MED64 microelectrodes within the CA1 region of a hippocampal slice were averaged together to obtain the response from that particular slice. Typically, one or two hippocampal slices per rat were used and n values are indicated as number of rats. In cases in which there is more than one slice utilized per animal, data from multiple slices were averaged together and used for that animal. In Phase 4, the MED64 system was upgraded to Quad II system, in which one may perform four brain slices simultaneously. Spontaneous spike data were acquired using a high-pass filter with a cutoff frequency of 100 Hz and analyzed using an additional Bessel low-pass (9 pole) filter with a cutoff frequency of 5000 Hz. Spike detection was set to a value (15–25 µV) that is sufficiently larger than baseline noise.
Behavioral tests
Morris water maze
A protocol based upon Vorhees and Williams (Citation2006) was employed to assess spatial learning and memory using the MWM swim test. The MWM is a neurobehavioral test used to evaluate visuospatial learning, spatial navigation, and short-term as well as long-term spatial memory in rodents (Jia et al. Citation2017). The task involves sophisticated processes for acquisition and spatial localization of relevant visual cues that need to be retained and then later retrieved during subsequent trials. An animal was placed into a cylindrical dark plastic tank 7 ft in diameter filled with water maintained at approximately 26°C. A 10-cm2 escape platform sufficient for the animal to stand on was anchored to the floor of the tank, but submerged 1 inch below the surface of the water. Four virtual quadrants were created inside of the tank using the SMART tracking software from San Diego Instruments. The outside of the tank contained four large distinct shapes to serve as visual cues for location of the hidden platform. The animal was initially placed, tail end first, facing the wall of the tank, in one of four external cue-based quadrants. Rats were allowed to swim until reaching the escape platform or the computer timed out at 60 sec. Once the animal found the platform and was standing on it, the rat was given approximately 15 sec to familiarize itself with its location. The animal was then removed from the tank and dried with a towel. Rats were trained four trials/d with a resting period between trials. Training occurred over a 6-d period for a total of 24 trials. If a rat did not locate and stand on the platform within 60 sec, it was led to the platform, allowed approximately 15 sec to familiarize its location on the platform, removed from the water, and dried with a towel. Rats were immediately removed from the water if nares became submerged for >3 sec. The probe trial occurred approximately 24–48 hr after the last training run. To assess long-term retention, another probe trial took place approximately 7 d from the previous probe trial. During probe trials, the platform was removed and the animal was placed in a novel start location diagonally across from the platform quadrant. Rats had 60 sec to identify and reach the area where the platform was previously located. Several parameters such as latency to platform, swimming distance, time in target quadrant, and mean distance from goal were recorded automatically using a San Diego Instruments SMART tracking system and software.
Measurement of plasma cytokine levels
Approximately 100 µl blood was collected from the lateral tail vein of rats prior to initiation of exposure and within 24 hr following the last day of exposure. The following nine pro-inflammatory cytokines were determined using the Meso Scale Discovery (MSD) multiplex kit and the Sector Imager 2400 instrument: IFN-γ (interferon gamma), IL-1β (interleukin 1β), IL-4 (interleukin 4), IL-5 (interleukin 5), IL-6 (interleukin 6), IL-10 (interleukin 10), IL-13 (interleukin 13), KC/GRO (keratinocyte chemoattractant/ human growth-regulated oncogene chemokines), and TNF-α (tumor necrosis factor alpha). Cytokine levels were measured before and after the 28-d occupational exposure. Normalized data were calculated as the cytokine level (pg/ml) after last day of exposure divided by concentration before the first day of exposure. In Phase 4 (JP-5 exposure), blood was collected at baseline, following the 4th day of treatment, and within 24 hr as well as 2 weeks after completion of exposures.
Statistical evaluation of data
Statistical analyses of EP and neurobehavioral data were performed using SigmaPlot (v12.3 & v13.0) and Microsoft Excel 2010. Viability of brain slices was assessed by the stability of evoked responses. Only brain slices that exhibited stable field potentials in response to a constant stimulation over a 30 min period were used. This ≥30 min recording was referred to as our baseline recording. To assess stability, the coefficient of variation (standard deviation/mean) was calculated during the last 10 min of baseline recording. Brains slices that exhibited a coefficient of variation of >10% during the last 10 min of baseline recording were omitted from data analysis. A one-way analysis of variance (ANOVA) was employed to assess statistical significance of body weight, spontaneous spiking activity, and behavioral data. In some instances, in which data failed the normality test, the non-parametric equivalent of one-way ANOVA (Kruskal–Wallis) was also utilized to assess statistical significance. Additional appropriate post-hoc tests such as Holm–Sidak and Dunn’s were used to determine statistical significance between groups. Input/output and PP data were analyzed using two-way ANOVA with different stimulation intensities as one factor and experimental group as the second factor.
Results
Effects on body weight gain
Animal body weights were monitored on a weekly basis. Body weight data before, during, and after JP-8, Jet A, JP-5, or FT exposures revealed significant reduction in weight gain in the high- and/or medium-dosed groups compared to either the low group (JP-8) or control (Jet A, FT, and JP-5) (). This is consistent with earlier studies that demonstrated reductions in animal weight gains due to repeated exposures to JP-8 and/or Jet A (Mattie and Sterner Citation2011a; Sweeney, Prues, and Reboulet Citation2013). Because of Federal Holidays and unexpected military base closures due to weather, JP-8 exposures consisted of 20 actual exposure days spanning a period of 4.5 weeks; thus, the 5th-week measurements are illustrated in ). Control rats gained approximately 37% from the week before treatment to the week of last exposure (5th week). Rats exposed to the low concentration of JP-8 gained approximately 39%. Those exposed to the medium concentration gained approximately 37% and those exposed to the high concentration gained approximately 35%. Data indicated a significant difference between low and high exposure groups. There were no significant changes in weight gain in rats during the first 4 weeks of JP-8 exposures. For the remaining three fuel exposures (Jet A, JP-5, and FT), the 20 actual exposure days spanned a 28-d period (–)). For the Jet A study, significant alterations were observed beginning from week 2 in rats exposed to medium and high concentrations of Jet A compared to control. Control rats gained 26% from the week before exposure to the week of last exposure (4th week). Rats exposed to the low concentration of Jet A gained 25%, while those exposed to the medium concentration gained 22% and those exposed to the high concentration gained 22%. Significant differences among the medium and high were noted compared to either control or low exposure groups. For the FT study, significant changes were observed beginning from the first week of treatment in rats exposed to the highest concentration of FT compared to control, low, and medium. Control rats gained 24% from the week before exposure to the week of last exposure (4th week). Animals in the low FT concentration gained 22% and those in medium gained 22%, while high concentration only gained 12%. Significant differences among high group compared to control, low, or medium groups were found. For JP-5 study, 20 exposure days also spanned a 4-week period ()). Significant alterations were observed beginning from the 2nd week of exposure in rats exposed to high concentration of JP-5. Control rats gained 23% from the week before exposure to the week of last exposure (4th week). Animals exposed to low concentration of JP-5 gained 23%, medium gained 24%, and high gained 20%. Significant differences between high compared to control, low, or medium groups were found.
Figure 2. Differential effects of repeated jet fuel exposures on animal weights. (a) During the last week of exposure, there was a small but significant decrease in the weight gain from rats in the high (white bar) JP-8 exposure group compared to the low group (gray bar) (*P < 0.01 one-way ANOVA and Holm–Sidak, n = 10 rats). A significant difference was observed between the high (white bar) and control (black bar) group when the two-tailed, unpaired t-test was used (P = 0.04, t-test, n = 10 rats). Weight gain was calculated as the percent change from pre-exposure weight. (b) Statistically significant reduction in weight gain was observed in rats in the medium (patterned bar) and high (white bar) exposure groups compared to the control and low groups beginning from the 2nd week until the last week of Jet A exposure (*P < 0.05 ANOVA, Holm–Sidak, n = 10 rats). (c) A more pronounced reduction in weight gain was observed in rats in the high (white bar) exposure group just 1 week following exposures to FT (*P < 0.05 ANOVA, Holm–Sidak, n = 10 rats). (d) Statistically significant reduction in weight gain was observed in rats in the high (white bar) exposure group compared to the control (black bar) group beginning from the 2nd week until the last week of JP-5 exposure (*P < 0.05 ANOVA, Holm–Sidak, n = 10 rats). Data are represented as mean ± standard error (SEM).
Effects on input/output relationship of hippocampal neurons
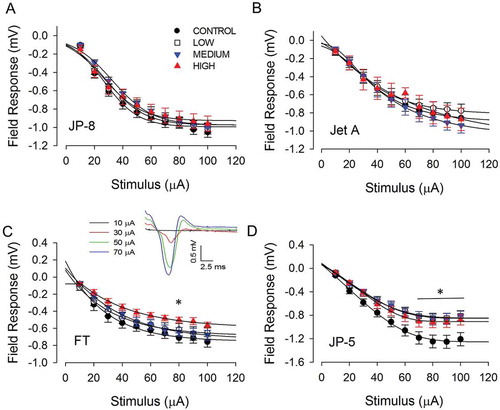
Neurotransmission properties were characterized by measuring field potentials from the CA1 when the Schaffer collateral was stimulated by biphasic current pulses of varying intensities (10–100 µA). Stimulation of the Schaffer collateral induced mainly glutamatergic synapses, reported as inward field potentials. For JP-8 and Jet A, a stimulating current at the Schaffer collateral region ranging from 10 to 100 µA was applied, and no significant effect on size and shapes of inward-deflecting field potentials of neurons was noted in the CA1 region of the hippocampus (,)). However, significant reductions in the amplitude of the field potentials in the hippocampus from rats exposed to high concentration of FT compared to control were detected at the 80 µA stimulation intensity. For JP-5, significant differences between all exposed groups (low, medium, and high) and control were found. A significant difference between high and control group occurred at 70–100 µA stimulation intensities. Significant differences were also observed between low and control as well as between medium and control at 60–100 µA stimulation intensities.
Figure 3. Differential effects of repeated jet fuel exposure on the input/output relationship of hippocampal neurons. In all panels shown, black circle denotes control, white square denotes the low exposure group, the blue downward triangle denotes the medium exposure group, and the red upside triangle denotes the high exposure group. (a,b) There was no significant change in the field responses of neurons within the CA1 region when exposed to JP-8 (a) or Jet A (b) at stimulating intensities of 10–100 µA. (c) There was a small but statistically significant effect on the field response of neurons within the CA1 region of rats exposed to FT (P < 0.001, two-way ANOVA, n = 6 rats). *Holm–Sidak post-hoc comparison indicated a significant difference (*P < 0.05) between the high concentration group compared to the control group when stimulated at 80 µA. Sample traces of field potentials in response to multiple stimulating intensities are shown in c, inset. (d) There was a statistically significant effect on the field response of neurons within the CA1 region of rats exposed to JP-5 (p < 0.001, two-way ANOVA, n = 6 rats). *Holm–Sidak post-hoc comparison revealed statistically significant differences (*P < 0.05) between the low or medium group and control at 60–100 µA stimulations and between the high group and control at 70–100 µA. Data are represented as mean ± SEM.
For Jet A, FT, and JP-5, neurotransmission properties were also characterized by measuring field potentials from the DG regions of the hippocampus when the perforant path was stimulated by biphasic current pulses of varying intensities (10–100 µA). There were no marked differences noted in amplitudes of inward field responses from neurons within the DG region from rats exposed to Jet A, FT, or JP-5 (data not shown).
Effects on short-term plasticity
PPF is the facilitation of response during two consecutive stimuli (paired stimuli) delivered within tens of milliseconds apart. PPF is believed to result from build-up of calcium ions due to two stimulating pulses delivered within the short inter-pulse duration (Katz and Miledi Citation1968; Wu and Saggau Citation1994). PPD is the depression of response during two consecutive stimuli (paired stimuli). One proposed cause of PPD is depletion of neurotransmitter-containing vesicles that are in the readily releasable pool or events leading to reduced probability of neurotransmitter release (Zucker and Regehr Citation2002). Although numerous findings indicate that PP plasticity originates from changes in the presynaptic cell, there are also some data suggesting that postsynaptic receptor desensitization of postsynaptic receptors may also play a role (Zucker and Regehr Citation2002). It is possible that these multiple mechanisms are utilized by distinct synapses.
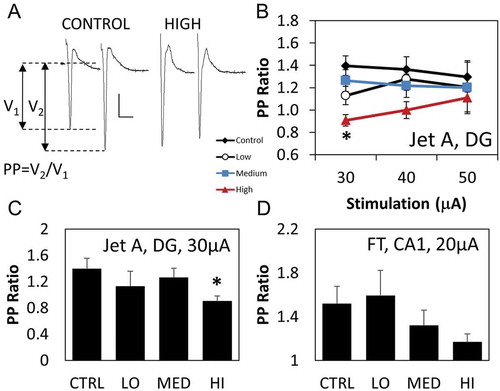
PPF and PPD were measured as a ratio of response amplitude from the 2nd stimulus to the response amplitude from the 1st stimulus (pre-pulse ratio or PP ratio). A reduction in PP ratio measurements was seen in DG region from rats exposed to Jet A (,,)). Mean PP ratio measured from the DG region of controls was 1.4 ± 0.08 was significant from average PP ratio of rats exposed to the highest concentration of Jet A was 0.9 ± 0.05 when 30 µA was used as the PP stimulation intensity ()). However, there were no marked differences in PP ratio of DG neurons from rats exposed to FT or JP-5 (data not shown). The DG region was not examined for JP-8. There was a numerical decrease in PP ratio measurements from neurons within the CA1 region from rats exposed to high concentration of FT ()). There was no marked alteration in PP ratio of postsynaptic potentials in CA1 region of the hippocampus resulting from JP-8, Jet A, or JP-5 exposures (data not shown).
Figure 4. Differential effects of jet fuel on responses to paired pulse stimulations. (a) Sample field response when stimulated by a paired pulse paradigm (at 30 µA intensity with an interpulse interval of 40 ms) from a control rat and a rat following exposures to high Jet A concentration. Paired pulse ratio (PP ratio) was calculated by dividing the amplitude of the field potential due to 2nd stimulus (V2) by the amplitude of field potential due to the 1st stimulus (V1). Scale bar: 0.2 mV, 20 ms. Stimulus intensities were 30, 40, and 50 µA for the Jet A study, 20, 30, 40, and 50 µA for the FT study and 10–100 µA for the JP-5 study. All probes exhibiting response greater than 50 µV were averaged together to obtain a paired pulse value for that slice. (b) There was a small but significant changes (P < 0.001, two-way ANOVA, n = 6 rats) in response to paired pulse stimulation of neurons within the hippocampal dentate gyrus region from rats treated with high doses of Jet A (*P = 0.005, Holm–Sidak post-hoc comparison). Black circle denotes control, white square denotes the low exposure group, the blue downward triangle denotes the medium exposure group, and the red upside triangle denotes the high exposure group. (c) Bar graph of PP ratio data from Jet A rats at 30 µA stimulation intensity. One-way ANOVA analysis and Holm–Sidak comparison revealed significant difference between the control and high group (P < 0.05, n = 5 rats). (d) There was a decreasing trend in PP ratio from neurons within the CA1 region of rats exposed to the high concentration of FT. Decrease was not statistically significant as assessed by one-way ANOVA and Kruskal–Wallis analysis (P = 0.212 and 0.08 respectively, n = 6 rats). Data are represented as mean ± SEM.
Effects on spontaneous spiking frequency
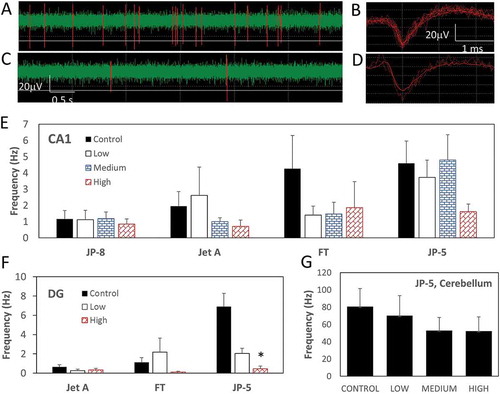
Spontaneous spiking activities of CA1 neurons were recorded for 5 min. There was a large variation in frequency of spontaneous activities among animals. Representative samples of spontaneous spiking traces and extracted spikes are shown in –). Because all spontaneous spiking data from both CA1 and DG regions did not pass the normality test, non-parametric assessments were also conducted. There was a no significant change in the frequency of spontaneous activity of neurons within the CA1 region from rats exposed to high concentration of Jet A, FT, JP-5, but not JP-8 ()). However, due to the large variability across animals, the observed numerical fall was not significant ()). For Jet A, FT, and JP-5, the frequency of spontaneous activities of neurons was also determined within the DG region from control, low, and high groups only. A significant reduction in frequency of spontaneous activity of DG neurons from rats exposed to high JP-5 levels as assessed was detected ()). However, when the non-parametric Kruskal–Wallis analysis was used, there was a significant fall in spontaneous spiking activity of DG neurons in animals exposed to the high concentration of not only JP-5 but also FT ()). For JP-5, the frequency of spontaneous activity of neurons within the cerebellum was also measured and calculated. Rationale for the cerebellum recordings was based upon our collaborator’s unpublished results, which demonstrated some protein expression alterations in the cerebellar region. Although there was a numerical reduction in mean frequency in rats exposed to high JP-5 levels, there was no marked difference between control and dosed groups ()).
Figure 5. Effects of jet fuel on frequency of spontaneous spikes. (a,c) Representative spiking activity from a control rat (a) and rat exposed to high FT (c). (b,d) Representative extracted spikes from a control rat (b) and a rat exposed to high FT (d). (e) Average of maximum frequency from probes within the CA1 region across slices exhibiting spikes within a 10-min recording window. There was a trending decrease in spiking frequency from rats exposed to the highest concentration of Jet A, FT, and JP-5, but changes were not statistically significant (P > 0.05, one-way ANOVA and Kruskal–Wallis). (f) Average of maximum frequency from probes within the DG region across slices exhibiting spikes within a 10-min recording window. There was no significant change in spontaneous spiking activity of neurons within the dentate gyrus region of hippocampus from rats exposed to high concentrations of FT when one-way ANOVA was used (P = 0.209). However, when the non-parametric Kruskal–Wallis was used, there was a significant decrease in spontaneous spiking activity frequency between the high and control groups (P < 0.05, n = 6 rats). There was a significant decrease in spontaneous spiking activity of neurons within the dentate gyrus region of the hippocampus from rats exposed to the highest concentration of JP-5 (*P < 0.05, one-way ANOVA/Holm–Sidak and Kruskal–Wallis/Dunn’s, n = 6 rats). (g) There was a slight trending decrease in the spontaneous spiking activity of cerebellar neurons from rats exposed to the highest concentration of JP-5, but change was not statistically significant. Data are represented as mean ± SEM.
Influence of jet fuel on learning and memory
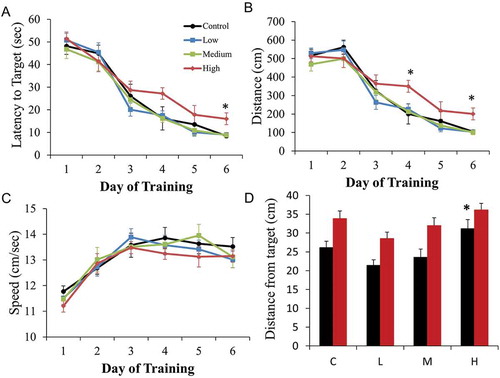
The influence of repeated in vivo exposures to jet fuel (JP-8, Jet A, FT, or JP-5) on spatial learning and memory was assessed using the MWM assay to test learning and memory. Multiple parameters including average latency (sec), total distance traveled (cm), and average distance to target (cm) were used to quantitate and compare learning and memory capacity. No significant changes in spatial learning and memory resulting from repeated exposures to JP-8, Jet A, or JP-5 were found (data not shown). However, in rats exposed to high concentration of FT, there were significant alterations in the learning parameters compared to control, low, or medium (). Significant differences were observed on learning day 4 and learning day 6. Latency to target measures in second is one way to quantitate learning. Day 4 latency data did not pass the normality test. There was a significant difference in latency to target data among experimental groups on the 4th learning day when the non-parametric Kruskal–Wallis testing was used. Post-hoc comparison analysis using Dunn’s method revealed significant differences between controls which took an average of 16 sec to reach the target platform (latency to target) and rats in the high group which took an average of 27 sec to reach the target platform ()). If parametric analysis was used (one-way ANOVA), day 4 did not yield a significant difference in the latency data. On the 6th learning day, controls took an average of 8.5 sec, whereas animals in the high concentration exposure group took an average of 16 sec to reach the target platform. Day 6 latency data passed the normality test, and one-way ANOVA yielded significant differences among the groups ()). The total swimming distance traveled is another parameter by which one can estimate learning. Similar to day 4 latency data, day 4 distance data also failed normality test. However, Kruskal–Wallis analysis revealed significant difference among experimental groups ()). Multiple comparison analysis using Dunn’s method showed a significant difference between high and controls. Parametric analysis of day 4 distance data also noted significant change between high and control. Similar to the day 6 latency data, day 6 distance values passed the normality test. One-way ANOVA detected significant difference among groups ()). Multiple comparison analysis using the Holm–Sidak method noted significant difference between high and control and low and medium groups. However, swim speed remained similar in all experimental groups during day 4 and day 6 ()). During the 24-hr probe test, a significant difference among experimental groups was found assessed by one-way ANOVA ()). Post-hoc comparison test using the Holm–Sidak method revealed that the high group was significantly different than low and medium. There were no marked differences among all groups during the probe tests administered 7 d later.
Figure 6. Rats exposed to the high concentration of FT displayed impaired spatial learning parameters in Morris water maze task. There was no change observed with JP-8, Jet A, or JP-5 exposures (not shown). Learning was achieved in 6 d. The first probe test was conducted 24 hr following the last learning day (probe1) to assess memory. The second probe test was conducted 7 d following the last learning day (probe2) to assess memory retention. (a) Average latency data during the learning phase (day 1–day 6) from control rats and rats exposed to FT. There was a statistically significant increase in the average latency to target in the high (red) exposure group compared to the control (black) group during day 6 of training (*P < 0.05, one-way ANOVA and Holm–Sidak post-hoc comparison, n = 10 rats). Kruskal–Wallis analysis of day 4 with Dunn’s post-hoc comparison also revealed statistically significant difference between the high and control group (P = 0.002). (b) Average swimming distance data during the learning phase (day 1–day 6) from control rats and rats exposed to FT. There was a statistically significant increase in the average swimming distance in the high (red) exposure group compared to the control (black) group during day 4 and day 6 of training (*P < 0.05, one-way ANOVA and Holm–Sidak post-hoc comparison, n = 10 rats). (c) No changes were observed in the average swim speed among control and exposed rats. (d) Average distance to target (cm) during probe 1 (black, 48 hr) and probe 2 (red, 7 d) from control rats (‘C’) and rats exposed to FT (L = low group; M = medium group; H = high group). There was a statistically significant increase in the average distance from target in the high exposure group compared to the low and medium exposure group during the probe test at 24 hr (probe1, black) (P < 0.05, one-way ANOVA and Holm–Sidak post-hoc comparison, n = 10 rats). There was no statistical difference in the result from the second probe test (red) given 1 week after training. Data are represented as mean ± SEM.
Effects on systemic inflammatory cytokine levels
Measurements of plasma levels of inflammatory cytokines (IFN-γ, IL-1β, IL-4, IL-5, IL-6, KC/GRO, IL-10, IL-13, and TNF-α) did not yield any significant effect resulting from occupational exposures to JP-8, Jet A, FT, or JP-5 (data not shown).
Discussion
JP-8 has been used widely across the DoD. JP-5 is a similar fuel developed for use by the Navy, but with a higher flash point requirement, due to Navy operations in smaller or confined areas (e.g., aircraft carriers). Jet A has historically been more prevalent in civilian/commercial aviation, but is also used by the DoD. The chemical compositions of JP-8, JP-5, and Jet A are similar consisting of mostly aliphatic and aromatic hydrocarbons (). Neurotoxicity attributed to JP-8 and JP-5 was previously reported in animal models but mainly centered on behavioral observations and neurotransmitter changes (Rossi, Nordholm, and Carpenter Citation2001). OELs were established (Mattie and Sterner Citation2011), and all studies thus far reported no toxic effects below, at, and even higher than the OEL of 200 mg/m3. FT jet fuel is a synthetic organic mixture produced using the FT process using carbon monoxide and hydrogen from natural gas, coal, or biological feedstock (Mattie et al. 2011). Unlike JP-8, JP-5, or Jet A, which consists of a mixture of aliphatic and aromatic hydrocarbons, FT jet fuel contains predominantly aliphatic hydrocarbons.
In vivo whole animal exposures with neurobehavioral assessments were combined with in vitro electrophysiology in an effort to characterize potential targets within the hippocampus that may be susceptible to the jet fuel effects. Excessive concentrations of jet fuel were intentionally used to focus on the neurotoxicity potential of accidental or high exposures. A summary of our data is provided in . Our findings demonstrated that in vivo exposures to high JP-8, Jet A, JP-5, or FT levels induced distinct effects on EP signaling in hippocampal neurons. Although there were significant differences among some groups, those differences were not dose-dependent and not consistent across similar fuels (JP-8, Jet A, or JP-5). Thus, these differences may be attributed to physiological variation among different animals and may pose as false positives, especially since assessments included many end points (body weight, four EP parameters, four MWM outcomes, and nine inflammatory cytokines). Further, no apparent cognitive changes were observed during exposures to high JP-8, Jet A, or JP-5 levels. Only rats exposed to high concentrations of FT were found to exhibit learning and memory impairments in the MWM test. Thus, data suggest that those EP alterations may not directly correlate with cognitive impairment. The only possible correlation with spatial learning and memory that might be investigated further is short-term plasticity PPF data specifically from neurons within the hippocampal CA1 region since rats exposed to the highest concentration of FT displayed impaired learning parameters.
Table 2. Summary Table. Differential Effects of Three Jet Fuels Measured Using EP Methods and Behavioral Assays
Body weight gain due to high jet fuel exposures
Exposures of male F344 rats to jet fuel induced significant reduction in weight gain. With JP-8, the group exposed to the high concentration exhibited significantly less weight gain compared to the low. The significant change between high and the low treatment groups was first observed during the second week of exposure. With Jet A, both groups exposed to medium and high levels displayed significantly less % weight gain compared to control. Similar to JP-8, this significant alteration in weight gain was found as early as the second week of exposure, consistent with an earlier Jet A study (Sweeney, Prues, and Reboulet Citation2013). Rats exposed to the high concentration of JP-5 showed a reduction in weight gain compared to control also from the second week of fuel exposures similar to Jet A. A more pronounced fall in weight gain % was observed in rats exposed to high FT levels beginning as early as one week after treatment. Our data pertaining to weight are consistent with previous findings also demonstrating decreased weight gain with exposure to high levels of jet fuel (Mattie, Alden, and Newell Citation1991; Mattie and Sterner Citation2011a; Sweeney, Prues, and Reboulet Citation2013). According to these investigators, there were minute systemic effects seen in subchronic (90 d) exposures to JP-8 (Mattie, Alden, and Newell Citation1991; Mattie and Sterner Citation2011a), FP (Mattie et al. Citation2011), or 14-d to Jet A (Sweeney, Prues, and Reboulet Citation2013). The investigators further noted that the documented small systemic changes were unlikely to manifest in a toxicological effect that manifested as reduced animal weight gain. It was suggested that the decreased weight in exposed rats is more likely attributed to diminished appetite, perhaps due to the after-taste induced by excessive jet fuel levels. It is interesting that the high concentration of FT (2000 mg/m3) induced a more severe reduction in weight gain compared to JP-8, Jet A, or JP-5. However, unlike Jet A, where effects were also detected with the medium concentration (1000 mg/m3), FT effect on weight gain, albeit more pronounced, was only found at the highest concentration. FT, in general, is believed to be less toxic than JP-8, Jet A, or JP-5 (Lamprecht Citation2007). This is consistent with our data in that animals exposed to low and medium doses of FT did not show any marked fall in weight gain. However, there appears to be a threshold FT concentration between 1000 and 2000 mg/m3 that produced a greater effect on weight gain compared to other jet fuels. It is not possible at this time to reconcile why a high concentration of FT would produce a greater influence on weight gain compared to other jet fuels. One speculation is that high concentration of FT may provoke a greater loss in appetite.
Differential effects on EP and learning parameters due to distinct jet fuel types
Input/output responses
Exposure to high concentrations of jet fuel was found to induce perturbations in the input/output relationship curves of neurons within the CA1 region. Repeated FT or JP-5 exposures triggered some changes in the inward field potentials of the CA1 region. Interestingly, no significant changes in the size of evoked responses were detected from rats exposed to JP-8 or Jet A. One possibility is that reductions in evoked field potentials due to JP-5 and FT might result from exposure-mediated alterations in neurotransmitter levels in the hippocampus. Rossi, Nordholm, and Carpenter (Citation2001) indicated that there might be differential effects on neurotransmitter levels in the hippocampus region initiated by exposure to JP-5 or JP-8. Significant increase in DA and DA metabolite (DOPAC) levels and a fall in a catecholamine metabolite (homovanillic acid) in the hippocampus occurred following after repeated exposures (6 weeks, 1200 mg/m3) to JP-5. These changes in DA and DOPAC levels were only observed in the hippocampus of rats exposed to JP-5 and not those exposed to JP-8 (Rossi, Nordholm, and Carpenter Citation2001), although Baldwin et al. (Citation2007) demonstrated elevated DOPAC levels in the hippocampus of rats exposed to JP-8 (4 weeks, 1774 mg/m3). Since neurotransmitter levels might directly dictate the size of evoked synaptic responses, the change in evoked field potentials might be due to alterations in levels of neurotransmitter(s) within the hippocampus. Future studies that measure levels of other neurotransmitters such as glutamate and gamma-aminobutyric acid (GABA) may be useful in determining the underlying mechanism of JP-5 or FT effects on neurotransmission. However, similar EP changes were not found in rats exposed JP-8 or Jet A, suggesting that observed differences in the input/output relationship plots might also be due to random physiological processes that may not be exposure dependent.
Learning and memory and synaptic plasticity
Only exposure to FT at high quantities induced significant changes in spatial learning parameters as assessed by the MWM test. No marked effects on spatial learning and memory were observed with JP-8 or JP-5 exposures, consistent with previous findings (Baldwin et al. Citation2001; Rossi, Nordholm, and Carpenter Citation2001). No marked alterations in learning and memory parameters were detected after Jet A. There were no apparent published data that used MWM testing to assess learning and memory in rats following Jet A or FT treatment. With exposure to high concentration of FT, rats showed some impairment in learning as measured by latency to target and total distance travelled on the 4th and 6th day of learning without any marked effects on swim speed (–)). Thus, increased latency and total distance are not likely due to effects on motor function since swim speeds across experimental groups are similar. During the first probe test conducted at 24 hr following the last (6th) learning day, there appears to be a memory impairment in highest group rats exposed. However, significance was achieved only between high and low group. By the 7th day, memories of rats across experimental groups were similar.
Long-term potentiation (LTP) was also determined to assess whether jet fuel exposure induced changes in long-term synaptic plasticity. There were no significant changes in hippocampal LTP of the Schaffer collateral–CA1 synapse in rats exposed to JP-8, Jet A, JP-5, or FT (data not shown). Thus, impaired performance on the MWM test in rats exposed to high FT levels (2000 mg/m3) did not correlate with diminished CA1 LTP. The lack of correlation between EP and behavioral data may be attributed to the discrepancy in the time between EP recordings, which occurred within 24 hr after exposures and behavioral testing, which was conducted 1 week following exposures. However, there was a decreasing trend in PPF of CA1 neurons from rats exposed to high FT levels but not other fuel types, although the fall was not significant ()). PPF is a form of short-term plasticity and might also play a role in learning and memory. Key molecular players in hippocampal PPF are presynaptic proteins that regulate release of neurotransmitters such as calmodulin kinase II (CaMKII) and synapsin (Silva et al. Citation1996). Mutation or removal of these proteins was found to diminish PPF and impair learning and memory without necessarily affecting LTP. Further, mice lacking ataxin-1, a DNA-binding protein whose mutation produces loss of cerebellar neurons, also exhibited impaired learning with decreased CA1 PPF albeit unaffected LTP (Matilla et al. Citation1998).
In contrast, PPF alterations within the DG region did not appear to directly correlate with learning and memory, since rats exposed to the highest Jet A level exhibited significant PPF changes in the DG without any performance impairment in the MWM test. Similar to input/output responses, although some effects were noted, these were not consistent which thus cannot rule out the possibility that the observed changes might be due to random physiological variability not related to exposures.
Spontaneous spiking activity
Although there was some reduction in frequency of spontaneous spiking firing in neurons within the CA1 region in rats exposed to Jet A, FT, and JP-5, these were not marked likely due to the large variability across different animals in the same experimental group. Significance was achieved in spiking frequency of hippocampal neurons within the DG region of animals exposed to the highest concentration of JP-5. A diminished spiking rate of hippocampal neurons was previously reported in response to compounds with anticonvulsive effects, including carbamazepine, valproate, and, more recently, platelet-activating factor receptor antagonists (Colombi et al. Citation2013; Musto et al. Citation2016). Although postsynaptic proteins might modulate spiking frequency, presynaptic proteins also play a role since compounds that block neurotransmitter release, such as botulinum toxin, also inhibit spiking activity of pyramidal neurons (Bozzi et al. Citation2006). Since marked alterations in frequency of spontaneous activity were not detected in rats exposed to the other fuels, it is conceivable that these observed changes may be associated with random physiological variations among different animals.
Effects on inflammation
Early studies indicated that exposures to JP-5, JP-8, or FT produced inflammatory effects on the immune system (Nordholm Citation1999; Mattie et al. Citation2011). Thus, plasma levels of inflammatory cytokines were determined to assess influence of jet fuel on inflammation. Plasma levels of nine inflammatory cytokines (IFN-γ, IL-1β, IL-4, IL-5, IL-6, KC/GRO, IL-10, IL-13, and TNF-α) were examined using the MSD multiplex kit and the Sector Imager 2400 instrument (MSD, Rockville, MD) before and after exposures to JP-8, Jet A, or FT. In the case of JP-5, cytokine levels were measured at four time points (before, after 4 exposure days, after completion of exposures, and 2 weeks after completion of exposures). There were no significant differences in cytokine levels between control and exposure groups in all fuels tested (data not shown).
Summary
Previous animal studies on jet fuel toxicity showed few adverse effects that were somewhat inconsistent. Our data demonstrated that EP recordings of brain slices, following in vivo animal exposures to high concentrations of jet fuels, may potentially mediate abnormalities in neurotransmission properties. However, it remains unclear as to whether the observed changes were indeed the results of direct or indirect effects due to systemic alterations attributed to jet fuel exposures or whether these might be related to other physiological processes. The lack of correlation between EP findings and behavioral performance might be attributed to the fact that EP recordings were conducted within 24 hr after exposures, whereas MWM testing was performed within 1 week after treatment. The noted EP changes observed may be transient in nature, did not persist, and manifested in a behavioral deficit. Alternatively, it may take longer than 1 week for EP changes to manifest in a behavioral deficit, although unlikely based upon previous findings. Further investigations are needed to determine whether changes in EP measurements may be used as an early indicator of cognitive effects. Efforts have commenced in the development of a correlation matrix between EP and behavioral performance parameters, such that one can calculate % change needed from a recorded EP parameter (i.e., PPF or spontaneous spiking firing frequency) to elicit a specific cognitive deficit. Establishment of such correlation may help determine whether the observed EP changes reported here warrant further investigation. Nonetheless, data showed that an EP method might be used to assess neuronal function in brain slices following in vivo exposures to jet fuel. It is possible that an EP profile that directly reflects the integrity of synaptic function, as well as neuronal network, might serve as a useful addition to the conventional behavioral testing when performing neurotoxicological assessments.
Disclaimers
The views expressed in this presentation are those of the authors and do not necessarily reflect the official policy or position of the Department of the Navy, Department of Defense, nor the U.S. Government.
Animal Care and Use
The study protocol was reviewed and approved by the Wright-Patterson Air Force Base Institute of Research Institutional Animal Care and Use Committee (IACUC) in compliance with all applicable Federal regulations governing the protection of animals in research and conducted in an AAALAC-accredited facility.
Copyright
I am an employee of the U.S. Government. This work was prepared as part of my official duties. Title 17 U.S.C. §105 provides that ‘Copyright protection under this title is not available for any work of the United States Government.’ Title 17 U.S.C. §101 defines a U.S. Government work as a work prepared by a military service member or employee of the U.S. Government as part of that person’s official duties.
Acknowledgments
We thank Dr. Dave Mattie, Kathleen Frondorf, Nathan Gargas, Michelle Goodwin, George Lemmer, Elizabeth Phillips, Angela Hulgan, Antonio Brown, Teresa Sterner, and the Wright-Patterson Air Force Base Research Support Command for their contribution to this work.
Additional information
Funding
References
- Baldwin, C. M., A. J. Figueredo, L. S. Wright, S. S. Wong, and M. L. Witten. 2007. Repeated aerosol-vapor JP-8 jet fuel exposure affects neurobehavior and neurotransmitter levels in a rat model. Journal Toxicogical Environment Health, Particle A 70:1203–1213. doi:10.1080/15287390701380872.
- Baldwin, C. M., F. P. Houstin, M. N. Podgornik, R. S. Young, C. A. Barnes, and M. L. Witten. 2001. Effects of aerosol-vapor JP-8 jet fuel on the functional observational battery, and learning and memory in the rat. Archives Environment Heatlh 56:216–226. doi:10.1080/00039890109604445.
- Bozzi, Y., L. Costantin, F. Antonucci, and M. Caleo. 2006. Action of botulinum neurotoxins in the central nervous system: Antiepileptic effects. Neurotoxicol Researcher 9:197–203. doi:10.1007/BF03033939.
- Colombi, I., S. Mahajani, M. Frega, L. Gasparini, and M. Chiappalone. 2013. Effects of antiepileptic drugs on hippocampal neurons coupled to micro-electrode arrays. Frontiers in Neuroengineering 6:Article 10. doi:10.3389/fneng.2013.00010.
- Fechter, L. D., J. W. Fisher, G. D. Chapman, V. P. Mokashi, P. A. Ortiz, J. E. Reboulet, J. E. Stubbs, A. M. Lear, S. M. McInturf, S. L. Prues, C. A. Gearhart, S. Fulton, and D. R. Mattie. 2012. Subchronic JP-8 jet fuel exposure enhances vulnerability to noise-induced hearing loss in rats. Journal of Toxicology and Environmental Health. Part A 75:299–317. doi:10.1080/15287394.2012.652060.
- Gaworski, C. L., J. D. MacEwen, and E. H. Vernot. 1984. Comparison of the subchronic inhalation toxicity of petroleum and oil shale JP-5 jet fuels. In Advances in modern environmental toxicology. Volume VI: Applied toxicology of petroleum hydrocarbons, eds. H. N. MacFarland, C. E. Holdsworth, and M. Ja, 33–47. Princeton, NJ: Princeton Scientific Publishers.
- Gaworski, C. L., J. D. MacEwen, and E. H. Vernot. 1985. Evaluation of 90-day inhalation toxicity of petroleum and oil shale JP-5 jet fuel. Wright-Patterson Air Force Base, OH: U.S. Navy. ADA156815.
- Grant, G. M., K. M. Shaffer, W. Y. Kao, D. A. Stenger, and J. J. Pancrazio. 2000. Investigation of in vitro toxicity of jet fuels JP-8 and Jet A. Drug Chemical Toxicogical 23:279–291. doi:10.1081/DCT-100100115.
- Guthrie, O. W., B. A. Wong, S. M. McInturf, J. E. Reboulet, P. A. Ortiz, and D. R. Mattie. 2015. Inhalation of hydrocarbon jet fuel suppress central auditory nervous system function. Journal Toxicogical Environment Health A 78:1154–1169. doi:10.1080/15287394.2015.1070389.
- Guthrie, O. W., H. Xu, B. A. Wong, S. M. McInturf, J. E. Reboulet, P. A. Ortiz, and D. R. Mattie. 2014. Exposure to low levels of jet-propulsion fuel impairs brainstem encoding of stimulus intensity. Journal Toxicogical Environment Health A 77:261–280. doi:10.1080/15287394.2013.862892.
- Jia, J.-X., X.-S. Yan, Z.-P. Cai, W. Song, D.-S. Huo, B.-F. Zhang, H. Wang, and Z.-J. Yang. 2017. The effects of phenylethanoid glycosides, derived from Herba cistanche on cognitive deficits and antioxidant activities in male SAMP8 mice. Journal Toxicogical Environment Health A 80:1180–1186. doi:10.1080/15287394.2017.1367097.
- Katz, B., and R. Miledi. 1968. The role of calcium in neuromuscular facilitation. Journal Physiological 195:481–492. doi:10.1113/jphysiol.1968.sp008469.
- Knave, B., H. E. Persson, J. M. Goldberg, and P. Westerholm. 1976. Long-term exposure to jet fuel: An investigation on occupationally exposed workers with special reference to the nervous system. Scandinavian Journal Work, Environment Health 2:152–164. doi:10.5271/sjweh.2809.
- Konishi, K., Mckenzie, S., Etchamendy, N., Roy, S., and Bohbot, V. D. 2017. Hippocampus-dependent spatial learning is associated with higher global cognition among healthy older adults. Neuropsychologia 106:310–321.
- Lamprecht, D. 2007. Fischer-Tropsch fuel for use by the U.S. military as battlefield-use fuel of the future. Energy & Fuels 21:1448–1453. doi:10.1021/ef060607m.
- Matilla, A., E. D. Roberson, S. Banfi, J. Morales, D. L. Armstrong, E. N. Burright, H. T. Orr, J. D. Sweatt, H. Y. Zoghbi, and M. M. Matzuk. 1998. Mice lacking ataxin-1 display learning deficits and decreased hippocampal paired pulse facilitation. The Journal of Neuroscience 18:5508–5519.
- Mattie, D. R., C. L. Alden, and T. K. Newell. 1991. A 90-day continuous vapor inhalation toxicity study of JP-8 jet fuel followed by 20 or 21 months of recovery in Fischer 244 rats and C57BL/6 mice. Toxicologic Pathology 19:77–87. doi:10.1177/019262339101900201.
- Mattie, D. R., and T. R. Sterner. 2011a. Past, present and emerging toxicity issues for jet fuel. Toxicology and Applied Pharmacology 254:127–132. doi:10.1016/j.taap.2010.04.022.
- Mattie, D. R., T. R. Sterner, B. A. Wong, D. E. Dodd, D. K. Layko, P. W. Ross, E. A. Gross, G. A. Willson, J. P. Hinz, and D. J. Wagner. 2011. 90-Day inhalation toxicity study of FT fuel. AFRL-RH-FS-TR-2011-0014. http://www.dtic.mil/docs/citations/ADA557260.
- Muller, R. U., Stead, M., and Pach J. 1996. The hippocampus as a cognitive graph. Journal of General Physiology 107:663–694.
- Musto, A. E., R. F. Rosencrans, C. P. Walker, S. Bhattacharjee, C. M. Raulji, L. Belayev, Z. Fang, W. C. Gordon, and N. G. Bazan. 2016. Dysfunctional epileptic neuronal circuits and dysmorphic dendritic spines are mitigated by platelet-activating factor receptor antagonism. Scientific Reports 6:30298. doi:10.1038/srep30298.
- Nordholm, A. F. 1999. Repeated exposure of rats to JP-4 vapor induces changes in neurobehavioral capacity and 5-HT/5-HIAA levels. Journal Toxicogical Environment Health A 56:471–499. doi:10.1080/009841099157935.
- NRC. 2011. Guide for the care and use of laboratory animals. Eighth Edition. Washington, D.C.: National Academy Press, Institute of Laboratory Animal Resources, Commission on Life Sciences, National Research Council.
- Porter, H. O. 1990. Aviators intoxicated by inhalation of JP-5 fuel vapors. Aviation, Space, and Environmental Medicine 61:654–656.
- Proctor, S. P., K. J. Heaton, K. W. Smith, E. R. Rodrigues, D. E. Widing, R. Herrick, J. J. Vasterling, and M. D. McClean. 2011. The occupational JP8 exposure neuroepidemiology study (OJENES): Repeated workday exposure and central nervous system functioning among US Air Force personnel. Neurotoxicology 32:799–808. doi:10.1016/j.neuro.2011.06.010.
- Risher, J., O. Faroon, F. Llados, L. Ingerman, and M. Citra. 2017. Toxicological profile for JP-5, JP-8, and Jet A fuels. U.S. Department of Health and Human Services. Public Health Service. Agency for Toxic Substances and Disease Registry. https://www.atsdr.cdc.gov/toxprofiles/tp121.pdf.
- Rohan, J. G., K. A. Carhuatanta, S. M. McInturf, M. K. Miklasevich, and R. Jankord. 2015. Modulating plasticity with in-vivo brain stimulation. The Journal of Neuroscience 35:12824–12832. doi:10.1523/JNEUROSCI.2376-15.2015.
- Rossi, J., III, A. F. Nordholm, and R. L. Carpenter. 2001. Effects of repeated exposure of rats to JP-5 or JP-8 fuel vapor on neurobehavioral capacity and neurotransmitter levels. Journal Toxicogical Environment Health A 63:397–428. doi:10.1080/152873901300343452.
- Silva, A. J., T. W. Rosahl, P. F. Chapman, Z. Marowitz, E. Friedman, P. W. Frankland, V. Cestari, D. Cioffi, T. C. Su¨Dhof, and R. Bourtchuladze. 1996. Impaired learning in mice with abnormal short-lived plasticity. Current Biology 6:1509–1518. doi:10.1016/S0960-9822(96)00756-7.
- Smith, L. B., A. Bhattacharya, G. Lemasters, P. Succop, E. Puhala, M. Medvedovic, and J. Joyce. 1997. Effect of chronic low-level exposure to jet fuel on postural balance of US Air Force Personnel. Journal of Occupational and Environmental Medicine 7:623–632. doi:10.1097/00043764-199707000-00007.
- Sterner, T. R., B. A. Wong, K. L. Mumy, S. M. McInturf, M. D. Grimm, N. M. Gargas, D. E. Stoffregen, and D. R. Mattie. 2015. 90-Day inhalation toxicity study of bio-derived GEVO alchohol-to-jet (ATJ) synthetic paraffinic kerosene (SPK) in rats with neurotoxicity testing and genotoxicity assay. AFRL-RH-WP-TR-2015-0031. http://www.dtic.mil/docs/citations/ADA623546.
- Striebich, R. C., L. M. Shafer, R. K. Adams, Z. J. West, M. J. DeWitt, and S. Zabarnick. 2014. Hydrocarbon group-type analysis of petroleum-derived and synthetic fuels using two-dimensional gas chromatography. Energy & Fuels 28:5696−5706. doi:10.1021/ef500813x.
- Sweeney, L. M., S. L. Prues, and J. E. Reboulet. 2013. Subacute effects of inhaled Jet Fuel-A (Jet A) on airway and immune function in female rats. Inhalation Toxicology 25:257–271. doi:10.3109/08958378.2013.780191.
- Tu, R. H., C. S. Mitchell, G. G. Kay, and T. H. Risby. 2004. Human exposure to the jet fuel, JP-8. Aviation, Space, and Environmental Medicine 75:49–59.
- Vorhees, C. V., and M. T. Williams. 2006. Morris water maze: Procedures for assessing spatial and related forms of learning and memory. Natural Protocols 1:848–858. doi:10.1038/nprot.2006.116.
- Wu, L. G., and P. Saggau. 1994. Presynaptic calcium is increased during normal synaptic transmission and paired-pulse facilitation, but not in long-term potentiation in area CA1 of hippocampus. The Journal of Neuroscience 14:645–654.
- Xu, Y., J. Yan, P. Zhou, J. Li, H. Gao, Y. Xia, and Q. Wang. 2012. Neurotransmitter receptors and cognitive dysfunction in Alzheimer’s disease and Parkinson’s disease. Progress in Neurobiology 97:1–13. doi:10.1016/j.pneurobio.2012.02.002.
- Zucker, R. S., and W. G. Regehr. 2002. Short-term synaptic plasticity. Annual Review of Physiology 64:355–405. doi:10.1146/annurev.physiol.64.092501.114547.