
ABSTRACT
The notion that adverse health effects produced by exposure to environmental contaminants (EC) may be modulated by the presence of non-chemical stressors is gaining attention. Previously, our lab demonstrated that cross-fostering (adoption of a litter at birth) acted as a non-chemical stressor that amplified the influence of developmental exposure to EC on the glucocorticoid stress-response in adult rats. Using liver from the same rats, the aim of the current study was to investigate whether cross-fostering might also modulate EC-induced alterations in hepatic gene expression profiles. During pregnancy and nursing, Sprague-Dawley dams were fed cookies laced with corn oil (control, C) or a chemical mixture (M) composed of polychlorinated biphenyls (PCB), organochlorine pesticides (OCP), and methylmercury (MeHg), at 1 mg/kg/day. This mixture simulated the contaminant profile reported in maternal human blood. At birth, some control and M treated litters were cross-fostered to form two additional groups with different biological/nursing mothers (CC and MM). The hepatic transcriptome was analyzed by DNA microarray in male offspring at postnatal days 21 and 78–86. Mixture exposure altered the expression of detoxification and energy metabolism genes in both age groups, but with different sets of genes affected at day 21 and 78–86. Cross-fostering modulated the effects of M on gene expression pattern (MM vs M), as well as expression of energy metabolism genes between control groups (CC vs C). In conclusion, while describing short and long-term effects of developmental exposure to EC on hepatic transcriptomes, these cross-fostering results further support the consideration of non-chemical stressors in EC risk assessments.
Introduction
Humans are continuously exposed to mixtures of environmental contaminants (EC) through various sources including food, drinking water, and ambient air. In the United States and Canada pregnant women were found to contain detectable levels of EC including polychlorinated biphenyls (PCB), organochlorine pesticides (OCP), perfluorinated compounds, phenols, polybrominated diphenylethers (PBDE), phthalates, polycyclic aromatic hydrocarbons (PAH), and perchlorate (Canadian environmental contaminants biomonitoring programs Citation2018; Woodruff, Zota, and Schwartz Citation2011). Several epidemiological and clinical studies demonstrated a link between EC exposure and increased risks of health impairments and diseases including neurological [Parkinson’s (Chhillar et al. Citation2013; Ismail et al. Citation2017; Weisskopf et al. Citation2010) and Alzheimer’s (Richardson et al. Citation2014)], reproductive (Han et al. Citation2016; Karwacka et al. Citation2017; Lenters et al. Citation2015; Veras et al. Citation2010), developmental (Li et al. Citation2018; Torres-Sánchez et al. Citation2013; Williams, Watson, and Desesso Citation2012), respiratory (0Gascon et al. Citation2014), metabolic diseases (Vafeiadi et al. Citation2016), as well as cancer (Bencko et al. Citation2008; VoPham et al. Citation2015). Recent epidemiological investigations reported positive correlations between exposure to persistent organic pollutants (PCB, OCP), metabolic diseases, and dyslipidemia in populations of Northern Canada (Inuits, First Nations from Northern Manitoba and Ontario) (Marushka et al. Citation2018; Singh and Chan Citation2017, Citation2018). Although single contaminants or simple mixtures (two to three chemicals) are often studied (Cory-Slechta Citation2005; Jung et al. Citation2013), environmental exposures more typically involve low levels of complex mixtures of chemicals.
Cross-fostering (adoption of a litter at birth) is an animal study procedure used in neuroscience (Fish et al. Citation2004) and toxicology (Crofton et al. Citation2000) to isolate the consequences of in utero events, such as chemical exposure, from those occurring after birth. Previously, testing a mixture reconstituted based upon reported chemicals detected in maternal blood of Northern Canadians (Butler Walker et al. Citation2003; Muckle et al. Citation2001), Desaulniers, Xiao, and Cummings-Lorbetskie (Citation2013) demonstrated that cross-fostering enhanced the adverse effects of developmental exposure to the mixture of EC on the glucocorticoid stress-response (GSR) in F1 (first generation) adult rats. In mixture-exposed groups, corticosterone concentrations remained elevated 30 min after stress created by tail bleed in the cross-fostered group, but not in those that were not cross-fostered. The selected doses were (1) low to intermediate relative to those of previous studies (Bowers et al. Citation2004; Chu et al. Citation2008); (2) did not markedly affect dam body weights or reproductive success; and (3) induced no overt signs of toxicity in the offspring. In addition, chemical residue levels in F1 adult males were comparable to those detected in humans (Desaulniers et al. Citation2017; Desaulniers, Xiao, and Cummings-Lorbetskie Citation2013). Using liver samples from the same rats, the objective of the current follow-up study was to determine the effect of cross-fostering in combination with developmental exposure to the EC mixture on hepatic gene expression profile at postnatal day 21 (PND21) and at PND78-86 in F1 males. The detection of a cross-fostering confounding effect on hepatic transcriptome might support our previous GSR observations (Desaulniers, Xiao, and Cummings-Lorbetskie Citation2013), and provide information for risk assessors to interpret other cross-fostering studies. Notably, it might improve evidence that non-chemical stressors (cross-fostering as a model) might modulate chemical-mediated effects.
Materials and methods
Animal exposure, cross-fostering procedures, and sample collection
Sprague-Dawley rats were acquired from Charles River Laboratories (St. Constant, Quebec, Canada). Treatment of rats and their housing conditions was approved by the Animal Care Committee of Health Canada and conformed to the Guidelines of the Canadian Council on Animal Care. Details on all animal manipulations, housing, acclimatization, breeding, assignment of females to treatment groups, mixture composition, dosing procedures with cookies, cross-fostering at birth, and culling procedures, were previously reported (Desaulniers, Xiao, and Cummings-Lorbetskie Citation2013).
The current manuscript focused on effects of cross-fostering on hepatic transcriptomes analyzed from rats of undisturbed (C, M) and cross-fostered litters (CC, MM), treated or not with the mixture (M), and reports data from F1 male pups at postnatal day (PND) 21, and in older siblings during the interval of PND78-86. The last dose was administered to the dams at PND20, and euthanasia at PND21 prior to weaning ensured maximal exposure without the potential confounding effect of weaning stress. Euthanasia of F1 adult males was performed during the interval of PND78-86 to ensure that the glucocorticoid stress-response data (Desaulniers, Xiao, and Cummings-Lorbetskie Citation2013) could be compared to the existing literature from young adult males (McCormick et al. Citation2000; Weaver et al. Citation2004).
describes the treatment groups, while the supplementary Table S1 presents the detailed chemical content of the mixture M, which was prepared based upon the maternal environmental contaminant blood profile measured in Canadian Inuits (Butler Walker et al. Citation2003; Muckle et al. Citation2001). The dose of 1 mg/kg/day was selected for the cross-fostering experiment based upon a previous study indicating that 5 mg/kg/day was toxic but not 0.5 mg/kg/day (Chu et al. Citation2008). A discussion of the dose relative to the lowest observable effect levels and margin of exposure (MOE), and of the achieved residue levels, is provided in Supplementary Table S6. To test the effects of cross-fostering, some litters from C and M treatment groups were transferred to different mothers at birth to create the following in utero/postnatal exposure combinations, CC, and MM. The first letter represents in utero exposure from the biological mother, whereas the second letter reflects exposure during nursing by the adopting mother.
Table 1. Description of the group names, treatments, and cross-fostered groups (adapted from Desaulniers et al. 2013).
Briefly, the solution of chemical mixture dissolved in corn oil was pipetted at a volume of 1 µl/g body weight and placed on cookies (Teddy Graham, Nabisco Ltd., Toronto, ON, Canada; approximately 2 g) that absorbed the entire solution. This procedure was developed as a stress-free dosing method for neurodevelopmental studies (Bowers et al. Citation2004). The volumes were adjusted daily for the dam’s body weight, and rats were dosed one cookie per day starting on gestation day 0 (identified by the presence of a vaginal plug or sperm in vaginal smear) until postnatal day (PND) 20. Dams were observed to ensure that the cookies were consumed entirely, and wastage was not an issue as mothers would eagerly eat the entire cookie immediately when given as treats apart from their normal diet. Livers were harvested and wrapped in aluminum foil, immediately flash frozen in liquid nitrogen, and stored at −80°C until RNA isolation.
RNA isolation and purification
RNA was purified from liver samples using the QIAGEN RNeasy (Qiagen, Mississauga, ON, Canada) extraction kit according to the manufacturer’s protocol. The RNase-free DNase (QIAGEN) kit was employed for on-column digestion of DNA during the RNA purification process. Purified RNA was eluted in 50 µl RNase-free water and stored at −80°C until use. The concentration of RNA was measured utilizing a NanoDrop ND-1000 spectrophotometer (NanoDropTechnologies, Wilmington, DE). The quality and integrity of RNA was assessed using an Agilent 2100 Bioanalyzer (Agilent Technologies Inc., Mississauga, ON, Canada). RNA samples with RNA integrity number (RIN) above 8.5 were used for subsequent microarray and RT-qPCR analyses.
Microarray analyses
Microarray experimental design
Samples from 8 male pups from 8 different litters per treatment group were randomly selected at PND21 and PND78-86. RNA from pairs of rats in the same treatment group were randomly pooled together and thus each treatment group was represented by 4 microarrays. The analysis was performed using Agilent 8X60K high-density slides (SurePrint G3 Rat GE 8x60k Kit # G4853A), which contained 8 microarrays per slide.
Cross-fostering effects are reported here based upon comparison C vs CC and M vs MM. However, the original study tested multiple mixtures with 9 treatment groups, among which 5 were undisturbed and tested dose-response effects and increasing abundance of aryl hydrocarbon-receptor (AhR)-agonists (C, 0.5M, M, AhR, 0.5MAhR), whereas 4 groups tested effects of cross-fostering (CC, MC, CM, MM) (Desaulniers, Xiao, and Cummings-Lorbetskie Citation2013). The groups MC, CM, at PND21 and at PND78-86, as well as the groups 0.5M and 0.5MAhR at PND78-86 were not examined using microarrays. Some microarray data from the groups 0.5M, AhR, and 0.5MAhR are presented here in the main document only to support the performance of the microarray assays (i.e. sensitivity to detect effects of AhR-agonists and dose-response effects across the mixtures AhR, 0.5M, 0.5MAhR, and M). The chemical content and discussion of the effects of these additional mixtures are described in the supplementary document. The microarray designs were as follows.
At PND21, 7 treatment groups were investigated (C, AhR, 0.5M, M, 0.5MAhR, CC, and MM). Samples (4 samples/group) from groups C, AhR, 0.5M, and M were hybridized using two slides with two microarrays from each treatment group on each slide. For the cross-fostering comparison, the 4 microarrays for group CC were compared to those of group C utilizing one slide, and similarly for the group MM and M comparison (4 microarrays per treatment group).
At PND78-86, effects of treatment on gene expression were expected to be subtle given that the rats were exposed only developmentally, therefore comparisons were established within slides. Three aliquots were prepared from group C, and treatment groups compared as follows: group M and C were hybridized to one slide; group AhR and C on a second slide; group CC and C on a third slide; and finally, group MM and M on a last slide. Agilent Feature Extraction Software version 11.0.1.1 (Agilent Technologies) was employed for data extraction and complete dataset may be found in the Gene Expression Omnibus (http://www.ncbi.nlm.nih.gov/geo/, accession number GSE109019).
cDNA synthesis and array hybridization
Total RNA (200 ng) from exposed and control groups, as well as universal reference total RNA (Agilent Technologies) were employed to synthesize complementary DNA (cDNA) and cyanine labeled complementary RNA (cRNA), using Low Input Quick Amp Labeling Kit (Agilent Technologies) according to manufacturer’s instruction. Cyanine-labeled cRNAs were synthesized using T7 RNA polymerase and in vitro transcription kits (Agilent Technologies). cRNA was then purified using RNeasy Mini Kits (Qiagen). Cyanine 5-CTP (Cy-5) was used to label the sample, and universal reference RNAs were labeled with cyanine 3-CTP (Cy-3).
Cy-3 labeled reference cRNA (300 ng) was then mixed with equal amounts of Cy-5 labeled cRNA samples and hybridized to microarrays (Agilent Technologies) for 17 hr in a hybridization chamber at 65°C with a rotation speed of 10 rpm. Microarray slides were washed and scanned on an Agilent G2505C scanner at 3 μm resolution, according to manufacturer’s instructions.
Data analysis
A reference design (Kerr Citation2003; Kerr and Churchill Citation2001) with the sample labeled in Cy5 and universal reference RNA labeled in Cy3 was used to analyze data. All data analyses were conducted using the R (R Core Team Citation2015) statistical environment. The median signal intensities were normalized using the global LOcally WEighted Scatterplot Smoothing (LOWESS) method (Yang et al. Citation2002) using the MAANOVA library (Wu et al. Citation2002). Differentially expressed genes (DEG) were identified using the MAANOVA library. The ANOVA model included the main effect of treatment and array as a block effect. The Fs statistic (Cui et al. Citation2005), a shrinkage estimator, was employed for gene-specific variance components and associated p-values for all the statistical tests were estimated using the permutation method with residual shuffling (30,000 permutations). The p-values were then adjusted (FDR p-values) for multiple comparisons using the false discovery rate approach (Benjamini and Hochberg Citation1995) to reduce false positives. The least-squares means (Goodnight and Harvey Citation1978; Searle, Speed, and Milliken Citation1980) were utilized to estimate the fold change (FC) for each pairwise comparison. Pairwise comparisons for individual genes were considered if all samples (n = 4) for one of the groups had signal intensities above the background distribution estimated by the trimmed mean plus 3 standard deviations of the negative control probes (3xSLv1) (Dong et al. Citation2007). To elucidate the influence of chemical mixtures the following comparisons were conducted: M vs C, 0.5M vs C, AhR vs C, 0.5MAhR vs C at PND21, and M vs C, AhR vs C at PND78-86. To determine the effect of cross-fostering, CC vs C and MM vs M for both age groups were tested.
To test the consistency of microarray results, hierarchical cluster analysis (HCA) and principal component analysis (PCA) were conducted using the DEG (FDR p-value <0.05; FC > |1.5|). A scatterplot of the first two principle components was generated. Each point on the scatterplot represents one sample (i.e. one array). This enabled visualization of the consistency between replicates and differences between treatment groups. With the list of DEG, an HCA was conducted using average linkage and the one minus the Spearman correlation dissimilarity metric. To analyze the effects of cross-fostering by PCA, data for the control (C) and the cross-fostered control samples (CC) were centered using the median of the control samples (C). Similarly, the mixture (M) and cross-fostered mixture samples (MM) were centered utilizing the median of mixture samples (M). This approach, as well as having the C and CC microarrays on one slide and the M and MM groups on a different slide, was adopted to optimize sensitivity given that only small effects of cross-fostering were expected. All analyses were visualized employing heat maps and dendrograms.
Functional analysis
In order to interpret the results in the context of biological processes and identify regulatory networks potentially affected in the liver of chemical-treated and cross-fostered rats, bioinformatics analysis was performed using Qiagen’s Ingenuity® Pathway Analysis (IPA®, Qiagen Redwood City, www.qiagen.com/ingenuity). The DEG with their log2 fold changes and FDR p-values (Table S2) for each comparison were analyzed in IPA using upstream regulator analysis, canonical pathway, and network analysis. In these analyses, the SurePrint G3 Rat GE 8x60k microarray (V2) was employed as a reference set for transcriptomics data and included all data sources from Ingenuity Knowledge Base (IKB), while restricted to specific species (Rat and Mouse) and tissues (liver and cell lines).
Validation of microarray data by quantitative real-time PCR (RT-qPCR)
DEG were selected for RT-qPCR validation (Suppl. Table S3) using custom-made PCR arrays containing proprietary primers (RT2 Profiler PCR Array: CAPR10984, Qiagen and PrimePCR SYBR green assays, Bio-Rad). The RNA samples used in the microarray experiment were also employed for RT-qPCR. Total RNA was reverse transcribed utilizing the RT2 First Strand cDNA kit according to the company’s protocol. RT-qPCR was performed on a C-1000 thermal cycler (Bio-Rad) according to the protocol provided by the RT2 SYBR green kit (Qiagen/Bio-Rad). Expression values were normalized to the mean of the three endogenous controls: β-actin (Actb), Ribosomal protein large P1 (Rplp1), and Ribosomal protein L13A (Rpl13a). Based upon microarray and PCR data, treatments did not markedly affect these endogenous control genes. The quality of the Ct values was assessed using online software provided by SABiosciences at http://pcrdataanalysis.sabiosciences.com/pcr/arrayanalysis.php. Fold changes were calculated according to the 2−ΔΔCt method (Livak and Schmittgen Citation2001).
Results
This manuscript focused on the effects of cross-fostering based upon comparisons M vs C, CC vs C, and MM vs M in the PND21 and PND78-86 F1 males. Partial results related to the effects of the other mixtures (AhR, 0.5M, 0.5MAhR) are presented here only to support the assay performance; however, the complete dataset and discussion on the effects of these mixtures are presented in the supplementary document.
Effects of mixtures as indication of assay performance
The reliability of the microarray data is supported by the dose-response effects observed across treatment groups based upon (1) magnitude in gene expression, (2) the numbers of DEG, and (3) PCA and HCA. The Cyp gene family, particularly Cyp1a1, is inducible by many of the organochlorines present in the mixture, and provide an example of a dose-response pattern detected by the microarray analyses at PND21 (). The fold changes relative to control for Cyp1a1 were 5.5, 13.9, 20.9, and 25.7 in the AhR, 0.5M, 0.5MAhR, and M groups, reflecting the 2,3,7,8-tetrachlorodibenzo-p-dioxin-toxic equivalent (TCDD-TEQ) doses of 1.8, 4.1, 6.3, and 8.2 ng/kg/day in the AhR, 0.5M, 0.5MAhR, and M group, respectively (Table S1). The fold changes for Cyp2b2 were 3.7, 4.2, and 8.7 in the 0.5M, 0.5MAhR, and M groups, respectively. Other Cyp genes (1a2, 2a3, 2c6, and 2c7) were expressed to a greater extent in the M than in 0.5M or 0.5MAhR groups, also reflecting a dose-response pattern. These fold changes and other alterations are provided in the supplementary Table S2, which also indicates accession numbers, gene symbols, names, and FDR p-values for the list of all DEG.
Figure 1. Fold changes in Cyp genes found to be differentially expressed (FDR p ≤ 0.05; FC ≥ |1.5|) by microarray analyses in AhR, 0.5M, 0.5MAhR, and M treated groups relative to the control group at PND21. Bars are missing in absence of a statistically significant effect (data in Table S2 Loc293989 = Cyp2c6).
Dose-response changes in the number of DEG (FDR p ≤ 0.05; FC ≥ |1.5|) were observed at PND21 (), with one, 4, 37, and 56 DEG in the AhR, 0.5M, 0.5MAhR, and M groups, respectively, with the chemical dose increasing from 39.8 ng/kg/day for the AhR mixture, to 1 mg/kg per day for the mixture M (Table S1). Secondly, the AhR treatment was associated with a larger number of DEG at PND78-86 (n = 31) than at PND21 (n = 1), suggesting a delay in the induction of DEG.
Figure 2. Numbers of differentially expressed genes (DEG) (FDR p ≤ 0.05; FC ≥ |1.5|) between the control and the AhR, 0.5M, 0.5MAhR, M, and the CC groups, as well as between the M and the MM group, from the microarray analyses in the male rat livers at PND21 and PND78-86. The numbers of DEG showed a dose-response effect at PND21, reflecting the amount of chemicals and TCDD-TEQ present in the mixtures (1.8, 4.1, 6.3, and 8.2 ng/kg/day TCDD-TEQ for the AhR, 0.5M, 0.5MAhR, and M groups, respectively). The groups 0.5M and 0.5MAhR at PND78-86 were not analysed by microarray.
The PCA and HCA applied to the lists of DEG demonstrate the reproducibility of the gene expression profiles between rats within treatment groups, and ability of microarrays to detect treatment-related effects (). The PCA of the AhR, 0.5M, and M vs C comparisons at PND21 ()) demonstrated that 71.3% of the variability in the dataset was explained by the first two principle components (PC). The first PC accounted for 64.5% of the variability, mostly as a contrast between the M and C treatment groups, and the second PC 6.8% of the variability. The heatmap ()) illustrates that samples within treatment groups cluster together indicating high correlations for those samples within the same treatment groups. Similar to PND21, the PCA at PND78-86 differentiated the treatment groups ()) mostly due to a contrast between the C and the M group. Here, PC1 and PC2 accounted for 64.8% (PC1: 52.1% + PC2: 12.7%) of the variability in the dataset. The HCA shows that samples of the M treatment clustered generally together with the highest degree of similarity. Effects measured at PND78-86 in the AhR and M treatment groups are due to the remaining chemical residues at that time (Desaulniers et al. Citation2017), and to the chronic effects of developmental exposure that may generate data variability.
Figure 3. Principal Component Analysis (PCA) represented by two-dimensional scatter plot (Figure 3(a,c)), and hierarchical cluster analysis (HCA) (Figure 3(b,d) based on the list of DEG (FDR p ≤ 0.05; FC ≥ |1.5|) from the comparisons of the treatment groups at PND21 (Figure 3(a,b), and at PND78-86 (Figure 3(c,d). Treatment groups were manually circled to facilitate identification and clustering in the PCA plots. In the hierarchical cluster analyses the rows represent the probes for genes with increased (red) and decreased (green) expressions (black unchanged relative to controls).
Overall, the dose-response effects of the mixtures on Cyp expressions, on (1) number of DEG, (2) PCA and HCA, as well as (3) list of DEG validated by RT-qPCR (Table S3), demonstrate the reliability of the methodologies.
Influence of cross-fostering by Venn diagram analyses
) uses Venn diagram to illustrate that among the 45 genes affected by cross-fostering at PND21 (CC vs C), three genes (Cyp2c7, and Ubd in region B, and Sult1b1 in region D) were also differentially expressed in the M vs C comparison. However, the mechanisms affecting these three genes by treatment M or by cross-fostering may not be equivalent; while the fold change for Sult1b1 was in the same direction (up-regulated) for the CC and M groups, it was in the opposite direction for Cyp2c7 and Ubd (increased by M but reduced by cross-fostering in the CC group, Table S2). ) also shows that cross-fostering modulated expression of 16 genes in rats treated with M (evident in the MM vs M comparison). Cross-fostering either diminished the magnitude of the M-induced expression of genes, as observed with Cyp2c7 and Ubd (region B), or amplified the effect of M (in one direction or the other) generating a list of 14 DEG (region A) that were not significantly altered in the M vs C comparison (region E). The expression of the aryl hydrocarbon-receptor nuclear translocator-like gene (Arntl) was not markedly affected in the comparison M vs C at PND21 (FC = −1.06), but significantly lower (1.8-fold) in the MM group relative to M (Table S2).
Figure 4. Venn diagram illustrating DEG (FDR p ≤ 0.05; FC ≥ |1.5|) in the comparisons of group (a) CC vs C, M vs C, and MM vs M at PND21; and (b) CC vs C, M vs C, and MM vs M at PND78-86. In Fig. 4A, the 14 genes in region “a” were: Akr1c1, Akr1c12, Arntl, Cyp2d3, Cyp2j3, Dbp, Hsd17b6, Loc689316, Lcn2, Ppapdc1a, Retsat, Rup2, Tff3, Tpt1. The two genes in region “b” were Cyp2c7 and Ubd, while the 42 genes in region “c” were: Abcb11, Actn3, Ccl21, Cmya5, Cox8b, Cpa1, Cpa2, Cpb1, Cpt1b, Cryab, Ctrb1, Des, Eno3, Fabp3, Fdps, Fgb, Fhl1, Gck, Hamp, Hrc, Igtp, Jsrp1, Klkb1, Loc688173, Lmod2, Mgc108823, Mb, Myh8, Myl4, Mylpf, Pla2g1b, Ppp1r1a, Rnase1, Slc25a30, Slc35c2, Spink3, Tnnc1, Tnnc2, Tnni2, Tnnt1, Tpm1, Upk1b. Region “d” included Sult1b1 and region “e” included 53 genes: A2m, Alas1, Aldh1a1, Aldh1a7, Aldh1b1, Apoa2, Ces1c, Ces2a, Ces2i, Ces2j, Cesl1, Cyb5a, Cyp17a1, Cyp1a1, Cyp1a2, Cyp2a1, Cyp2a3, Cyp2b2, Cyp2c37, Cyp3a23/3a1, Defa10, Entpd5, Ephx1, Gsta3, Gsta4, Gsta5, Gstm2, Loc100359554, Loc293989, Loc310902, Loc494499, Loc680955, Maged2, Mmd2, Nat8, Nfil3, Nqo1, Nr0b2, Onecut1, Pbld, Pir, Prkcdbp, Rgd1564906, Ratnp-3b, Selenbp1, Slc16a11, Slc34a2, Tsku, Ugt1a6, Ugt2a3, Ugt2b1, Ugt2b37. In Figure 4(b), the 16 genes in region “a” were: Aldh1a7, Cyp2b2, Cyp2c12, Fgl1, Hbb-b1, Inhbc, Loc305806, Loc689316, Oas1a, Oas1k, Pcolce, Rt1-n1, Rab17, Srd5a1, Tfr2, Wfdc3. The ten genes in region “b” were: Acot5, Apoa5, B3galt1, Cdh17, Dbp, Rgd1560527, Rt1Aa, Slc13a5, Sult2al1, Ubd. The two genes in region “c” were Akr1c12 and Akr1c2 while the one in region “d” was Slc35c2. Finally, the 59 genes in region “e” were: Abcg5, Acsm3, Akr1c1, Bhlha15, C6, Casp12, Cav1, Cidea, Ctnnal1, Ctnnd1, Cyp4a2, Dcn, Dusp26, Efemp1, Efna1, Eif4ebp3, Esm1, F9, Fabp4, Fam111a, Fgf21, Frzb, Gfra1, Gfra2, Gpm6a, Gpsm1, Hist1h1d, Hspa1b, Hspb1, Igfbp6, Inmt, Isg20, Kcnk2, Loc287167, Loc310926, Loc501437, Loc678704, Loc690226, Loc690435, Lox, Lrp5, Ltc4s, Mlc1, Myo7b, Nfatc4, Nrarp, Parp14, Psd, Rgd1561849, Rgd1564865, Rt1-bb, Rgs4, Sdr16c6, Serpinb7, Tap2, Thumpd1, Tpd52l1, Usp9x, Vom2r34.
The list of DEG obtained by the CC vs C comparison at PND21 ()) varies from that obtained at PND78-86 ()), indicating that cross-fostering yielded different hepatic gene expression profiles in both age groups. This observation is analogous to the long-term effects of the mixture M, which induced different DEG at PND21 than at PND78-86. ) reveals that three DEG were detected in the CC vs C and M vs C comparisons with similar fold changes in magnitude and direction (Akr1c12 and Akr1c2 in region C with decreased expression, and Slc35c2 in region D with enhanced expression). The MM vs M comparison demonstrates that cross-fostering modulated the influence of M. The Akr1c12 and Akr1c2 (region C) expression levels were reduced by M (in M vs C comparison, 1.7- and 2.1-fold down-regulated, respectively), while expression of these genes rose in group MM relative to M (1.9- and 2.3-fold up-regulated, respectively) (Table S2), supporting that cross-fostering antagonized the effects of M for these two genes.
Influence of cross-fostering by principal component and hierarchical cluster analyses
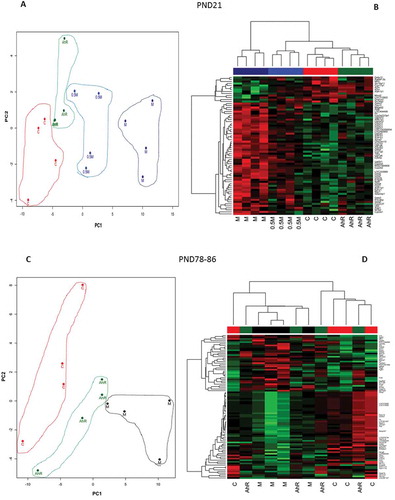
The PCA at PND21 ()) illustrated that there is less of a clear separation between treatment groups, although 62.2% of the variability in the datasets was attributed to the first two PC (PC1 48.0% + PC2 14.2%). Here, PC1 might account for the variability of the two CC arrays compared to the rest of the samples. PC2, on the other hand, appears to be a contrast between two MM samples and the rest of the data. The HCA ()) shows two CC and two MM samples clustering early, but variation among samples is higher, and lower correlations were found within treatment groups. The C and M groups appear uncorrelated, but as indicated in the method, in order to compare the cross-fostering effect from CC to C with MM to M comparison, data were further normalized using their respective controls. In this analysis, the C and M conditions represent the baseline expression centered at zero. Thus, the distribution of the C and M samples in the cross-fostering analyses (as well as at PND78-86) represents uncorrelated random noise. Overall, at PND21 both PCA and HCA suggest that cross-fostering effect was subtle and perhaps only some rats may have been affected by the cross-fostering procedures.
Figure 5. Principal Component Analysis (PCA) represented by two-dimensional scatter plot (Figure 5(a,c), and hierarchical cluster analysis (Figure 5(b,d) using the DEG (FDR p ≤ 0.05; FC ≥ |1.5|). The DEG lists were derived from the comparisons of the treatment groups CC vs C and MM vs M at PND21 (Figure 5A and B); and CC vs C and MM vs M at PND78-86 (Figure 5(c,d). Treatment groups were manually circled to facilitate identification and clustering in the PCA plots. In the hierarchical cluster analyses the rows represent the probes for genes with increases (red) and decreases (green) in expression (black unchanged relative to controls).
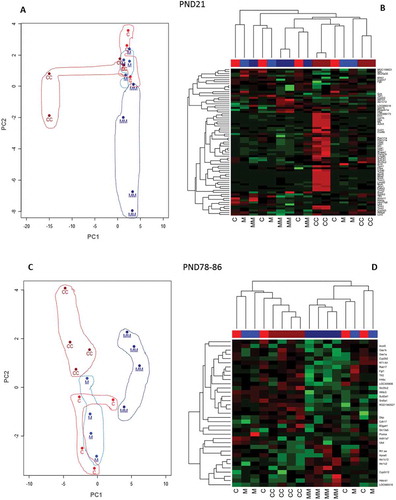
At PND78-86 (,), the PCA and HCA noted some effects of cross-fostering. The PCA accounted for 44.8% (PC1 32.8% + PC2 12.0%) of the variation in the dataset. Here, PC1 contrasts MM group with the rest of the treatment groups, whereas PC2 appears to be a contrast of CC and MM groups to C and M treatment groups, respectively, with the exception of one of the MM samples. Both the PCA ()) and HCA ()) show the CC and MM groups forming two clusters. These observations, based upon a small number of DEG, support subtle cross-fostering effects, and perhaps a delay in induction of a more homogeneous cross-fostering influence on the liver transcriptome when results at PND78-86 as compared to those at PND21.
Functional analyses of differentially expressed genes by ingenuity pathway analysis (IPA)
The following sections compare effects of the mixture M at PND21 and at PND78-86, as well as cross-fostering effects (CC vs C and MM vs M), through identification of enriched upstream regulators (UR), canonical pathways (CP) and network/top functions, as predicted by IPA.
Comparison of M vs C at PND21 and at PND78-86
DEG used to predict upstream regulators (URs with Z score ≥ |2| and p < 0.01) and canonical pathways (CP with [–log (p < 0.01)] >2) potentially altered in group M at PND21 are identified by “x” in . Altered activities from 8 UR are suggested in group M; 6 of these (AHR, NR1I2, NR1I3, NFE2L2, HNF4, and PPARGC-1α) are predicted to be activated, and two to be inhibited (IL-1α, and IL-1β). Analysis of the DEG revealed 22 altered CP including AHR signaling, PXR/RXR activation, LPS/IL-1 mediated inhibition of RXR function, NRF2-mediated oxidative stress response, and PPARα/RXRα activation pathways. Globally, these enriched UR and CP may be broadly categorized into 5 functions: xenobiotic metabolism, inflammation, oxidative stress, lipid/energy metabolism, and endocrine system.
Table 2. Significant canonical pathways (CP) and upstream regulators (UR in bold) identified from DEG (FDR p ≤ 0.05 and FC ≥ |1.5|) in PND21 M rat livers. Arrows indicate if the DEG were up (↑), or down (↓) regulated.
Table 2. (Continued.)
summarizes top functions identified by gene networks generated with IPA based on the relationships among DEG derived from the comparisons of M vs C groups at PND21 and at PND78-86. In M treated rats at PND21, drug metabolism and glutathione depletion were identified as top hepatic functions potentially affected. These are functions similar to xenobiotic metabolism and oxidative stress previously identified in . In addition, lipid metabolism and small molecule biochemistry were predicted to be affected in both age groups. Other top functions not detected at PND21, but identified in the M group at PND78-86, included molecular transport, cell cycle, cancer, and gastrointestinal disease. Moreover, bile acid biosynthesis was a CP identified in the M group at PND78-86 () but not at PND21 (). There was no significant UR identified for the comparison M vs C at PND78-86. Overall, these observations suggest transient induction of xenobiotic/drug metabolism and oxidative stress, but persistent metabolic disturbances evident through different DEG at both time points, all of which may be conducive to disease development.
Table 3. Top functions identified by gene networks, and canonical pathway (CP), associated with DEG (FDR p ≤ 0.05 and FC ≥ |1.5|) in the liver of M treated rat at PND21 and PND78-86. Arrow represents up (↑) or down (↓) regulation
Influence of cross-fostering at PND21 and PND78-86
summarizes IPA predictions for effects of cross-fostering in untreated rats (CC vs C) at PND21 and at PND78-86. The analysis at PND21 revealed 11 enriched CP and one UR (LEP - predicted to be inhibited) potentially affected by cross-fostering. Because of the few DEG at PND78-86, there was no significant UR and only one CP (TR/RXR activation) associated with cross-fostering. Energy production was enriched only at PND21, and molecular transport was enhanced only at PND78-86. Interestingly, lipid metabolism and small molecule biochemistry are top functions predicted to be perturbed in both age groups but by different DEG (except for Ubd down-regulation in both age groups).
Table 4. Top functions identified by gene networks, canonical pathway (CP), and upstream regulators (UR, bold), respectively, associated with DEG (FDR p ≤ 0.05 and FC ≥ |1.5|) in the livers of CC rats at PND21 and PND78-86. Arrows represent up (↑) or down (↓) regulation
describes the results of IPA for MM vs M comparisons in both age groups. Lipid metabolism, small molecule biochemistry, and vitamin and mineral metabolism were identified as enriched top functions potentially modulated by cross-fostering in both age groups. These top functions were identified based upon DEG that differed with age. Five enriched CP were affected by cross-fostering at PND21 based upon three DEG (Akr1c1, Cyp2c7, Cyp2d3; ). The comparison of the expressions of these three genes and of Ubd in the MM vs M and M vs C groups suggests a pattern for cross-fostering effects at PND21. Notably, two of these DEG were not affected in the M vs C comparison (Akr1c1 and Cyp2d3), while the third one (Cyp2c7) was increased by M () but down-regulated at PND21 in the MM compared to M group. Moreover, Ubd was upregulated in the M group (M vs C, ), but downregulated in MM vs M comparison (). Therefore, these 4 examples at PND21 suggest that cross-fostering reduced the magnitude of changes in gene expression induced by M. No significant UR was identified at PND21, and no significant CP or UR were identified at PND78-86.
Table 5. Top functions identified by gene networks and canonical pathway (CP), associated with DEG (FDR p ≤ 0.05 and FC ≥ |1.5|) in the livers of cross-fostered M treated rats at PND21 and PND78-86. Arrows represent up (↑) or down (↓) regulation.
Overall, cross-fostering effects in control (, CC vs C) and M treated rats (, MM vs M) were detected, but considering the small number of DEG and fold changes (Table S2), these effects appear to be subtle.
Discussion
The current study demonstrated that cross-fostering induces differences in gene expression between control groups (CC vs C) and modulates effects of developmental exposure to the EC mixture on hepatic transcriptomes at PND21 and at PND78-86. To our knowledge, this is the first investigation of influence of cross-fostering on the hepatic transcriptome. These data are in addition to previously reported observations from the same experiment, which indicated that cross-fostering amplified the adverse effects of exposure to the mixture on the glucocorticoid-stress response in adult rats (Desaulniers, Xiao, and Cummings-Lorbetskie Citation2013). Collectively, these findings suggest an interaction between treatment and cross-fostering, and warrants careful interpretation of other cross-fostering studies in the risk assessment process. Importantly, this investigation shows that non-chemical stressors may modulate chemical-mediated effects.
The current PND21 hepatic transcriptome data highlight two other significant concepts. First, the dose-response pattern in number of DEG and in Cyp1a1 mRNA abundance reflected the TCDD-TEQ doses across groups. Consequently, these results support the use of the TCDD-TEQ system (Van Den Berg et al. Citation2006) in risk assessment procedures to assess biological potencies of AhR-agonists in complex mixtures. Second, in all comparisons the DEG differed between age groups. In general, the early gene sets at PND21 were associated with xenobiotic detoxification, oxidative stress, energy and retinoid metabolism, and immune responses, whereas at PND78-86 different gene sets were associated with retinoids and energy metabolism as potential long-term consequences. The chronic effects were subtle, perhaps given that the chemical residue levels in these rats declined to concentrations similar to those encountered in some human populations (Desaulniers et al. Citation2017). Although species differences obscure interspecies extrapolation (Fader and Zacharewski Citation2017), the DEG at PND78-86 might assist in predicting mechanisms conducive to disorders previously described in EC exposed human populations (Andersen et al. Citation2014; Kuwatsuka et al. Citation2014; Mitoma et al. Citation2015; Warner et al. Citation2013), including dyslipidemia in Northern Canadian populations (Marushka et al. Citation2018; Singh and Chan Citation2018).
The following sections discuss the transcriptomic effects among groups C, CC, M, and MM, with supportive biochemical measurements previously published from the same rats (Desaulniers, Xiao, and Cummings-Lorbetskie Citation2013; Citation2017), or from studies testing other preparations of the same or similar mixtures (Chu et al. Citation2005, Citation2008; Elabbas et al. Citation2014).
Influence of developmental exposure to mixture M at PND21
Functional analysis of the list of DEG in IPA identified nuclear receptors (AHR, PXR, CAR, RXR, PPARGC-1α, NRF2, HNF4α) that are upstream regulators of pathways predicting induction of oxidative stress, xenobiotic/drug, hormone (thyroid, steroids), and lipid metabolisms. The IPA prediction of induction of oxidative stress is in agreement with studies observing elevated hepatic glutathione S-transferase (GST) activities in Sprague-Dawley rats exposed to TCDD (Baars, Jansen, and Breimer Citation1978) or to non-ortho or ortho-chlorinated PCB (Lamartiniere, Dieringer, and Lucier Citation1979; Twaroski, O’Brien, and Robertson Citation2001), which are present in the mixture. The current rats exhibited increased activities of the major liver enzymes involved in xenobiotic metabolism, including CYP1A, 2B, and 3A (Desaulniers et al. Citation2017). These enzymes alter steroid metabolism. It is of interest that developmental exposure to a different preparation of the same mixture favored the production of catechol estrogens (Desaulniers et al. Citation2012). Finally, the occurrence of altered lipid and retinoid metabolism is well-established. Developmental exposure studies with a different preparation of the current mixture reported that rats at PND35 exhibited elevated serum cholesterol levels at a dose of 5 mg/kg bw/day, but not at 0.5 mg/kg bw/day (Chu et al. Citation2008), and a dose of 0.05 mg/kg bw/day decreased abundance of hepatic retinol (Elabbas et al. Citation2014). The latter effect on retinoids occurs at the lowest observable effect level (LOEL) induced by this or similar mixtures. The up-regulation of Cyp2c7 [alias Cyp2c39 (Andreola et al. Citation2004; Fan et al. Citation2004)], and Ces (Mello et al. Citation2008) support the presence of altered retinoid (vitamin-A and its metabolites) metabolism.
IPA suggests inhibition of the upstream regulators interleukin-1α (IL-1α) and IL-1β, supporting alterations of the immune response pathways. Other investigators found that IL-6, IL-1α, and IL-1β down-regulation was induced by PXR activation in mouse liver (Moreau et al. Citation2007; Zhou et al. Citation2006), or by AhR-agonist exposure (Li et al. Citation2017; Stockinger et al. Citation2014), and immunosuppression by cis- and trans-nonachlors (two compounds present in the mixture M) exposure in rodents (Tryphonas et al. Citation2003). Chu et al. (Citation2005, Citation2008), using a mixture and exposure protocol similar to the current experiment but at a higher dose (1.3 or 5 mg/kg bw/day), observed mild inflammation in histological sections from livers of rat offspring. In the current study, some DEG at PND21 (down-regulated Nfil3, α2M, Mmd2, Defa10, Ratnp-3b, and up-regulated Ceacam10) indicate impairment of innate immunity and of hepatic acute-phase protein system (Suppl. section S3.4). Collectively, these findings suggest that the immune system is less efficient in EC-exposed animals. It is interesting to note that a high rate of infectious disease was observed in Northern populations exposed to persistent pollutants (Kazbariene, Krikstaponiene, and Monceviciute-Eringiene Citation2006).
Finally, there are numerous markers of preneoplastic foci measured at PND21 including up-regulation of Gsts, α2M, Ubd (alias FAT10) (French Citation2010; Kimura et al. Citation2016; Ren et al. Citation2006), Mage-d2 (Hashimoto et al. Citation2015), and Entpd5 (Vogiatzi et al. Citation2016), and down-regulation of Slc34a2 (Li, Chen, and Lu Citation2016; Yang et al. Citation2014). The fact that chronic exposures to many of the chemicals present in the mixture are known to induce hepatocarcinomas in rodents (Brown et al. Citation2007), raises interest in the possibility that such potential preneoplastic markers might be detectable as early as PND21. However, the detection of neoplastic markers is not necessarily an indication of cancer development given that neoplastic sites might be transient.
Effects of developmental exposure to mixture M at PND78-86
In contrast to rats at PND21, mRNA levels of detoxification enzymes at PND78-86 were not significantly different from control, which is in agreement with the low chemical residue levels and absence of induced p450 activities in these rats (Desaulniers et al. Citation2017). Nevertheless, DEG at PND78-86 suggest effects on energy (lipid/glucose) and retinoid metabolism, molecular transport, small molecule biochemistry, bile acid biosynthesis, pro-inflammatory mechanisms, cell cycle, and contribution to diseases ( and ).
DEG at PND78-86 indicated altered retinoid metabolism and bile acid biosynthesis. Akr1c1 (AKR1C4 in human), Akr1c2 (AKR1C1 in human) and murine-specific Akr1c12, were down-regulated (indicative of cholesterol and bile acid metabolism deregulation), while Sdr16c6 was up-regulated in the M group, potentially contributing to altered retinoid metabolism. These aldo-keto reductase transcripts (AKR families) are phase I metabolizing enzymes that catalyze conversion of aldehydes and ketones to their corresponding alcohols, and thus reduce a variety of lipophilic substrates including xenobiotics, steroids, prostaglandins, bile acids, and retinoids (Rizner and Penning Citation2014; Ruiz et al. Citation2012). In the opposite enzymatic direction, the short-chain dehydrogenase/reductase SDR16C family members (Sdr16c6 up-regulated here) are thought to oxidize retinol to retinaldehyde (Adams et al. Citation2017). Depletion of vitamin-A (fat soluble retinoids) is one of the most sensitive markers of exposure to TCDD (Fletcher, Hanberg, and Håkansson Citation2001). Morse and Brouwer (Citation1995) noted effects on the retinoid system until at least PND90 after gestational exposure to the highly toxic PCB mixture Aroclor 1254 at doses of 5 or 25 mg/kg body weight. Using a mixture similar to ours, Elabbas et al. (Citation2014) observed decreased abundance of hepatic retinol in the livers of male offspring at PND35, but increased abundance at intermediate doses (0.05 and 0.5 mg/kg/day) relative to control in both F1 males and females at PND77. The persistent deregulation of retinoid metabolism and its health impacts warrants further investigation.
DEG at PND78-86 suggested altered energy metabolism, steatosis, and inflammation, which may be conducive to diseases. The relationships among the up-regulated DEG Fabp4, Cav1, Cyp4a2, and Fgf21, are indicative of activation of the PPAR pathway (Su et al. Citation2005), and long-term altered lipid and glucose metabolism. In addition, down-regulation of Acsm3, which activates fatty acids by forming a thioester with coenzyme A (Watkins et al. Citation2007), and down-regulation of Cidea coding for a lipid droplet component (Xu et al. Citation2016), are evidence of altered energy metabolism. Lrp5, Frzb, Ctnnal1, and Slc35c2 are DEG that may further support effects on lipid metabolism and/or early carcinogenic events (Suppl. section S4.1). LRP5 plays a role in lipolysis as an endocytotic receptor mediating the clearance of apoB- and apoE-containing lipoproteins (Julve et al. Citation2016). The up-regulation of Frzb and Lrp5, and down-regulation of Ctnnal1, support changes in the Wnt/β-catenin canonical signaling pathway which regulate the expression of genes involved in cholesterol and glucose metabolism (Fujino et al. Citation2003), liver injury, and tumorigenesis (Fan et al. Citation2011; Merdek, Nguyen, and Toksoz Citation2004; Monga Citation2015; Zhang et al. Citation2016). Slc35c2 (solute carrier family 35 member C2) when up-regulated (as noted here) was found to compete with Slc35c1, and such alterations were linked to cancer (Lu et al. Citation2010; Mehta et al. Citation2016). Mixture-induced inflammatory events may be attributed to interactions among the DEG Fabp4 [a multiple role hepatic gene (Hu et al. Citation2017; Leroux et al. Citation2012)], with C6, and Casp12 (Jimenez and Lamkanfi Citation2015; Sarma and Ward Citation2011) (Suppl. section S4.1). Collectively, DEG noted at PND78-86 might provide an indication of intermediary steps linked to steatohepatitis and/or early carcinogenic events. This is supported by observations of enhanced hepatic inflammation and steatosis associated with cholesterol accumulation and alterations in fatty acid profile in rats treated with similar mixtures of contaminants (Chu et al. Citation2005, Citation2008; Mailloux et al. Citation2014), and by increases in liver cancer incidence in rats chronically exposed to industrial PCB mixtures (Brown et al. Citation2007).
Influence of cross-fostering (CC vs C and MM vs M)
Data suggested subtle cross-fostering effects in both age groups on energy metabolism (lipids, glucose) in control groups (CC vs C), and a modulation of energy, retinoid, and steroid (glucocorticoid) metabolisms among mixture treated rats (MM vs M).
DEG related to energy (glucose, lipid) and retinoid metabolism in CC vs C at PND21
DEG that are down-regulated (Gck, Abcb11, and Cyp2c7) and up-regulated (Cpt1b, Fabp3, Fdps) in CC compared to C group suggest altered energy (glucose/lipid) metabolism. Gck and Cpt1b are major energy metabolism genes. Gck codes for glucokinase, which catalyzes a rate-limiting step for the entry of glucose into the glycolytic pathway producing pyruvate to fuel the mitochondrial TCA cycle, while carnitine palmitoyltransferase 1B (Cpt1b, up-regulated here) catalyzes transport of long-chain fatty acyl-CoAs from the cytoplasm to carnitine for translocation across the mitochondrial inner membrane (McGarry and Brown Citation1997). The other DEG involve altered lipid metabolism (up-regulation of Fabp3, down-regulation of Cyp2C7), cholesterol (the precursor of bile salts) and bile salt metabolism (down-regulation of Abcb11 and up-regulation of Fdps) (Suppl. section S5.1). These energy metabolism transcriptomic anomalies might be linked to the tendency to produce heavier males in cross-fostered groups at PND21 (mean body weights were: C 55.1 g, CC 57.4 g, M 53.1 g, MM 55.8 g, p = 0.06 (Desaulniers, Xiao, and Cummings-Lorbetskie Citation2013)).
DEG supporting altered lipid metabolism in CC vs C at PND78-86
At PND78-86, the transcriptomic data support the hypothesis that cross-fostering alters lipid metabolism, through up-regulation of Dbp and Slc13a5 and down-regulation of Akr1c2, Akr1c12, Acot5, and Apoa5 in the CC group. First, Dbp (a gene influenced by circadian rhythm also detected in the MM vs M comparison, see next section) up-regulates expression of PPARγ which is an important regulator of adipocyte differentiation and lipid metabolism (Takahashi et al. Citation2010). In addition, up-regulated Slc13a5 (solute carrier family 13 member 5) is known to be involved in fat and glucose metabolism (Pesta et al. Citation2015; Willmes, Helfand, and Birkenfeld Citation2016). As previously discussed, aldo-keto reductases (AKR1C2, AKR1C12) reduce a variety of lipophilic substrates (steroids, prostaglandins, bile acids, and retinoids (Rizner and Penning Citation2014; Ruiz et al. Citation2012)), whereas acyl-CoA thioesterase 5 (ACOT5) catalyzes the hydrolysis of acyl-CoA esters to their corresponding non-esterified fatty acid and coenzyme A (Brocker et al. Citation2010). Finally, apolipoprotein A5 (APOA5) is a component of several lipoproteins (VLDL, HDL, chylomicrons) and acts as a potent regulator of triglyceride metabolism (Julve et al. Citation2016). Overall, the DEG observed in the CC group at PND78-86 are indicators of changes in lipid and energy metabolisms. (Suppl. section S5.2).
Hydroxysteroid sulfotransferase, Sult2a1, up-regulated in CC, plays an important role in xenobiotic and hormone metabolism. Maiti et al. (Citation2004) in an in vivo rodent study suggested that physical and/or chemical stress imposed on 5 to 7 week old SD male rats resulted in increased hepatic Sult2a1 expression. Further, Duanmu et al. (Citation2002) reported induction of human and murine SULT2A1 enzyme by glucocorticoids. These findings of up-regulation of Sult2a1 associated with stress and glucocorticoid hormone are consistent with those of this cross-fostering experiment.
DEG related to retinoid and energy (lipid, glucose) metabolism in MM vs M at PND21
The down-regulation of Cyp2c7, Retsat, Lcn2, and Tff3, and up-regulation of Akr1c1 in the MM group relative to M suggests that cross-fostering modulated the influence of M on mechanisms involving retinoid and lipid metabolism. As discussed previously, CYP2C7 is a retinoic acid and steroid hydroxylase enzyme (Fan et al. Citation2004), whereas AKR1C1 (AKR1C4 in human) is a member of the aldo-keto reductase family that catalyzes the reduction of retinaldehyde to retinol (Ruiz et al. Citation2011). Retinol saturase (Retsat) is an oxidoreductase that is also involved in retinoid metabolism, catalyzing conversion of retinol to 13,14-dihydroretinol (Moise et al. Citation2004). Lipocalin-2 (LCN2) is a transport protein for lipids, steroid hormones, and retinoids. Recently Guo et al. (Citation2016) reported that Lcn2 deficient mice displayed diminished levels of retinol, retinyl ester, and all-trans retinoic acid in adipose tissue. As previously discussed, a different preparation of the same mixture produced a reduction in hepatic retinol (Elabbas et al. Citation2014). Taken together, these results suggest that cross-fostering modulated the effect of M on retinoid metabolism; however, retinoid biochemistry analyses would be required to determine if cross-fostering amplified or lowered the M-induced retinoid deficiency. Implication of Retsat and Tff3 on lipid and glucose metabolism is presented in Suppl. S5.3.
Interestingly, cross-fostering might deregulate hepatic circadian rhythm and thus lipid metabolism, due to down-regulation of Arntl (alias Bmal1 or Mop3) and up-regulation of Dbp in the MM vs M group. Indeed, Dbp governs the circadian transcription of hepatic metabolic and detoxification enzymes in preparation for food intake (Schmutz, Albrecht, and Ripperger Citation2012; Stratmann et al. Citation2010; Takahashi et al. Citation2010), whereas ARNTL, as a heterodimer ARNTL/CLOCK, regulates the circadian expression of genes (Jaeger and Tischkau Citation2016; Leliavski et al. Citation2014; Zvonic et al. Citation2006). Thus, potential effects of cross-fostering on the CLOCK gene network may exert adverse metabolic consequences.
DEG in MM vs M at PND78-86
The down-regulation of Srd5a1, Cyp2b2, Inhbc, Tfr2, and Fgl1, and up-regulation of Akr1c2 and Akr1c12, in the MM relative to the M group at PND78-86 support that cross-fostering modulated the effects of M on steroid and bile acid metabolisms. The steroid-5α-reductases type 1 gene (Srd5a1) catalyzes A-ring reduction of pregnene steroids including androgens and glucocorticoids. Rodents deficient in SRD5A1 (knockout mice, or treated with enzyme inhibitors) accumulate hepatic excesses of glucocorticoids and lipids, develop hepatic steatosis, insulin resistance, and features of metabolic syndrome (Livingstone et al. Citation2015). Perhaps the down-regulation of Srd5a1 contributed to the deregulated glucocorticoid stress-responses in rats of the MM group (Desaulniers, Xiao, and Cummings-Lorbetskie Citation2013). Cyp2b2 (CYP2B6 in human) is involved in drug metabolism and in the synthesis of steroids, cholesterol, and other lipids. Chen and co-workers (Citation2014) reported that expression of CYP2B6 was decreased in diseased liver, including progressive cirrhosis and hepatocellular carcinoma. The down-regulation of Cyp2b2 in MM relative to M suggests that liver functions may be more severely affected in MM than M group. This finding is strengthened by observations that Inhbc, Tfr2, and Fgl1 were not markedly altered by any other treatment, and their down-regulation in MM relative to M is consistent with impaired liver regenerative response (Esquela et al. Citation1997), iron metabolism (Delima et al. Citation2012), and tumor suppressor functions (Nayeb-Hashemi et al. Citation2015), respectively. Effects on these genes and on Akr1c2 and Akr1c12 are further discussed in the Suppl. section S5.4.
Cross-fostering as a form of non-chemical stressor
Overall, these results support an influence of cross-fostering in control rats and a modulation of the effects of M on hepatic metabolism genes (glucose, lipids, bile acid, retinoids, glucocorticoids). The mechanisms by which cross-fostering affected the hepatic transcriptome are unknown but may include altered transient nursing quality (post-natal maternal behavior, milk quality) with interactions with mixture effects. Other experiments exploring stress effects also noted altered energy metabolism. It is known that psychological stress induces dyslipidemia and hepatic steatosis in mice (Depke et al. Citation2008), and restraint-stress modifies glucose metabolism (Cohen et al. Citation2009; Nirupama, Devaki, and Yajurvedi Citation2010), including hepatic Gck down-regulation (Tsoi et al. Citation2011). Interestingly, in non-human primates, stress imposed on nursing mothers during early development led to peripubertal obesity and insulin resistance in juveniles (Kaufman et al. Citation2007). Globally, the current transcriptomic data support the hypothesis that cross-fostering is a form of non-chemical stressor that induces hepatic metabolic disturbance in the developing liver. This is associated with subtle transcriptomic differences in control and mixture treated rats of young and adult ages, and might promote intermediary changes contributing to disease development.
Conclusions
This study in SD male rats showed that developmental exposure to EC mixture with a composition relevant to human exposure, induced changes in hepatic gene expression at PND21 that are indicative of effects on xenobiotic metabolism, oxidative stress, and energy (lipid, glucose) metabolism. Remarkably, at PND78-86, a different set of DEG was altered which was less suggestive of xenobiotic metabolism but still associated with altered energy metabolism. Thus, developmental exposure to EC mixtures may lead to short- and long-term effects mediated by different genes, but with the potential to alter the same set of functions related to energy metabolism.
Our data highlight some challenges for the risk assessment of environmentally relevant mixtures to humans. First, timing of tissue sampling might generate different lists of DEG and influence interpretation of potential outcomes. Indeed, changes in gene expression are dynamic (PND21 vs PND78-86), and at a given time and/or dose, DEG may reflect homeostasis, tissue adaptation, or toxicity. In that context, identification of consequential pathway(s) is difficult and might be confounded among more trivial pathways indirectly activated through cross-talk (Denison et al. Citation2011; Miao et al. Citation2006; Rezen et al. Citation2011; Tian Citation2009). To better understand the risk of developing a later adverse outcome, and identify DEG that are truly indicative of intermediary steps toward disease development, more low dose studies are needed with samples collected at different times following exposure to reflect immediate response, adaptation, compromised function and disease manifestation. Secondly, the identification of “driver chemicals” is another challenge when investigating the effects of mixtures. In the current study, the EC mixture was complex and included various organochlorines with different affinities for nuclear receptors [e.g.: 2,3,7,8-TCDD and co-planar PCBs with high affinity for AHR, but low affinity for CAR; or PCB153 and non-co-planar ortho-chlorinated PCBs with low affinity for AHR, but high affinity for CAR (Al-Salman and Plant Citation2012; Safe Citation1994)]. Based upon the dose-response observed on CYP expression and activities, the TCDD-TEQ system was reliable in identifying AhR-agonists as important “drivers” of short-term effects.
Current data, which suggests that cross-fostering acts as a form of non-chemical stress, strengthens previous observations that cross-fostering interacted with exposure to EC in inducing abnormal glucocorticoid stress-response at PND78-86 (Desaulniers, Xiao, and Cummings-Lorbetskie Citation2013). Humans are exposed to non-chemical stressors of various types that may modulate the effects of EC. Human exposures to EC (e.g.: PCDD, PCDF, PCB, pesticides) are associated with development of metabolic disorders such as obesity, diabetes and metabolic syndrome (Li et al. Citation2015; Marushka et al. Citation2018; Mostafalou and Abdollahi Citation2013; Singh and Chan Citation2018; Vafeiadi et al. Citation2016; Warner et al. Citation2013). Overall, transcriptomic clues are provided as to the origin of EC-induced metabolic dysfunction to guide future investigations. Our findings promote the need to identify and quantify the sources of non-chemical stressors that modulate the effects of chemical exposure. Finally, data suggest that consideration of non-chemical stressors is warranted to improve chemical risk assessments in humans.
Supplemental Material
Download MS Word (627.2 KB)Acknowledgments
The authors are grateful to Dr. Dalibor Breznan, Dr. Craig Parfett and Dr. Guillaume Pelletier for carefully reviewing this manuscript, to Dr. Mainul Husain and Andrea Rowan-Carroll for microarray hybridization, to Ming-Yan Yang, and the personnel from the Animal Resources Division for their precious assistance. Funded by Health Canada, the Northern Contaminants Program, and the Chemicals Management Plan of the Canadian government.
Supplemental data
Supplemental data for this article can be accessed here.
Related Research Data
References
- Adams, M. K., S. A. Lee, O. V. Belyaeva, L. Wu, and N. Y. Kedishvili. 2017. Characterization of human short chain dehydrogenase/reductase SDR16C family members related to retinol dehydrogenase 10. Chem. Biol Interact. 276:88–94. PM:27793605. doi:10.1016/j.cbi.2016.10.019.
- Al-Salman, F., and N. Plant. 2012. Non-coplanar polychlorinated biphenyls (PCBs) are direct agonists for the human pregnane-X receptor and constitutive androstane receptor, and activate target gene expression in a tissue-specific manner. Toxicol. Appl. Pharmacol. 263:7–13. doi:10.1016/j.taap.2012.05.016.
- Andersen, S., K. F. Rex, P. Noahsen, H. C. Sorensen, N. H. Larsen, G. Mulvad, and P. Laurberg. 2014. Forty-five year trends in overweight and obesity in an indigenous arctic inuit society in transition and spatiotemporal trends. Am. J. Human Biol. 26:511–17. PM:24796319. doi:10.1002/ajhb.22556.
- Andreola, F., G. P. Hayhurst, G. Luo, S. S. Ferguson, F. J. Gonzalez, J. A. Goldstein, and L. M. De Luca. 2004. Mouse liver CYP2C39 is a novel retinoic acid 4-hydroxylase. Its down-regulation offers a molecular basis for liver retinoid accumulation and fibrosis in aryl hydrocarbon receptor-null mice. J. Biol. Chem. 279:3434–38. PM:14623888. doi:10.1074/jbc.M305832200.
- Baars, A. J., M. Jansen, and D. D. Breimer. 1978. The influence of phenobarbital, 3-methylcholanthrene and 2, 3, 7, 8-tetrachlorodibenzo-p-dioxin on glutathione S-transferase activity of rat liver cytosol. Biochem. Pharmacol. 27:2487–94.
- Bencko, V., J. Rames, M. Ondrusova, I. Plesko, L. Jurickova, and T. Trnovec. 2008. Human exposure to polyhalogenated hydrocarbons and incidence of selected malignancies-central European experience. Neoplasma 56:353–57. doi:10.4149/neo_2009_04_353.
- Benjamini, Y., and Y. Hochberg. 1995. Controlling the false discovery rate: A practical and powerful approach to multiple testing. J. Roy Stat Soc. Series B (Methodological), 57:289–300.
- Bowers, W. J., J. Nakai, I. Chu, M. G. Wade, D. Moir, A. Yagminas, S. Gill, O. Pulido, and R. Meuller. 2004. Early developmental neurotoxicity of a PCB/organochlorine mixture in rodents after gestational and lactational exposure. Toxicol. Sci. 77:51–62. PM:14514954. doi:10.1093/toxsci/kfg248.
- Brocker, C., C. Carpenter, D. W. Nebert, and V. Vasiliou. 2010. Evolutionary divergence and functions of the human acyl-CoA thioesterase gene (ACOT) family. Hum. Genom 4:411–20. PM:20846931. doi:10.1186/1479-7364-4-6-411.
- Brown, J. F., B. A. Mayes, J. B. Silkworth, and S. B. Hamilton. 2007. Polychlorinated biphenyls-modulated tumorigenesis in Sprague-Dawley rats: Correlation with mixed function oxidase activities and superoxide (O2•-) formation potentials and amplied mode of action. Toxicol. Sci. 98:375–94. doi:10.1093/toxsci/kfm122.
- Butler Walker, J., L. Seddon, E. McMullen, J. Houseman, K. Tofflemire, A. Corriveau, J. P. Weber, C. Mills, S. Smith, and J. Van Oostdam. 2003. Organochlorine levels in maternal and umbilical cord blood plasma in Arctic Canada. Sci. Total Environ. 302:27–52. PM:12526896.
- Canadian environmental contaminants biomonitoring programs, 2018. Accessed October 21, 2018. https://www.canada.ca/en/health-canada/services/environmental-workplace-health/environmental-contaminants/human-biomonitoring-environmental-chemicals.html.
- Chen, H., Z. Y. Shen, W. Xu, T. Y. Fan, J. Li, Y. F. Lu, M. L. Cheng, and J. Liu. 2014. Expression of P450 and nuclear receptors in normal and end-stage Chinese livers. World J. Gastroenterol. 20:8681–90. PM:25024626. doi:10.3748/wjg.v20.i26.8681.
- Chhillar, N., N. K. Singh, B. D. Banerjee, K. Bala, and D. Md Mustafa. 2013. Organochlorine pesticide levels and risk of Parkinson’s disease in North Indian population. In ISRN Neurol, 2013–371034.http://dx.doi.org/10.1155/2013/371034
- Chu, I., W. J. Bowers, D. Caldwell, J. Nakai, M. G. Wade, A. Yagminas, N. Li, D. Moir, L. El Abbas, H. Hakansson, S. Gill, R. Mueller, and O. Pulido. 2008. Toxicological effects of in utero and lactational exposure of rats to a mixture of environmental contaminants detected in Canadian Arctic human populations. J. Toxicol. Environ. Health 71:93–108. PM:18080900. doi:10.1080/15287390701612811.
- Chu, I., W. J. Bowers, D. Caldwell, J. Nakai, O. Pulido, A. Yagminas, M. G. Wade, D. Moir, S. Gill, and R. Mueller. 2005. Toxicological effects of gestational and lactational exposure to a mixture of persistent organochlorines in rats: Systemic effects. Toxicol. Sci. 88:645–55. PM:16177236. doi:10.1093/toxsci/kfi335.
- Cohen, H., N. Kozlovsky, N. Savion, M. A. Matar, U. Loewenthal, N. Loewenthal, J. Zohar, and Z. Kaplan. 2009. An association between stress-induced disruption of the hypothalamic-pituitary-adrenal axis and disordered glucose metabolism in an animal model of post-traumatic stress disorder. J. Neuroendocrinol. 21:898–909. PM:19732290. doi:10.1111/j.1365-2826.2009.01913.x.
- Cory-Slechta, D. A. 2005. Studying toxicants as single chemicals: Does this strategy adequately identify neurotoxic risk? Neurotoxicology 26:491–510. PM:16112317. doi:10.1016/j.neuro.2004.12.007.
- Crofton, K. M., P. R. Kodavanti, E. C. Derr-Yellin, A. C. Casey, and L. S. Kehn. 2000. PCBs, thyroid hormones, and ototoxicity in rats: Cross-fostering experiments demonstrate the impact of postnatal lactation exposure. Toxicol. Sci. 57:131–40. PM:10966519.
- Cui, X., J. T. G. Hwang, J. Qiu, N. J. Blades, and G. A. Churchill. 2005. Improved statistical tests for differential gene expression by shrinking variance components estimates. Biostatistics 6:59–75. doi:10.1093/biostatistics/kxh018.
- Delima, R. D., A. C. G. Chua, J. E. E. Tirnitz-Parker, E. K. Gan, K. D. Croft, R. M. Graham, J. K. Olynyk, and D. Trinder. 2012. Disruption of hemochromatosis protein and transferrin receptor 2 causes iron-induced liver injury in mice. Hepatology 56:585–93. doi:10.1002/hep.25689.
- Denison, M. S., A. A. Soshilov, G. He, D. E. DeGroot, and B. Zhao. 2011. Exactly the same but different: Promiscuity and diversity in the molecular mechanisms of action of the aryl hydrocarbon (dioxin) receptor. Toxicol. Sci. 124:1–22. doi:10.1093/toxsci/kfr218.
- Depke, M., G. Fusch, G. Domanska, R. Geffers, U. Völker, C. Schuett, and C. Kiank. 2008. Hypermetabolic syndrome as a consequence of repeated psychological stress in mice. Endocrinology 149:2714–23. doi:10.1210/en.2008-0038.
- Desaulniers, D., C. Cummings-Lorbetskie, N. Li, G. H. Xiao, L. Marro, N. Khan, and K. Leingartner. 2017. Sodium bisulfite pyrosequencing revealed that developmental exposure to environmental contaminant mixtures does not affect DNA methylation of DNA repeats in Sprague-Dawley rats. J. Toxicol. Environ. Health 80:32–52. PM:27905861. doi:10.1080/15287394.2016.1231644.
- Desaulniers, D., G. H. Xiao, and C. Cummings-Lorbetskie. 2013. Effects of lactational and/or in utero exposure to environmental contaminants on the glucocorticoid stress-response and DNA methylation of the glucocorticoid receptor promoter in male rats. Toxicology 308C:20–33. PM:23537661. doi:10.1016/j.tox.2013.03.006.
- Desaulniers, D., K. Leingartner, G. Pelletier, G. H. Xiao, and W. J. Bowers. 2012. Effects of developmental exposure to mixtures of environmental contaminants on the hepatic metabolism of estradiol-17β in immature female Sprague Dawley rats. Int. J. Toxicol. 31:454–67. PM:22914890. doi:10.1177/1091581812457431.
- Dong, H., C. L. Yauk, A. Williams, A. Lee, G. R. Douglas, and M. G. Wade. 2007. Hepatic gene expression changes in hypothyroid juvenile mice: Characterization of a novel negative thyroid-responsive element. Endocrinology 148:3932–40. doi:10.1210/en.2007-0452.
- Duanmu, Z., D. Locke, J. Smigelski, W. Wu, M. S. Dahn, C. N. Falany, T. A. Kocarek, and M. Runge-Morris. 2002. Effects of dexamethasone on aryl (SULT1A1)-and hydroxysteroid (SULT2A1)-sulfotransferase gene expression in primary cultured human hepatocytes. Drug Metab. Dispos. 30:997–1004.
- Elabbas, L. E., J. Esteban, X. Barber, G. Hamscher, H. Nau, W. J. Bowers, J. S. Nakai, M. Herlin, A. Akesson, M. Viluksela, D. Borg, and H. Hakansson. 2014. In utero and lactational exposure to a mixture of environmental contaminants detected in Canadian Arctic human populations alters retinoid levels in rat offspring with low margins of exposure. J. Toxicol. Environ. Health 77:223–45. PM:24588224. doi:10.1080/15287394.2013.861776.
- Esquela, A. F., T. A. Zimmers, L. G. Koniaris, J. V. Sitzmann, and S. J. Lee. 1997. Transient down-regulation of inhibin-βC expression following partial hepatectomy. Biochem. Biophys. Res. Commun. 235:553–56. doi:10.1006/bbrc.1997.6850.
- Fader, K. A., and T. R. Zacharewski. 2017. Beyond the aryl hydrocarbon receptor: Pathway interactions in the hepatotoxicity of 2,3,7,8-tetrachlorodibenzo-p-dioxin and related compounds. Curr. Opin. Toxicol. 2:36–41. PM:28948239. doi:10.1016/j.cotox.2017.01.010.
- Fan, L. C., W. F. Chiang, C. H. Liang, Y. T. Tsai, T. Y. Wong, K. C. Chen, T. M. Hong, and Y. L. Chen. 2011. β-Catulin knockdown induces senescence in cancer cells. Oncogene 30:2610–21. doi:10.1038/onc.2010.637.
- Fan, L. Q., H. Brown-Borg, S. Brown, S. Westin, A. Mode, and J. C. Corton. 2004. PPARalpha activators down-regulate CYP2C7, a retinoic acid and testosterone hydroxylase. Toxicology 203:41–48. PM:15363580. doi:10.1016/j.tox.2004.05.013.
- Fish, E. W., D. Shahrokh, R. Bagot, C. Caldji, T. Bredy, M. Szyf, and M. J. Meaney. 2004. Epigenetic programming of stress responses through variations in maternal care. Ann. N. Y. Acad. Sci 1036:167–80. PM:15817737. doi:10.1196/annals.1330.011.
- Fletcher, N., A. Hanberg, and H. Håkansson. 2001. Hepatic vitamin A depletion is a sensitive marker of 2, 3, 7, 8-tetrachlorodibenzo-p-dioxin (TCDD) exposure in four rodent species. Toxicol. Sci. 62:166–75.
- French, S. W. 2010. Molecular events in hepatic preneoplasia: A review. Exp. Mol. Pathol. 88:219–24. PM:20097196. doi:10.1016/j.yexmp.2010.01.005.
- Fujino, T., H. Asaba, M. J. Kang, Y. Ikeda, H. Sone, S. Takada, D. H. Kim, R. X. Ioka, M. Ono, and H. Tomoyori. 2003. Low-density lipoprotein receptor-related protein 5 (LRP5) is essential for normal cholesterol metabolism and glucose-induced insulin secretion. Proc. Nat. Acad. Sci. USA 100:229–34. doi:10.1073/pnas.0133792100.
- Gascon, M., J. Sunyer, D. Martinez, S. Guerra, I. Lavi, M. Torrent, and M. Vrijheid. 2014. Persistent organic pollutants and children’s respiratory health: The role of cytokines and inflammatory biomarkers. Environ. Int. 69:133–40. doi:10.1016/j.envint.2014.04.021.
- Goodnight, J. H., and W. R. Harvey. 1978. Least squares means in the fixed effects general linear models.: SAS Technical Report R-103, (https://support.sas.com/documentation/onlinedoc/v82/techreport_r103.pdf), Cary, NC: SAS Institute Inc.
- Guo, H., R. Foncea, S. M. O’Byrne, H. Jiang, Y. Zhang, J. A. Deis, W. S. Blaner, D. A. Bernlohr, and X. Chen. 2016. Lipocalin 2, a regulator of retinoid homeostasis and retinoid-mediated thermogenic activation in adipose tissue. J. Biol. Chem. 291:11216–29. doi:10.1074/jbc.M115.711556.
- Han, L., W. W. Hsu, D. Todem, J. Osuch, A. Hungerink, and W. Karmaus. 2016. In utero exposure to polychlorinated biphenyls is associated with decreased fecundability in daughters of Michigan female fish eaters: A cohort study. Environ. Health 15:92. doi:10.1186/s12940-016-0175-3.
- Hashimoto, R., M. Kanda, H. Takami, D. Shimizu, H. Oya, S. Hibino, Y. Okamura, S. Yamada, T. Fujii, and G. Nakayama. 2015. Aberrant expression of melanoma-associated antigen-D2 serves as a prognostic indicator of hepatocellular carcinoma outcome following curative hepatectomy. Oncol. Lett. 9:1201–06. doi:10.3892/ol.2014.2823.
- Hu, B., Y. Li, L. Gao, Y. Guo, Y. Zhang, X. Chai, M. Xu, J. Yan, P. Lu, S. Ren, S. Zeng, Y. Liu, W. Xie, and M. Huang. 2017. Hepatic induction of fatty acid binding protein 4 plays a pathogenic role in sepsis in mice. Am. J. Pathol. 187:1059–67. PM:28279656. doi:10.1016/j.ajpath.2017.01.002.
- Ismail, A. A., K. Wang, J. R. Olson, M. R. Bonner, O. Hendy, R. G. Abdel, and D. S. Rohlman. 2017. The impact of repeated organophosphorus pesticide exposure on biomarkers and neurobehavioral outcomes among adolescent pesticide applicators. J. Toxicol. Environ. Health 80:542–55. doi:10.1080/15287394.2017.1362612.
- Jaeger, C., and S. A. Tischkau. 2016. Role of aryl hydrocarbon receptor in circadian clock disruption and metabolic dysfunction. Environ. Health Insights 10:133–41. PM:27559298. doi:10.4137/EHI.S38343.
- Jimenez, F. D., and M. Lamkanfi. 2015. Inflammatory caspases: Key regulators of inflammation and cell death. J. Biol. Chem. 396:193–203. PM:25389992.
- Julve, J., J. M. Martin-Campos, J. C. Escola-Gil, and F. Blanco-Vaca. 2016. Chylomicrons: Advances in biology, pathology, laboratory testing, and therapeutics. Clin. Chim. Acta 455:134–48. PM:26868089. doi:10.1016/j.cca.2016.02.004.
- Jung, K. H., J. K. Kim, J. H. Noh, J. W. Eun, H. J. Bae, M. G. Kim, Y. G. Chang, Q. Shen, S. J. Kim, and S. H. Kwon. 2013. Characteristic molecular signature for the early detection and prediction of polycyclic aromatic hydrocarbons in rat liver. Toxicol. Lett. 216:1–8. doi:10.1016/j.toxlet.2012.11.001.
- Karwacka, A., D. Zamkowska, M. Radwan, and J. Jurewicz. 2017. Exposure to modern, widespread environmental endocrine disrupting chemicals and their effect on the reproductive potential of women: An overview of current epidemiological evidence. Human Fertil. (Camb.) 1-24. PM:28758506. doi: 10.1080/14647273.2017.1358828.[Epub ahead of print]
- Kaufman, D., M. A. Banerji, I. Shorman, E. L. P. Smith, J. D. Coplan, L. A. Rosenblum, and J. G. Kral. 2007. Early-life stress and the development of obesity and insulin resistance in juvenile bonnet macaques. Diabetes 56:1382–86. doi:10.2337/db06-1409.
- Kazbariene, B., A. Krikstaponiene, and E. Monceviciute-Eringiene. 2006. Disturbance of human immunohomeostasis by environmental pollution and alcohol consumption. Acta Microbiol. Immunol. Hungarica 53:209–18. doi:10.1556/AMicr.53.2006.2.7.
- Kerr, M. K. 2003. Design considerations for efficient and effective microarray studies. Biometrics 59:822–28.
- Kerr, M. K., and G. A. Churchill. 2001. Statistical design and the analysis of gene expression microarray data. Genet. Res. 77:123–28.
- Kimura, M., H. Abe, S. Mizukami, T. Tanaka, M. Itahashi, N. Onda, T. Yoshida, and M. Shibutani. 2016. Onset of hepatocarcinogen-specific cell proliferation and cell cycle aberration during the early stage of repeated hepatocarcinogen administration in rats. J. Appl. Toxicol. 36:223–37. PM:26011634. doi:10.1002/jat.3163.
- Kuwatsuka, Y., K. Shimizu, Y. Akiyama, Y. Koike, F. Ogawa, M. Furue, and A. Utani. 2014. Yusho patients show increased serum IL-17, IL-23, IL-1beta, and TNF-alpha levels more than 40 years after accidental polychlorinated biphenyl poisoning. J. Immunotoxicol. 11:246–49. PM:24083809. doi:10.3109/1547691X.2013.835890.
- Lamartiniere, C. A., C. S. Dieringer, and G. W. Lucier. 1979. Altered ontogeny of glutathione S-transferases by 2,4,5-2ʹ,4ʹ,5ʹ-hexachlorobiphenyl. Toxicol. Appl. Pharmacol. 51:233–38.
- Leliavski, A., A. Shostak, J. Husse, and H. Oster. 2014. Impaired glucocorticoid production and response to stress in Arntl-deficient male mice. Endocrinology 155:133–42. doi:10.1210/en.2013-1531.
- Lenters, V., L. Portengen, L. A. Smit, B. A. Jonsson, A. Giwercman, L. Rylander, C. H. Lindh, M. Spano, H. S. Pedersen, J. K. Ludwicki, L. Chumak, A. H. Piersma, G. Toft, J. P. Bonde, D. Heederik, and R. Vermeulen. 2015. Phthalates, perfluoroalkyl acids, metals and organochlorines and reproductive function: A multipollutant assessment in Greenlandic, Polish and Ukrainian men. Occup. Environ. Med. 72:385–93. doi:10.1136/oemed-2014-102264.
- Leroux, A., G. Ferrere, V. Godie, F. Cailleux, M. L. Renoud, F. Gaudin, S. Naveau, S. Prevot, S. Makhzami, G. Perlemuter, and A. M. Cassard-Doulcier. 2012. Toxic lipids stored by Kupffer cells correlates with their pro-inflammatory phenotype at an early stage of steatohepatitis. J. Hepatol. 57:141–49. PM:22425624. doi:10.1016/j.jhep.2012.02.028.
- Li, J., A. S. Phadnis-Moghe, R. B. Crawford, and N. E. Kaminski. 2017. Aryl hydrocarbon receptor activation by 2, 3, 7, 8-tetrachlorodibenzo-p-dioxin impairs human B lymphopoiesis. Toxicology 378:17–24. doi:10.1016/j.tox.2016.12.010.
- Li, M. C., P. C. Chen, P. C. Tsai, M. Furue, D. Onozuka, A. Hagihara, H. Uchi, T. Yoshimura, and Y. L. Guo. 2015. Mortality after exposure to polychlorinated biphenyls and polychlorinated dibenzofurans: A meta-analysis of two highly exposed cohorts. Int. J. Cancer 137:1427–32. doi:10.1002/ijc.29504.
- Li, X., H. Tan, M. Luo, X. Wu, X. Huang, S. Zhou, L. Shen, Y. He, Y. Liu, L. Hu, M. Chen, S. Hu, and S. W. Wen. 2018. Exposure to firework chemicals from production factories in pregnant women and risk of preterm birth occurrence in Liuyang, China. J. Toxicol. Environ. Health 81:154–59. doi:10.1080/15287394.2017.1415579.
- Li, Y., X. Chen, and H. Lu. 2016. Knockdown of SLC34A2 inhibits hepatocellular carcinoma cell proliferation and invasion. Oncol. Res. Featuring Preclin Clin. Cancer Ther. 24:511–19.
- Livak, K. J., and T. D. Schmittgen. 2001. Analysis of relative gene expression data using real-time quantitative PCR and the 2(-Delta Delta C(T)) method. Methods 25:402–08. doi:10.1006/meth.2001.1262.
- Livingstone, D. E. W., P. Barat, E. M. Di Rollo, G. A. Rees, B. A. Weldin, E. A. Rog-Zielinska, D. P. MacFarlane, B. R. Walker, and R. Andrew. 2015. 5β-Reductase type 1 deficiency or inhibition predisposes to insulin resistance, hepatic steatosis and liver fibrosis in rodents. Diabetes 64:447–58. doi:10.2337/db14-0249.
- Lu, L., X. Hou, S. Shi, C. Körner, and P. Stanley. 2010. Slc35c2 promotes Notch1 fucosylation and is required for optimal Notch signaling in mammalian cells. J. Biol. Chem. 285:36245–54. doi:10.1074/jbc.M110.126003.
- Mailloux, R. J., M. Florian, Q. Chen, J. Yan, I. Petrov, M. C. Coughlan, M. Laziyan, D. Caldwell, M. Lalande, and D. Patry. 2014. Exposure to a northern contaminant mixture (NCM) alters hepatic energy and lipid metabolism exacerbating hepatic steatosis in obese JCR rats. PloS one 9:e106832. doi:10.1371/journal.pone.0106832.
- Maiti, S., S. Grant, S. M. Baker, S. Karanth, C. N. Pope, and G. Chen. 2004. Stress regulation of sulfotransferases in male rat liver. Biochem. Biophys. Res. Commun. 323:235–41. doi:10.1016/j.bbrc.2004.08.074.
- Marushka, L., X. Hu, M. Batal, T. Sadik, H. Schwartz, A. Ing, K. Fediuk, C. Tikhonov, and H. M. Chan. 2018. The relationship between persistent organic pollutants exposure and type 2 diabetes among First Nations in Ontario and Manitoba, Canada: A difference in difference analysis. Int. J. Environ. Res. Public Health 15:539. PM:29562596. doi:10.3390/ijerph15061188.
- McCormick, J. A., V. Lyons, M. D. Jacobson, J. Noble, J. Diorio, M. Nyirenda, S. Weaver, W. Ester, J. L. Yau, M. J. Meaney, J. R. Seckl, and K. E. Chapman. 2000. 5ʹ-heterogeneity of glucocorticoid receptor messenger RNA is tissue specific: Differential regulation of variant transcripts by early-life events. Mol. Endocrinol. 14:506–17. doi:10.1210/mend.14.4.0438.
- McGarry, J. D., and N. F. Brown. 1997. The mitochondrial carnitine palmitoyltransferase system-from concept to molecular analysis. Eur. J. Biochem. 244:1–14.
- Mehta, A., M. A. Comunale, S. Rawat, J. C. Casciano, J. Lamontagne, H. Herrera, A. Ramanathan, L. Betesh, M. Wang, and P. Norton. 2016. Intrinsic hepatocyte dedifferentiation is accompanied by upregulation of mesenchymal markers, protein sialylation and core alpha 1, 6 linked fucosylation. Sci Rep 6:27965. doi: 10.1038/srep27965.
- Mello, T., A. Nakatsuka, S. Fears, W. Davis, H. Tsukamoto, W. F. Bosron, and S. P. Sanghani. 2008. Expression of carboxylesterase and lipase genes in rat liver cell-types. Biochem. Biophys. Res. Commun. 374:460–64. PM:18639528. doi:10.1016/j.bbrc.2008.07.024.
- Merdek, K. D., N. T. Nguyen, and D. Toksoz. 2004. Distinct activities of the alpha-catenin family, alpha-catulin and alpha-catenin, on beta-catenin-mediated signaling. Mol. Cell. Biol. 24:2410–22. PM:14993280.
- Miao, J., S. Fang, Y. Bae, and J. K. Kemper. 2006. Functional inhibitory cross-talk between constitutive androstane receptor and hepatic nuclear factor-4 in hepatic lipid/glucose metabolism is mediated by competition for binding to the DR1 motif and to the common coactivators, GRIP-1 and PGC-1β. J. Biol. Chem. 281:14537–46. doi:10.1074/jbc.M510713200.
- Mitoma, C., H. Uchi, K. Tsukimori, H. Yamada, M. Akahane, T. Imamura, A. Utani, and M. Furue. 2015. Yusho and its latest findings-A review in studies conducted by the Yusho Group. Environ. Int. 82:41–48. doi:10.1016/j.envint.2015.05.004.
- Moise, A. R., V. Kuksa, Y. Imanishi, and K. Palczewski. 2004. Identification of all-trans-retinol: All-trans-13, 14-dihydroretinol saturase. J. Biol. Chem. 279:50230–42. doi:10.1074/jbc.M409130200.
- Monga, S. P. 2015. β-Catenin signaling and roles in liver homeostasis, injury, and tumorigenesis. Gastroenterology 148:1294–310. doi:10.1053/j.gastro.2015.02.056.
- Moreau, A., M. J. Vilarem, P. Maurel, and J. M. Pascussi. 2007. Xenoreceptors CAR and PXR activation and consequences on lipid metabolism, glucose homeostasis, and inflammatory response. Mol. Pharmaceut. 5:35–41. doi:10.1021/mp700103m.
- Morse, D. C., and A. Brouwer. 1995. Fetal, neonatal, and long-term alterations in hepatic retinoid levels following maternal polychlorinated biphenyl exposure in rats. Toxicol. Appl. Pharmacol. 131:175–82. doi:10.1006/taap.1995.1059.
- Mostafalou, S., and M. Abdollahi. 2013. Pesticides and human chronic diseases: Evidences, mechanisms, and perspectives. Toxicol. Appl. Pharmacol. 268:157–77. doi:10.1016/j.taap.2013.01.025.
- Muckle, G., P. Ayotte, E. E. Dewailly, S. W. Jacobson, and J. L. Jacobson. 2001. Prenatal exposure of the northern Quebec Inuit infants to environmental contaminants. Environ. Health Perspect. 109:1291–99. PM:11748038. doi:10.1289/ehp.011091291.
- Nayeb-Hashemi, H., A. Desai, V. Demchev, R. T. Bronson, J. L. Hornick, D. E. Cohen, and C. Ukomadu. 2015. Targeted disruption of fibrinogen like protein-1 accelerates hepatocellular carcinoma development. Biochem. Biophys. Res. Commun. 465:167–73. doi:10.1016/j.bbrc.2015.07.078.
- Nirupama, R., M. Devaki, and H. N. Yajurvedi. 2010. Repeated stress exposure results in hyperglycemia for a prolonged period in rat. J. Exp. Zool. 13:537–40.
- Pesta, D. H., R. J. Perry, F. Guebre-Egziabher, D. Zhang, M. Jurczak, A. Fischer-Rosinsky, M. A. Daniels, D. M. Willmes, S. Bhanot, and S. R. Bornstein. 2015. Prevention of diet-induced hepatic steatosis and hepatic insulin resistance by second generation antisense oligonucleotides targeted to the longevity gene mIndy (Slc13a5). Aging (Albany NY) 7:1086–93. doi:10.18632/aging.100854.
- R Core Team. 2015. R: A language and environment for statistical computing. R foundation for statistical computing, Vienna, Austria. http://www. r-project.org.
- Ren, J., A. Kan, S. H. Leong, L. L. Ooi, K. T. Jeang, S. S. Chong, O. L. Kon, and C. G. Lee. 2006. FAT10 plays a role in the regulation of chromosomal stability. J. Biol. Chem. 281:11413–21. PM:16495226. doi:10.1074/jbc.M507218200.
- Rezen, T., D. Rozman, J. M. Pascussi, and K. Monostory. 2011. Interplay between cholesterol and drug metabolism. Biochim Biophys Acta (BBA)-Proteins Proteom 1814:146–60. doi:10.1016/j.bbapap.2010.05.014.
- Richardson, J. R., A. Roy, S. L. Shalat, R. T. von Stein, M. M. Hossain, B. Buckley, M. Gearing, A. I. Levey, and D. C. German. 2014. Elevated serum pesticide levels and risk for Alzheimer disease. JAMA Neurol. 71:284–90. doi:10.1001/jamaneurol.2013.6030.
- Rizner, T. L., and T. M. Penning. 2014. Role of aldo-keto reductase family 1 (AKR1) enzymes in human steroid metabolism. Steroids 79:49–63. doi:10.1016/j.steroids.2013.10.012.
- Ruiz, F. X., S. Porté, O. Gallego, A. Moro, A. Ardèvol, A. Del Rio-Espinola, C. Ovira, J. Farres, and X. Pares. 2011. Retinaldehyde is a substrate for human aldo-keto reductases of the 1C subfamily. Biochem. J. 440:335–47. doi:10.1042/BJ20111286.
- Ruiz, F. X., S. Porte, X. Pares, and J. Farres. 2012. Biological role of aldo-keto reductases in retinoic acid biosynthesis and signaling. Front Pharmacol. 3-58. PM:22529810.https://doi.org/10.3389/fphar.2012.00058
- Safe, S. 1994. Polychlorinated biphenyls (PCBs): Environmental impact, biochemical and toxic responses, and implications for risk assessment. Crit. Rev. Toxicol. 24:87–149. doi:10.3109/10408449409049308.
- Sarma, J. V., and P. A. Ward. 2011. The complement system. Cell Tissue Res. 343:227–35. doi:10.1007/s00441-010-1034-0.
- Schmutz, I., U. Albrecht, and J. A. Ripperger. 2012. The role of clock genes and rhythmicity in the liver. Mol. Cell. Endocrinol. 349:38–44. doi:10.1016/j.mce.2011.05.007.
- Searle, S. R., F. M. Speed, and G. A. Milliken. 1980. Population marginal means in the linear model: An alternative to least squares means. Am. Stat. 34:216–21.
- Singh, K., and H. M. Chan. 2017. Persistent organic pollutants and diabetes among Inuit in the Canadian Arctic. Environ. Int. 101:183–89. PM:28202225. doi:10.1016/j.envint.2017.02.002.
- Singh, K., and H. M. Chan. 2018. Association of blood polychlorinated biphenyls and cholesterol levels among Canadian Inuit. Environ. Res. 160:298–305. PM:29035785. doi:10.1016/j.envres.2017.10.010.
- Stockinger, B., P. D. Meglio, M. Gialitakis, and J. H. Duarte. 2014. The aryl hydrocarbon receptor: Multitasking in the immune system. Annu. Rev. Immunol. 32:403–32. doi:10.1146/annurev-immunol-032713-120245.
- Stratmann, M., F. Stadler, F. Tamanini, G. T. J. van der Horst, and J. A. Ripperger. 2010. Flexible phase adjustment of circadian albumin D site-binding protein (DBP) gene expression by CRYPTOCHROME1. Genes Dev. 24:1317–28. doi:10.1101/gad.578810.
- Su, G. M., E. Fiala-Beer, J. Weber, D. Jahn, G. R. Robertson, and M. Murray. 2005. Pretranslational upregulation of microsomal CYP4A in rat liver by intake of a high-sucrose, lipid-devoid diet containing orotic acid. Biochem. Pharmacol. 69:709–17. PM:15670589. doi:10.1016/j.bcp.2004.11.005.
- Takahashi, S., I. Inoue, Y. Nakajima, M. Seo, T. Nakano, F. Yang, M. Kumagai, T. Komoda, T. Awata, and M. Ikeda. 2010. A promoter in the novel exon of hPPARγ directs the circadian expression of PPARγ. J. Atheroscler. . 17:73–83. doi:10.5551/jat.2410.
- Tian, Y. 2009. Ah receptor and NF-kappaB interplay on the stage of epigenome. Biochem. Pharmacol. 77:670–80. doi:10.1016/j.bcp.2008.10.023.
- Torres-Sánchez, L., L. Schnaas, S. J. Rothenberg, M. E. Cebrián, E. Osorio-Valencia, M. C. Hernández, R. M. Garcia-Hernández, and L. López-Carrillo. 2013. Prenatal p,p -DDE exposure and neurodevelopment among children 3.5-5 years of age. Environ. Health Perspect. 121:263–68. PM:23151722. doi:10.1289/ehp.1205034.
- Tryphonas, H., G. Bondy, M. Hodgen, L. Coady, M. Parenteau, C. Armstrong, S. Hayward, and V. Liston. 2003. Effects of cis-nonachlor, trans-nonachlor and chlordane on the immune system of Sprague-Dawley rats following a 28-day oral (gavage) treatment. Food Chem. Toxicol. 41:107–18.
- Tsoi, B., R. R. He, D. H. Yang, Y. F. Li, X. D. Li, W. X. Li, K. Abe, and H. Kurihara. 2011. Carnosine ameliorates stress-induced glucose metabolism disorder in restrained mice. J. Pharmacol. Sci. 117:223–29. PM:22123261.
- Twaroski, T. P., M. L. O’Brien, and L. W. Robertson. 2001. Effects of selected polychlorinated biphenyl (PCB) congeners on hepatic glutathione, glutathione-related enzymes, and selenium status: Implications for oxidative stress. Biochem. Pharmacol. 62:273–81. PM:11434900.
- Vafeiadi, M., T. Roumeliotaki, G. Chalkiadaki, P. Rantakokko, H. Kiviranta, E. Fthenou, S. A. Kyrtopoulos, M. Kogevinas, and L. Chatzi. 2016. Persistent organic pollutants in early pregnancy and risk of gestational diabetes mellitus. Environ. Int. 98:89–95. doi:10.1016/j.envint.2016.10.005.
- Van Den Berg, M., L. S. Birnbaum, M. Denison, M. De Vito, W. Farland, M. Feeley, H. Fiedler, H. Hakansson, A. Hanberg, L. Haws, M. Rose, S. Safe, D. Schrenk, C. Tohyama, A. Tritscher, J. Tuomisto, M. Tysklind, N. Walker, and R. E. Peterson. 2006. The 2005 World Health Organization reevaluation of human and mammalian toxic equivalency factors for dioxins and dioxin-like compounds. Toxicol. Sci. 93:223–41. PM:16829543. doi:10.1093/toxsci/kfl055.
- Veras, M. M., E. G. Caldini, M. Dolhnikoff, and P. H. Saldiva. 2010. Air pollution and effects on reproductive-system functions globally with particular emphasis on the Brazilian population. J. Toxicol. Environ. Health B 13:1–15. doi:10.1080/10937401003673800.
- Vogiatzi, F., D. T. Brandt, J. Schneikert, J. Fuchs, K. Grikscheit, M. Wanzel, E. Pavlakis, J. P. Charles, O. Timofeev, and A. Nist. 2016. Mutant p53 promotes tumor progression and metastasis by the endoplasmic reticulum UDPase ENTPD5. Proc. Nat. Acad. Sci. USA 113:E8433–E8442. doi:10.1073/pnas.1612711114.
- VoPham, T., M. M. Brooks, J. M. Yuan, E. O. Talbott, D. Ruddell, J. E. Hart, C. C. Chang, and J. L. Weissfeld. 2015. Pesticide exposure and hepatocellular carcinoma risk: A case-control study using a geographic information system (GIS) to link SEER-Medicare and California pesticide data. Environ. Res. 143:68–82. doi:10.1016/j.envres.2015.09.027.
- Warner, M., P. Mocarelli, P. Brambilla, A. Wesselink, S. Samuels, S. Signorini, and B. Eskenazi. 2013. Diabetes, metabolic syndrome, and obesity in relation to serum dioxin concentrations: The Seveso women’s health study. Environ. Health Perspect. 121:906–11. doi:10.1289/ehp.1206113.
- Watkins, P. A., D. Maiguel, Z. Jia, and J. Pevsner. 2007. Evidence for 26 distinct acyl-coenzyme A synthetase genes in the human genome. J. Lipid Res. 48:2736–50. doi:10.1194/jlr.M700378-JLR200.
- Weaver, I. C., N. Cervoni, F. A. Champagne, A. C. D’Alessio, S. Sharma, J. R. Seckl, S. Dymov, M. Szyf, and M. J. Meaney. 2004. Epigenetic programming by maternal behavior. Nat. Neurosci. 7:847–54. doi:10.1038/nn1276.
- Weisskopf, M. G., P. Knekt, E. J. O’Reilly, J. Lyytinen, A. Reunanen, F. Laden, L. Altshul, and A. Ascherio. 2010. Persistent organochlorine pesticides in serum and risk of Parkinson disease. Neurology 74:1055–61. PM:20350979. doi:10.1212/WNL.0b013e3181d76a93.
- Williams, A. L., R. E. Watson, and J. M. Desesso. 2012. Developmental and reproductive outcomes in humans and animals after glyphosate exposure: A critical analysis (Review). J. Toxicol. Environ. Health B 15:39–96. doi:10.1080/10937404.2012.632361.
- Willmes, D. M., S. L. Helfand, and A. L. Birkenfeld. 2016. The longevity transporter mIndy (Slc13a5) as a target for treating hepatic steatosis and insulin resistance. Aging (Albany NY) 8:208–09. doi:10.18632/aging.100907.
- Woodruff, T. J., A. R. Zota, and J. M. Schwartz. 2011. Environmental chemicals in pregnant women in the United States: NHANES 2003-2004. Environ. Health Perspect. 119:878–85. PM:21233055. doi:10.1289/ehp.1002727.
- Wu, H., K. Kerr, X. Cui, and GA. Churchill: MAANOVA: A software package for the analysis of spotted cDNA microarray experiments. The analysis of gene expression data: methods and software. Edited by: Pargmigiani G, Garrett E, Irizarry R and Zeger S. 2002, New York, Springer
- Xu, W., L. Wu, M. Yu, F. J. Chen, M. Arshad, X. Xia, H. Ren, J. Yu, L. Xu, D. Xu, J. Z. Li, P. Li, and L. Zhou. 2016. Differential roles of cell death-inducing DNA fragmentation factor-alpha-like effector (CIDE) proteins in promoting lipid droplet fusion and growth in subpopulations of hepatocytes. J. Biol. Chem. 291:4282–93. PM:26733203. doi:10.1074/jbc.M115.701094.
- Yang, W., Y. Wang, Q. Pu, S. Ye, Q. Ma, J. Ren, G. Zhong, L. Liu, and W. Zhu. 2014. Elevated expression of SLC34A2 inhibits the viability and invasion of A549 cells. Mol Med Rep 10:1205–14. doi:10.3892/mmr.2014.2376.
- Yang, Y. H., S. Dudoit, P. Luu, D. M. Lin, V. Peng, J. Ngai, and T. P. Speed. 2002. Normalization for cDNA microarray data: A robust composite method addressing single and multiple slide systematic variation. Nucl. Acids Res. 30:e15. doi:10.1093/nar/30.4.e15.
- Zhang, Z., X. F. Yang, K. Q. Huang, L. Ren, S. Zhao, W. F. Gou, D. F. Shen, H. Z. Sun, Y. Takano, and H. C. Zheng. 2016. The upregulated β-catulin expression was involved in head-neck squamous cell carcinogenesis by promoting proliferation, migration, invasion, and epithelial to mesenchymal transition. Tumor Biol. 37:1671–81. doi:10.1007/s13277-015-3901-5.
- Zhou, C., M. M. Tabb, E. L. Nelson, F. Grun, S. Verma, A. Sadatrafiei, M. Lin, S. Mallick, B. M. Forman, and K. E. Thummel. 2006. Mutual repression between steroid and xenobiotic receptor and NF-kB signaling pathways links xenobiotic metabolism and inflammation. J. Clin. Invest. 116:2280–89. doi:10.1172/JCI26283.
- Zvonic, S., A. A. Ptitsyn, S. A. Conrad, L. K. Scott, Z. E. Floyd, G. Kilroy, X. Wu, B. C. Goh, R. L. Mynatt, and J. M. Gimble. 2006. Characterization of peripheral circadian clocks in adipose tissues. Diabetes 55:962–70.