
ABSTRACT
Imperial Valley, California has become increasingly hot, dry, and polluted over the past decade. Particulate matter (PM) levels are amongst the highest in this State, associated with significantly higher asthma prevalence among children in the region compared to national and state averages. The present study was performed to test the hypothesis that Imperial Valley PM by size and chemical composition might possess allergenic properties following introduction into murine lungs without prior sensitization to a known allergen with size fraction as a determining factor. In acute exposure experiments, BALB/c male mice were administered a single 50-μl oropharyngeal aspiration of nanopure water (H2O; control) or a stock 1 μg/μl PM solution. In sub-acute exposure experiments, male and female mice were treated with a total of six 16.6-μl intranasal instillations of H2O or stock PM solution over the course of 14 days. In all experiments, pulmonary function tests were performed 24 hr after the final instillation followed by necropsies for the collection of biological samples. Inflammatory responses measured via cellularity in histopathological tissue sections as well as significant, marked influxes of eosinophils and lymphocytes were noted in the bronchoalveolar lavage fluid in mice administered PM compared to control. Allergic responses, including airway hyperresponsiveness and significantly increased expression of IL-1ß, were found in male mice exposed to either PM2.5 or ultrafine (PMUF). A combination of all three size fractions of PM from Imperial Valley initiated atopic and asthmatic-like symptoms in the lungs of mice in the absence of additional allergen or preexisting condition.
Introduction
Particulate matter (PM) levels in Imperial Valley, California are among the highest in this State (American Lung Association Citation2018; English et al. Citation2022). This dry and agriculturally rich region generates heterogenous PM from a wide variety of sources ranging in size from ultrafine (PMUF)(da <0.1 μm) to super-coarse (da >10 μm). These sources include agriculture, cattle feedlots, vehicles idling at the border crossing, and dust from the lakebed of the Salton Sea. Dust storms in Imperial Valley are common and appear to be increasing in frequency with the continual and rapid shrinking of the Salton Sea, a large saline lake in the northwest corner of the Valley (Biddle et al. Citation2022; Frie et al. Citation2019). Since 1999, the 375 square mile lake shrunk by over 45 square miles, leaving the playa exposed and increasing windblown dust levels in the surrounding communities. Recent observational studies demonstrated a significant association between decreasing lake elevation and increased PM in the region (Jones and Fleck Citation2020), as well as markedly higher levels of asthmatic symptoms in children residing near the Salton Sea compared to the national level (Farzan et al. Citation2019; Tracking California Citation2018). Many Imperial Valley residents attribute these adverse health impacts to exposure to PM originating from the dried Salton Sea lakebed.
Previously, D’Evelyn et al. (Citation2021) examined biological responses to size-fractionated ambient PM obtained from the Imperial Valley using an immortalized cell line of human macrophages. Data demonstrated significant differences in cytokine expression, measured via quantitative polymerase chain reaction, when cells were exposed to “coarse” PM10, “fine” PM2.5, or “ultrafine” PMUF compared to a H20 control. In vitro, PM10-exposed macrophages exhibited significant elevation in interleukin 1-beta (IL-1ß) as well as other inflammatory cytokines. Further, in PMUF-exposed macrophages enhanced cytochrome P450 1a1 (CYP1a1), a key enzyme involved in metabolism of drugs and environmental chemicals was detected compared to H20-exposed cells (D’Evelyn et al. Citation2021). Characterization of the Imperial Valley PM samples demonstrated significant differences in the chemical and bioaerosol composition for each size fraction associated with significantly elevated levels of endotoxin and ß-glucans. Findings from this in vitro study led us to conclude that each of the different PM size fractions initiated distinct mechanisms of toxicity and inflammation in exposed macrophages. These observations provided the foundation and rationale for the present in vivo study. Aliquots of the same PM samples used in D’Evelyn et al. (Citation2021) - collected from 6/20/18–7/10/18 - were utilized in this study.
The Imperial Valley of California is characterized by consistent, year-round, moderate-to-high levels of ambient PM (annual average 12.5 μg/m3) accompanied by episodic spikes of higher PM levels. These spikes are often due to dust storms which significantly increased the levels of PM10. Periodic events such as field burns also elevated the levels of PM2.5 and PMUF. Late June and July represent one of the hottest and driest times of the year in Imperial Valley partly because the period falls between agricultural harvest seasons when fields are being turned over, and stubble burning is likely to occur (University of California Agriculture and Natural Resources Citation2020; Weather Spark Citation2022). Particulate matter was collected during these summer months to capture seasonal heterogeneity of PM and some of the episodic spikes that arise with dust storms and field burns. In an attempt to better understand the impact of various pollution events in the Valley, single and repeated exposure paradigms were employed to simulate acute and sub-acute scenarios, respectively, in an in vivo mouse model. The focus of this study is two-fold to: 1) determine the acute effects of exposure to different sizes of PM from Imperial Valley in adult male mice and 2) the influence of repeated exposure to the same size-fractionated PM from Imperial Valley in male and female mice. The rational of our experimental design was to assess whether different-sized particles administered on an equal mass basis might initiate in a differential inflammatory response based upon size and chemistry. Due to the previously observed responses in vitro it was postulated that atopy and asthmatic-like symptoms might be induced in vivo with differing size-fractionated Imperial Valley PM in the absence of an allergen. It was further hypothesized that each PM size fraction might initiate this response through distinct mechanisms.
Methods
PM collection and extraction
Ambient PM was collected from Imperial Valley, California over the course of three weeks (6/20/18–7/10/18) with a state-of-the-art mobile sampling unit described in D’Evelyn et al. (Citation2021). The sampling unit was designed to be controlled remotely and collect size-segregated PM 24 hr/day. Size segregation was accomplished using multiple high flow-rate, cascade impactor-based samplers (Demokritou et al. Citation2002) stacked in series to collect particles on separate filters. The unit contained a total of 10 impactors, each containing separate filters for PM2.5 and PMUF. PM10 was collected separately from a single-stage sampler located upstream of the 10 stacked samplers.
Cut filter wedges from all size fraction filters (PMUF, PM2.5 and PM10) were weighed prior to and after extraction to confirm the mass of extracted PM. Solvent extraction of PM2.5 and PMUF involved a multi-step process – including a combination of bath style sonication in different solvents of varying polarity, liquid-liquid extraction, microporous membrane filtration, solvent removal and extensive gravimetric analyses further described by Bein and Wexler (Citation2014). PM10 was extracted by scraping particles from the surface of the filter using a sterilized metal spatula.
PM stock sample preparation
After particle extraction, dry PMUF, PM2.5, and PM10 samples were weighed gravimetrically and resuspended in nanopure water to a concentration of 1 μg/μl. These stock solutions were sonicated for 1 hr and subsequently aliquoted for chemical characterization, to enable repetitive administration, and avoid continuous freeze/thaw cycles throughout the course of the experiment. Prior to animal instillations, the appropriate stock solution was sonicated for 25 min and then vortexed for 5 sec between each animal.
PM extract characterization
Total organic PM mass and composition were determined via high-resolution time-of-flight aerosol mass spectrometry (HRAMS) according to previously reported protocols (Ge et al. Citation2012; Sun et al. Citation2011). HRAMS enables detection and quantification of the elemental composition of major ions and thus, the average molar ratios—e.g. oxygen-, nitrogen-, sulfur-, and hydrogen-to-carbon (O/C, N/C, S/C, and H/C, respectively) ratios – among elements in organic PM (Aiken et al. Citation2008).
Molecular composition of the resuspended PM extracts was measured with high-resolution mass spectrometry (HRMS) that used direct-infusion nanospray ionization coupled to a linear trap quadrupole (LTQ)-Orbitrap instrument (Thermo Electron Corp.) at a mass resolving power of 60,000 m/Δm at m/z 400 in the positive ion mode. An external calibration was performed immediately prior to analysis to achieve a mass accuracy of 2 ppm. Each ionizable compound (M) in the extract sample was observed as protonated (MH+) and/or sodiated (MNa+) ions. Mass spectra were processed by subtracting the background mass spectra of the blank filter extracts, deconvoluted and deisotoped, mass corrected, and assigned to molecular formulas using a custom Matlab protocol based on heuristic mass filtering rules (Kind and Fiehn Citation2007) and Kendrick Mass (KM) defect analysis (Kendrick Citation1963) with a KM base of CH2 (methylene).
Animal exposures
Single acute or repeated sub-acute experiments occurred at separate times, with different sets of animals and exposure methodologies (). All animal protocols were reviewed and approved by the University of California, Davis Institutional Animal Care and Use Committee.
Figure 1. Protocols for acute and sub-acute exposures. each group of animals was exposed to nanopure water (H2O; control), or one of three different 1-μg/μl stock solutions of particulate matter (PM). Acute exposures (n = 8/group) involved a single 50-μl oropharyngeal instillation. Sub-acute exposures (n = 6/sex/group) involved 6 repeated 16.6-μl intranasal instillations— 3 during sensitization and 3 during challenge. Each instillation is represented in the figure as a triangle. Given all stock solutions were 1 μg/μl, non-control mice in the acute and sub-acute exposure groups received a total 50 μg or 100 μg (16.6 μg × 6 ≈ 100 μg) of PM, respectively. Abbreviations: PM10; PM2.5; and PMUF – particulate matter with an aerodynamic diameter >2.5 μm and <10 μm; 0.12.5 μm; and <0.1 μm, respectively.
Acute exposure
Adult, male, 12-week-old BALB/c mice were obtained from Envigo (Livermore, CA) and randomly divided into 4 exposure groups (n = 8/group). After a week of acclimation, mice were anesthetized with isoflurane (Western Medical Supply, Arcadia, CA) and administered a single 50 μl oropharyngeal (OPA) instillation of nanopure water (H2O; control) or stock PMUF, PM2.5, or PM10 solution. Since the stock solutions were all 1 μg/μl, all PM-exposed mice received 50 μg PM in the acute experiments.
Sub-acute exposure
Male and female 9-week-old BALB/c mice were randomly divided into 4 exposure groups (n = 6/gender/group), anesthetized with isoflurane (Western Medical Supply, Arcadia, CA) as above, and administered a total of six 16.6-μL intranasal instillations of H2O or stock PMUF, PM2.5, or PM10 solution over the course of 14 days as illustrated in the exposure protocol described in . PM-exposed mice received a total PM dose of approximately 100 μg.
Pulmonary function testing
Twenty-four hr following the final instillation, mice were anesthetized with a cocktail of telazol (50 mg/kg; Western Medical Supply, Arcadia, CA) and dexdomitor (0.7 mg/kg; Veterinary Medical School, Davis, CA) by intraperitoneal (ip) injection, and paralyzed with an intramuscular injection of succinylcholine (0.1 mg; Fisher Scientific, Pittsburgh, PA) for surgical placement of a 19-gauge intratracheal cannula and pulmonary function testing using a FlexiVent System (SCIREQ, Montreal, Canada). Ventilation was set at a frequency of 150 breaths/min with a tidal volume (volume of a resting breath) of 10 ml/kg.
Complete lung resistance, compliance, and elastance were measured, along with central airway resistance, tissue hysteresis, and tissue elastance using forced oscillation perturbation. All pulmonary function measurements were taken in triplicate and averaged for each animal. Airway hyperresponsiveness (AHR) was measured using increasing concentrations (0.25, 0.5, 1, 2, 4 and 8 mg/ml) of methacholine (MCh) – a potent bronchoconstrictor in animals and humans – nebulized through the FlexiVent system. The EC200RL (effective MCh concentration that leads to a 2-fold rise in resistance) was calculated from the MCh challenge results as a measure of AHR.
Lavage analysis and cell differentials
After pulmonary function testing, each mouse was euthanized with an ip injection of Beuthanasia-D (1 mg/ml; MWI Veterinary Supply, Los Angeles, CA). The left lung was clamped, and the right lung lobes lavaged with two 0.6-mL aliquots of PBS. Bronchoalveolar lavage (BAL) was performed with each PBS aliquot drawn in and out three times prior to collection. BAL fluid (BALF) from each aliquot was combined, the total sample measured and centrifuged at 4°C for 15 min at 2000 g. The resulting BALF supernatant was decanted for measurement of protein levels while the cell pellet was resuspended in 0.5 ml PBS. Protein measurements to assess cell permeability in BALF were made using a Lowry assay (BioRad, Hercules, CA) to measure cell permeability within 24 hr after collection. The resuspended cells were utilized for viability and total cell counts using a hemocytometer and 10 μl trypan blue stain. Cytospin slides (n = 3/mouse) were prepared by placing 100-µl cell suspensions in a Shandon Cytospin 4 (ThermoScientific, Kalamazoo, MI) to achieve an approximate count of 1.5 × 10³ cells/slide. Each slide was dried and stained with DiffQuik (American Mastertech, Lodi, CA) for cell differential analysis. A total of 500 cells were counted per mouse to determine the relative % and cells/ml of BAL macrophages, lymphocytes, eosinophils, and neutrophils.
Circulating serum immunoglobulins
Blood was collected via cardiac-puncture and placed into EDTA-coated tubes during necropsy. Blood samples were centrifuged for 15 min at 2000 g, plasma collected and frozen at −80°C for later determinations of the amount of circulating immunoglobulin E (IgE) via enzyme-linked immunosorbent assays (ELISAs; Biolegend, San Diego, CA). IgE, a type of antibody produced in mammals as a result of allergies and other conditions, was measured in the present study to observe whether PM alone, without experimental use of a known allergen (such as ovalbumin or house dust mite), was sufficient to prompt an atopic response.
Lung histopathology
The left lung was removed along with the cannulated trachea and fixed under hydrostatic pressure at 30 cm/H2O in 4% paraformaldehyde (PFA) for one hr. The fixed left lungs were then stored in 4% PFA for 24 hr and transferred to 70% ethanol for later sectioning. For each mouse, four serial transverse slices of the left lung were prepared, starting at the left main-stem bronchus. These sections were subsequently processed using an auto-technicon system and embedded 24 hr later in paraffin wax. The embedded tissue blocks were cut into 5-µm sections using a microtome and stained with hematoxylin and eosin (H&E). Stained slides were employed for semi-quantitative histopathological analyses in which the alveolar, pleural, bronchiolar, and perivascular regions of the lungs were scored for inflammation using the ordinal rubric in .
Table 1. Semi-quantitative scoring rubric used for histopathological analysis.
Cytokine analysis
During necropsy, after the right lung lobes were lavaged, the right mainstem bronchus was closed with a suture and individual lobes were removed, flash frozen in liquid nitrogen, and stored in a −80°C freezer until future use. The caudal lobe was homogenized, and tissues used in plate-based Lowry (BioRad, Hercules, CA) assays and ELISAs (Biolegend, San Diego, CA) to measure total protein and interleukin 1-beta (IL-1ß) protein, respectively. IL-1ß was selected as the cytokine to measure in lung homogenate due to the markedly high levels produced by macrophages when exposed in vitro to PM10 from Imperial Valley (D’Evelyn et al. Citation2021) IL-1ß, part of the Interleukin 1 family, is involved in the activation of the inflammasome, and has recently been identified as having a role in neutrophilia related to severe asthma (Lee and Lawrence Citation2018; Mahmutovic Persson et al. Citation2018). Lowry assays and ELISAs were performed in duplicate. All plates were read using a SpectroMax plate reader at 450 nm. IL-1ß concentrations (ELISA) were standardized to total lung protein as determined by the Lowry assay and expressed as pg/mg lung tissue.
Statistical analysis
Shapiro-Wilk tests were used to assess the normality of data residuals and transformations were performed to achieve normal distributions as necessary. One-way analyses of variance (ANOVAs) were performed to test the effect of particle size on AHR, BALF cell counts, and IL-1ß and IgE protein levels. Two-way ANOVA was performed to determine whether particle size, MCh dose, or an interaction of both variables affected airway resistance, and whether particle size, lung region, or an interaction of both variables influenced semi-quantitative histopathological scores of inflammation. Post-hoc Tukey’s Honest multiple comparison tests were used with all endpoints to determine statistical differences between specific exposure groups.
Statistical comparisons between subacute and acute exposure scenarios were not statistically analyzed due to inherent differences in the exposure scenarios. Although the same PM samples were used, the acute and sub-acute exposures involved unique exposure methodologies (OPA versus IN, respectively) and different cumulative doses. For these reasons, comparisons between the two exposure paradigms were limited to qualitative analyses of the biological responses in male mice since females were not included in the acute exposures.
Overall, no data were excluded from the acute exposure experiments, however in the sub-acute exposure scenarios, MCh values above 2 mg/ml were excluded due to an insufficient number of data points to run the ANOVA. Lack of data above 2 mg/mL of MCh was due to a decision to stop testing after an animal resistance doubled, which, for the majority of animals, occurred at or prior to reaching 2 mg/ml. All cell differential and histopathological data underwent log transformation. All significant differences were assessed at a p-value <0.05 for ANOVAs and Tukey’s tests. All statistical analyses were performed using GraphPad Prism 8 (San Diego, CA). All data were expressed in terms of the exposure group mean ± standard error of mean (SEM).
Results
PM collection and characterization
During the three weeks (6/20/18–7/10/18) PM was collected for this study, PM10 and PM2.5 concentrations were, on average, higher than the California state 24-hr standards of 35 μg/m3 and 50 μg/m3 for PM2.5 and PM10 respectively. There were three days within this timeframe in which PM10 was over 150 μg/m3 (United States Environmental Protection Agency Citation2018).
Results from the HR-AMS indicated that organic species dominated the Imperial Valley PM samples in every size fraction (). The distribution of the ionic fragments from electron-ionization of organic species (depicted in the second and third column of ) was highly complex, suggesting PM was likely composed of hundreds of different carbon-containing compounds. Further molecular composition analysis of the organic fraction with LTQ-Orbitrap HRMS confirmed the presence of hundreds of individual molecules in each size fraction. This analysis demonstrated a trend of more amines and sulfuric acid as the size fraction decreased. The proportion of hydrocarbons and oxygenated hydrocarbons, however, followed an opposite trend increasing in % with particle size such that their mass accounted for 15, 60, and 64% of the total mass of PMUF, PM2.5, and PM10, respectively.
Table 2. High-resolution time-of-flight aerosol mass spectrometry (HRAMS) results for three size fractions of particulate matter (PM).
PM exposure experiments
Results from a previous in vitro study demonstrated that when compared to a filter-blank control and all other tested PM size fractions, exposure to PM10 led to the most marked inflammatory response after 24 hr (D’Evelyn et al. Citation2021). In the present study, acute in vivo exposure to PM10 did not alter any inflammation marker or pulmonary function indices when compared to H2O exposure. However, sub-acute exposures produced different effects depending upon the PM size fraction and gender of the PM-exposed group.
Acute exposure
Pulmonary function testing
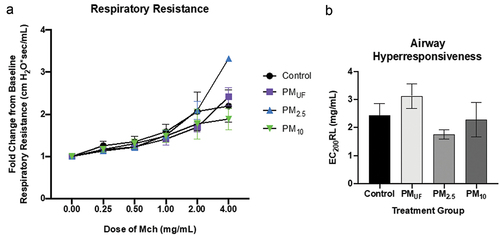
At baseline, after acute exposure, there were no significant differences in lung mechanics measurements of lung resistance, compliance and elastance, central airway resistance, tissue hysteresis, or tissue elastance due to PM size. A significantly different response was observed between the H2O and PM2.5 groups exposed to 4 mg/mL of MCh (), the difference was primarily due to a single animal in the latter group. AHR, measured with MCh challenge illustrated in presented as EC200RL, was also not significantly different between groups exposed acutely to the various PM size fractions.
Figure 2. Respiratory resistance and airway hyperresponsiveness in mice exposed acutely to PM. panel a) resistance depicted for each group as fold change from baseline, at 0 mg/ml methacholine (MCh). A two-way ANOVA was performed to determine whether particle size, MCh dose, or an interaction of both variables influenced airway resistance. Panel b) airway hyperresponsiveness as measured by the EC200RL (dose of MCh needed to double respiratory resistance). A one-way ANOVA was performed to test the effect of particle size on AHR, and a Tukey’s honest multiple comparison test was used to determine statistical differences between specific exposure groups. N = 8/group/endpoint. Statistical significance was determined at a level of p < .05 for all ANOVAs and Tukey’s tests.
Lavage analysis and cell differentials
Results of the acute exposure experiments revealed no marked significant differences between H2O- and PM-instilled groups in terms of total BAL cells or BAL cell differentials (). A Lowry assay on the BALF supernatant detected a significant rise in protein levels in mice exposed to PM2.5 compared to H2O (not shown). This elevation suggested increased cell permeability in lungs of the former versus the latter as more proteins moved from within the cells into the mucosal lining and thus collected by BAL. No marked alteration was noted in neutrophil counts with acute exposure to PM10 (). Lymphocyte levels were highest when males were acutely exposed to PMUF ().
Figure 3. Total cells and cell differentials from BALF collected 24 hr after a single OPA exposure to PM. panel a) graph of total cell counts reflected as the number of cells per mL of BALF collected. Panels b-d) graphs of cell differentials calculated after representative counts of 500 cells/mouse. For each endpoint, data were analyzed using a one-way ANOVA to test the effect of particle size on cell counts/mL, and a post-hoc Tukey’s multiple comparison test to determine statistical differences between specific exposure groups. N = 8/group for all endpoints. Statistical significance was determined at a level of p < .05 for all ANOVAs and Tukey’s tests. A bracket indicates a significant difference between groups exposed to different PM size fractions.
Figure 4. BALF cell differentials performed for male mice 24 hr post acute (a-c) exposure to PM. cells were calculated based on the number of cells counted per ml BALF and represented graphically as a fold change from control (normalized to 1). Statistical differences between groups with the same exposure scenarios were determined by one-way ANOVAs to test the effect of particle size on cells/mL (N = 8). Statistical significance was determined at a level of p < .05 for all ANOVAs and Tukey’s tests. The asterisk (*) signifies a significant (p < .05) difference from control, and brackets signify significant (p < .05) differences between groups exposed to different PM size fractions.
Circulating serum immunoglobulins and cytokine analysis
Circulating IgE levels were not detectable in the blood serum of any acute exposure group (data were not shown). A difference in the response to size-fractioned PM was found in the amount of IL-1β protein present in lung homogenate after acute exposure (). PMUF-exposed males demonstrated increased levels of IL-1β protein versus control and other exposure groups ().
Figure 5. Protein levels of IL-1ß in lung homogenate 24 hr post-acute (a) exposure to PM. IL-1ß protein levels were measured via enzyme-linked immunosorbent assays (ELISAs), and statistical significance was calculated with a one-way ANOVA to test the effect of particle size on IL-1 ß (N = 8). Protein levels were represented graphically as a fold change from control (normalized to 1). Statistical significance was determined at a level of p < .05 for all ANOVAs and Tukey’s tests. The asterisks (*) signify significant (p < .05) differences from the H2O-exposed control group, and brackets signify significant (p < .05) differences between groups exposed to different PM size fractions.
Figure 6. Protein levels of IL-1ß in lung homogenate 24 hr after a single OPA exposure to PM. the graph shows levels of interleukin 1 beta (IL-1ß) protein measured in homogenates of the right caudal lung lobe via an enzyme-linked immunosorbent assay. Data were analyzed with a one-way ANOVA to determine the effect of particle size on IL-1ß protein levels, and a post-hoc Tukey’s multiple comparison test to determine statistical differences between specific exposure groups. N = 8/group. Statistical significance was determined at a level of p < .05. The asterisk (*) signifies a significant (p < .05) difference from control.
Lung histopathology
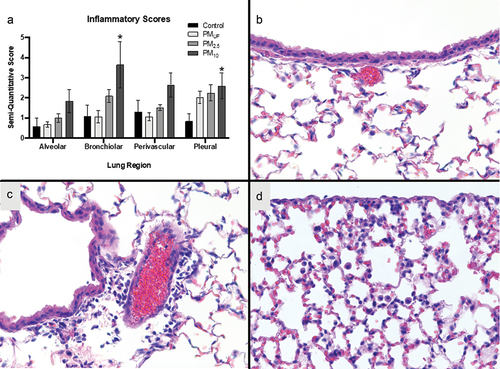
Semi-quantitative histopathological scoring of the fixed left lung tissue sections from acutely exposed animals demonstrated significant rise in bronchiolitis and pleuritis in mice treated with PM10 compared to H2O, but no other marked exposure-related differences were detected ().
Figure 7. Inflammation in the alveolar, bronchiolar, perivascular, and pleural regions of the lungs after acute PM exposure. panel a) graph of semi-quantitative scores of inflammation in four different lung regions. Each bar is a group mean ± SEM (n = 8/group). The asterisk (*) signifies a significant (p < .05) difference from the H2O-exposed control as measured by a two-way ANOVA to determine whether particle size, lung region, or an interaction of both variables influenced inflammatory scores. Panels b-c) photo micrographs of H&E-stained left lung sections. Bronchiolar tissues from a control are shown in panel B. Bronchiolar, perivascular, and pleural tissues from a PM10-exposed male are presented in Panels C-D. These micrographs are representative of average effects observed in PM10 acutely exposed mice.
Sub-acute exposure
Pulmonary function testing
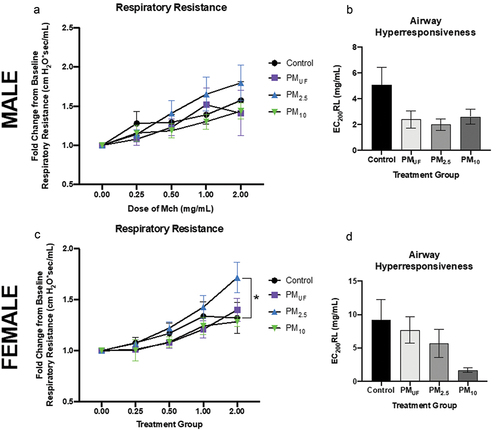
Similar to the acute exposure experiment, no significant differences were observed in baseline lung mechanics measurements conducted following sub-acute exposures to PMUF, PM2.5 or PM10 (). Both male and female mice showed the highest change from baseline resistance, with increasing doses of MCh, when exposed to PM2.5 as opposed to H2O (). This was only significant in female mice, and only at the highest shown MCh dose of 2 mg/ml (). Qualitatively, AHR were non-significantly different () associated with no obvious PM size-related effects in males (). No significant differences were observed in male mice sub-acutely exposed.
Figure 8. Respiratory resistance and airway hyperresponsiveness in male and female mice exposed sub-acutely to PM. Panels a & c) resistance is depicted for each group as fold change from baseline, at 0 mg/ml methacholine (MCh). Data were analyzed using two-way ANOVAs to determine whether particle size, MCh dose, or an interaction of both variables predicted airway resistance. N = 6/group/gender. Panels b & d) airway hyperresponsiveness as measured by the dose of MCh needed to double respiratory resistance (EC200RL). One-way ANOVAs were performed to test the effect of particle size on AHR. N = 6/group/gender. A post-hoc Tukey’s honest multiple comparison test was used after each ANOVA to determine statistical differences between specific exposure groups. Statistical significance was determined at a level of p < .05 for all ANOVAs and Tukey’s tests. The asterisk (*) in panel C indicates a significant difference between the PM2.5- and H2O (control)-exposed female mouse groups exposed to MCh at 2 mg/ml.
Lavage analysis and cell differentials
After sub-acute exposures, no significant differences were noted between male and female mice with respect to BALF cell endpoints. However, more endpoints were changed in male versus female mice ( versus ) exposed to PM as opposed to H2O. PM10-exposed male mice exhibited significantly more eosinophils, neutrophils, and lymphocytes than H2O-exposed controls (). The eosinophil and lymphocyte numbers () observed in PM10-exposed male mice were also significantly higher than those in PMUF and PM2.5-exposed males. BALF endpoint comparisons in PM10- and H2O-exposed female mice yielded only increased lymphocyte numbers in the former (). Differences between PM-exposed females were limited to an elevation in BALF neutrophils of PM2.5-exposed mice versus PMUF-exposed counterparts (). Sub-acute exposure to PM10 produced a significant increase in eosinophils, neutrophils, and lymphocytes when compared to all other exposure groups (, respectively).
Figure 9. Total cells and cell differentials collected from BALF in male mice 24 hr post sub-acute exposure to PM. panel a) graph of total cell counts reflected as the number of cells per mL of BALF collected. Panels b-d) graphs of cell differentials based on representative counts of 500 cells/mouse. For each endpoint, data were analyzed using a one-way ANOVA to test the effect of particle size on cell counts/ml, and a post-hoc Tukey’s multiple comparison test to determine statistical differences between specific exposure groups. N = 6/gender/group for all endpoints. Statistical significance was determined at a level of p < .05 for all ANOVAs and Tukey’s tests. The asterisk (*) signifies a significant (p < 0.05) difference from control, and brackets signify significant (p < .05) differences between groups exposed to different PM size fractions.
Figure 10. Total cells and cell differentials collected from BALF in female mice 24 hr post sub-acute exposure to PM. panel a) graph shows total cell counts reflecting the number of cells per mL of BALF collected. Panels b-d) graphs of cell differentials based upon representative counts of 500 cells/mouse. For each endpoint, data were analyzed using a one-way ANOVA to test the effect of particle size on cell counts/mL, and a post-hoc Tukey’s multiple comparison test to determine statistical differences between specific exposure groups. N = 6/gender/group for all endpoints. Statistical significance was determined at a level of p < 0.05 for all ANOVAs and Tukey’s tests. The asterisk (*) signifies a significant (p < .05) difference from control, and brackets signify significant (p < .05) differences between groups exposed to different PM size fractions.
Figure 11. BALF cell differentials performed for male mice 24 hr post sub-acute (d-f) exposure to PM. cells were calculated based on the number of cells counted per ml BALF and represented graphically as a fold change from control (normalized to 1). Statistical differences between groups with the same exposure scenarios were determined by one-way ANOVAs to test the effect of particle size on cells/mL (N = 6). Statistical significance was determined at a level of p < .05 for all ANOVAs and Tukey’s tests. The asterisk (*) signifies a significant (p < .05) difference from control, and brackets signify significant (p < .05) differences between groups exposed to different PM size fractions.
Circulating serum immunoglobulins and cytokine analysis
With sub-acute exposure, male versus female mice produced different trends in the levels of IgE in blood serum. Levels of IgE in serum were significantly higher in males exposed to PMUF or PM2.5 versus H2O (). In contrast, no marked inter-group differences were found in serum IgE levels of female mice (). PM10-exposed males exhibited elevated levels of IL-1β compared to control and other exposure groups. No marked differences in IL-1β protein were detected in sub-acutely exposed female mice.
Figure 12. Levels of IL-1ß and IgE and in male and female mice 24 hr post-sub-acute exposure to PM. Panels a & c) graphs show levels of interleukin 1 beta (IL-1ß) measured in homogenates of the right caudal lung lobe via enzyme-linked immunosorbent assay (ELISA). Panels b & d) graphs show IgE measured via ELISA in the blood serum. Statistically significant differences were determined using four separate one-way ANOVAs, one per parameter per sex, and post-hoc Tukey’s multiple comparison tests were used to determine statistical differences between specific exposure groups. N = 6/gender/group for all endpoints. Statistical significance was determined at a level of p < .05 for all ANOVAs and Tukey’s tests. The asterisks (*) signify significant (p < .05) differences from the H2O-exposed control group, and brackets signify significant (p < .05) differences between groups exposed to different PM size fractions.
Lung histopathology
Similar analysis of tissues from sub-acute exposure groups showed that PM10-exposed male mice displayed greater magnitude of bronchiolitis and pleuritis relative to all other exposure groups (). Perivasculitis was significantly greater in males exposed to PM10 or PMUF versus H2O (). The only significant differences noted among female mice were greater levels of bronchiolitis relative to controls when exposed to PM10 or PM2.5, and perivasculitis relative to controls when exposed to PM10 or PM2.5 (). In both lung regions in females, PM2.5-related inflammation was significantly greater than that due to PMUF, but not significantly different from the PM10 exposure group ().
Figure 13. Semi-quantitative histopathological scores of inflammation in four regions of the lung in male (a) and female (b) mice. each bar represents a group mean ± SEM of the product of inflammation extent and severity scores (n = 6/sex/group). Statistical differences (p < .05) were determined by a two-way ANOVA to determine whether particle size, lung region, or an interaction of both variables influenced inflammatory scores. Asterisks (*) signify significant (p < .05) differences from control, and brackets signify significant (p < .05) differences between PM-exposed groups.
Discussion
The present study demonstrated differences in the biological responses to three different size fractions of PM from Imperial Valley, California using two unique in vivo exposure scenarios. A previous screening of this same Imperial Valley PM in vitro demonstrated significant PM size-related differences in responses produced in an immortalized cell line of macrophages (D’Evelyn et al. Citation2021). Extrapolating from in vitro results, it was expected that PM10 might induce a significantly more robust inflammatory response compared to control as well as other two size fractions. Data demonstrated the importance of in vivo studies, as the resulting biological responses were influenced by the following measured factors: exposure methodology, PM size, and animal gender.
One major limitation of this study was the inability to compare acute and sub-acute exposure methodologies quantitatively and statistically. The repeated dose, sub-acute exposure to PM not only increased the number of times the animals were dosed, but also doubled the total dose of PM delivered relative to acute exposure (100 μg versus 50 μg, respectively). Previous unpublished in vivo studies with BALB/c mice from our lab showed that an acute intranasal dose of PM over 50 μg leads to suppression of the inflammatory response in vivo, and thus the biological response is more difficult to quantify. In addition, due to the nature of the exposure timings, the dose rate was decreased in the subacute exposures relative to the acute protocol. An additional limitation to compare the sub-acute to acute exposure in this study is the route of PM administration: oropharyngeal (acute) versus intranasal (sub-acute) aspirations. However, Hulland et al. (Citation2016) demonstrated that administration of IL-13 protein (an interleukin involved in many of the biological responses related to atopy such as IgE production) by oropharyngeal and intranasal administration led to comparable responses in BALB/c mice. To the best of our knowledge, there is no current study directly comparing these two exposure methodologies with PM. However, it is conceivable that there are differing distinct particle translocations between these two methodologies. Intranasal instillations are more likely to have particles reach the brain through nose to brain exposure, whereas oropharyngeal administration is a more direct line to the lungs and thus less translocation is observed. Translocation outside the lungs was beyond the scope of this study.
Acute exposure was only conducted in male animals; thus, no gender comparison was conducted for a single exposure scenario. Sub-acute exposure was conducted with both male and female mice and a difference was noted in the biological responses to PM. Overall, male mice demonstrated the most significant inflammatory responses, as measured in BALF, lung homogenate proteins, and lung tissue sections with exposure to PM10 versus H2O. The inflammatory responses in female mice were more varied in that exposure to PM2.5, in addition to exposure to PM10, also induced a significant response, measured as neutrophilia, bronchiolitis and perivasculitis. As described in the review by Clougherty (Citation2010), many epidemiological studies attempted to understand the role of gender in the respiratory health effects of air pollution and found the difference depends predominantly upon age, co-exposure, and preexisting conditions. Male and female animals of the same age were exposed to the exact same exposure protocol and still a difference in responses was found. This led us to believe that there were mechanistic differences in the manner in which PM of different size fractions reacted in lungs of male and female animals.
A single PM size fraction did not stand out as invoking or creating a greater biological response. Infiltration of immune cells into the airspace observed via cell counts of the BALF and histopathological scoring were most significant after exposure to PM10, whereas increased levels of IL-1ß was detected significantly above control in mice exposed to both PM10 and PMUF, and changes in pulmonary function were found most significantly after exposure to PM2.5. These measures and potential mechanisms for each are discussed in the following three sections.
Cellularity and inflammation
The histopathological inflammation scores () differed among groups acutely exposed to different PM size fractions. This scoring was based upon a semi-quantitative methodology () and had the limitation of being somewhat subjective to the scorer. In order to account for this, all scoring was conducted by a single, blinded individual. Significantly increased pleuritis and bronchiolitis were observed in mice acutely exposed to PM10, but not PM2.5 or PMUF (). There was additionally enhanced influx of inflammatory cells to all regions (alveolar, bronchiolar, pleural, and perivascular) of the lungs. These data, indicating a marked increased inflammatory response to PM10 versus the other two size fractions, are in agreement with our in vitro studies (D’Evelyn et al. Citation2021) which demonstrated elevation in several inflammatory markers such as IL-1ß, IL-8, COX-2 and IL-6 with exposure to PM10 compared to the smaller size fractions. These results are unusual, as smaller size fractions often initiate more severe responses due to increased surface area and or elevated particle number (Mack, Madl, and Pinkerton Citation2019). The inflammatory potential of PM10 is not frequently measured in the data due to the assumption that it cannot be inhaled into the deep lung. However, our results are also consistent with an in vitro study of PM2.5 and PM10 from Mexicali (immediately South of Imperial Valley) that demonstrated exposure to both PM2.5 and PM10 induced an inflammatory response in murine monocytes (Osornio-Vargas et al. Citation2011).
The composition of PM10 from Imperial Valley () is not markedly distinct from the other two size fractions based upon data from the HR-AMS. However, chemical analysis of the bioaerosols present in each PM size fraction (Supplemental ) demonstrates a significant increase in both endotoxin and ß-glucans in PM10 compared to PMUF, PM2.5 and H2O control. Sub-acute exposure of PM10 produced influxes of eosinophils and lymphocytes into the lung that were not observed after acute exposure. This inflammatory profile (increased eosinophils and lymphocytes) was also observed by Fogelmark, Thorn, and Rylander (Citation2001) with in vivo inhalation of (1→3)ß-D-glucans, components of fungal cell walls. As PM is a mixture of components, it is possible that ß-D-glucans in PM10 were influencing the inflammatory profiles noted in the present study. However, an additional study, with ß-glucans removed, needs to be done to validate this hypothesis. The combination of increased levels of eosinophils and lymphocytes in BALF was also reported in a human trial by Gripenbäck et al. (Citation2005) in which subjects were exposed to pinewood. Wood dust is not a prevalent pollutant in Imperial Valley. However, study findings by Gripenbäck et al. (Citation2005) suggest the inflammatory profiles found here may be induced by one of likely many mechanisms that culminate in similar inflammatory responses in the lungs.
IL-1ß & the inflammasome
IL-1ß protein was increased in the lung homogenate of male mice exposed acutely to PMUF and sub-acutely to PM10. IL-1ß levels are known to rise after activation of the inflammasome – an innate immune system receptor responsible for inducing inflammation. This induction might be activated directly by either PM or bioaerosols (Borthwick Citation2016; Latz, Xiao, and Stutz Citation2013; Yazdi et al. Citation2010; Zheng et al. Citation2018). The precise mechanisms of inflammasome activation are debated in the literature, but it is understood that the release of IL-1ß may occur during the priming and/or after activation of the immune response (Bauernfeind et al. Citation2009; Netea et al. Citation2009; Yang et al. Citation2019). Since IL-1ß levels appeared to be affected by the PM size fraction and exposure paradigm, it is possible that the increased IL-1ß levels (versus H20 control group) measured in the acute and sub-acute experiments reflected different stages of the inflammasome activation process. The IL-1ß observed elevation in PMUF-exposed males after acute exposure may indicate a more rapid mechanism by direct inflammatory stimulus; whereas the increase found in PM10-exposed males after subacute exposure may indicate activation of an immune response via a longer, more indirect path.
Pulmonary function
No significant inter-group differences in lung function were detected at the baseline dose of MCh (). However, as the MCh dose rose, the change in respiratory resistance appeared to differ depending upon the exposure group. Mice were kept on the FlexiVent up until the respiratory resistance doubled, or until they reached the highest MCh dose of 16 mg/ml. This protocol limited the dose-response data collected, as not all animals were continued to be exposed to the same MCh dose. The decision to operate the MCh challenge in this manner was determined by the operator after several mice died mid-ventilation when the respiratory resistance far exceeded a doubling from baseline. Across exposure scenarios, respiratory resistance in mice exposed to PM2.5, versus other size fraction exposures, consistently changed the most from baseline to the highest dose of MCh reached. Although AHR is a measurement of change in resistance, exposure that led to the most hyper-responsive airways was not PM2.5. No exposure scenario resulted in significant differences in AHR between exposure groups ().
Conclusions
Data demonstrated throughout the literature that PM alone cannot induce the onset of new asthma without the presence of an additional stressor (McConnell et al. Citation2002). This in vivo study demonstrated that, in this model, PM from Imperial initiated atopy and asthmatic-like symptoms without additional stressors. These findings are supported by epidemiological studies by Johnston et al. (Citation2019) that measured asthmatic symptoms (wheezing and coughing) in children with no previous asthma diagnosis residing near the Salton Sea. Our findings indicate factors that might lead to atopy and asthmatic symptoms with the presence of increased bioaerosols in PM10; however, the mechanism(s) underlying inflammatory responses are not clear. Although the response to each size fraction was measured separately in this study, Imperial Valley residents would rarely, if ever be exposed to a single size of PM. Thus, the fact that PM10 produced inflammation, PMUF increased IL-1ß with acute but not sub-acute exposure and PM2.5 initiated respiratory resistance does not weaken these results but enhances the argument that exposure to Imperial Valley PM leads to a full range of asthmatic-like symptoms. This break down of measurements, along with further chemical characterization is a start to understanding the underlying mechanisms.
Supplemental Material
Download PNG Image (76.7 KB)
Acknowledgments
We would like to thank Dale Uyeminami, Radek Abarca and Krysta Zmich for their laboratory assistance, Dr. Rona M. Silva for her editorial assistance, and Humberto Lugo and Comite Civico del Valle for their help in engaging the community and selecting the collection site.
Disclosure statement
No potential conflict of interest was reported by the author(s).
Data availability statement
The data that support the findings of this study are available from the corresponding author, SMD, upon reasonable request.
Supplementary material
Supplemental data for this article can be accessed online at https://doi.org/10.1080/15287394.2023.2257232
Additional information
Funding
References
- Aiken, A. C., P. F. DeCarlo, J. H. Kroll, D. R. Worsnop, J. A. Huffman, K. S. Docherty, I. M. Ulbrich, C. Mohr, J. R. Kimmel, D. Sueper, et al. 2008. O/C and OM/OC ratios of primary, secondary, and ambient organic aerosols with high-resolution time-of-flight aerosol mass spectrometry. Environ. Sci. Technol. 42:4478–85. doi:10.1021/es703009q.
- American Lung Association. 2018. State of the air 2018. California: American Lung Association Chicago, IL. Accessed November 18, 2018. https://saportakinsta.s3.amazonaws.com/wp-content/uploads/2018/04/state-of-the-air-1.pdf.
- Bauernfeind, F. G., G. Horvath, A. Stutz, E. S. Alnemri, K. MacDonald, D. Speert, T. Fernandes-Alnemri, J. Wu, B. G. Monks, K. A. Fitzgerald, et al. 2009. Cutting edge: NF-κB activating pattern recognition and cytokine receptors license NLRP3 inflammasome activation by regulating NLRP3 expression. J. Immunol. 183(2):787–91. doi:10.4049/jimmunol.0901363.
- Bein, K. J., and A. S. Wexler. 2014. A high-efficiency, low-bias method for extracting particulate matter from filter and impactor substrates. Atmos. Environ. 90:87–95. doi:10.1016/j.atmosenv.2014.03.042.
- Biddle, T., R. Chakraborty, Q. Li, M. Maltz, J. Gerrard, and D. D. Lo. 2022. The drying Salton Sea and asthma: a perspective on a “natural” disaster. Calif. Agr. 76 (1):27–36. doi:10.3733/ca.2022a0003.
- Borthwick, L. A. 2016. The IL-1 cytokine family and its role in inflammation and fibrosis in the lung. Semin. Immunopathol. 38:517–34. doi:10.1007/s00281-016-0559-z.
- Clougherty, J. E. 2010. A growing role for gender analysis in air pollution epidemiology. Environ. Health Perspect. 118:167–76. doi:10.1289/ehp.0900994.
- Demokritou, P., I. G. Kavouras, S. T. Ferguson, and P. Koutrakis. 2002. Development of a high volume cascade impactor for toxicological and chemical characterization studies. Aerosol Sci. Technol. 36 (9):925–33. doi:10.1080/02786820290092113.
- D’Evelyn, S. M., C. F. A. Vogel, K. J. Bein, B. Lara, E. A. Laing, R. A. Abarca, Q. Zhang, L. Li, J. Li, T. Nguyen, et al. 2021. Differential inflammatory potential of particulate matter (PM) size fractions from Imperial Valley, CA. Atmos. Environ. 244:117992. doi:10.1016/j.atmosenv.2020.117992.
- English, P., L. Olmedo, E. Bejarano, H. Lugo, E. Murillo, E. Seto, M. Wong, G. King, A. Wilkie, D. Meltzer, et al. 2022. The Imperial County community air monitoring network: A model for community-based environmental monitoring for public health action. Environ. Health Perspect. 125:745–801. doi:10.1289/EHP1772.
- Farzan, S. F., M. Razafy, S. P. Eckel, L. Olmedo, E. Bejarano, and J. E. Johnston. 2019. Assessment of respiratory health symptoms and asthma in children near a drying saline lake. Int. J. Env. Res. Pub. He. 16:3828. doi:10.3390/ijerph16203828.
- Fogelmark, B., J. Thorn, and R. Rylander. 2001. Inhalation of (1→3)-β-D-glucan causes airway eosinophilia. Mediators Inflamm. 10 (1):13–19. doi:10.1080/09629350123707.
- Frie, A. L., A. C. Garrison, M. V. Schaefer, S. M. Bates, J. Botthoff, M. Maltz, S. C. Ying, T. Lyons, M. F. Allen, E. Aronson, et al. 2019. Dust sources in the Salton Sea basin: A clear case of an anthropogenically impacted dust budget. Environ. Sci. Technol. 53(16):9378–88. doi:10.1021/acs.est.9b02137.
- Ge, X., A. Setyan, Y. Sun, and Q. Zhang. 2012. Primary and secondary organic aerosols in Fresno, California during wintertime: Results from high resolution aerosol mass spectrometry. J. Geophys. Res.: Atmos 117 (D19):D19. doi:10.1029/2012JD018026.
- Gripenbäck, S., L. Lundgren, A. Eklund, C. Lidén, L. Skare, G. Tornling, and J. Grunewald. 2005. Accumulation of eosinophils and T-lymphocytes in the lungs after exposure to pinewood dust. Eur. Respir. J. 25 (1):118–24. doi:10.1183/09031936.04.00059804.
- Hulland, K., K. Wetzel, P. Capodieci, M. Dowling, and J. Coote. 2016. Oropharyngeal aspiration as an alternative route of inhaled administration in a mouse model of IL-13 induced goblet cell metaplasia. C74: Models and methods in lung biology, A5928–A5928. American Thoracic Society International Conference Abstracts. doi: 10.1164/ajrccm-conference.2016.193.1_MeetingAbstracts.A5928.
- Johnston, J. E., M. Razafy, H. Lugo, L. Olmedo, and S. F. Farzan. 2019. The disappearing Salton Sea: A critical reflection on the emerging environmental threat of disappearing saline lakes and potential impacts on children’s health. Sci. Total Environ. 663:804–17. doi:10.1016/j.scitotenv.2019.01.365.
- Jones, B. A., and J. Fleck. 2020. Shrinking lakes, air pollution, and human health: Evidence from California’s Salton Sea. Sci. Total Environ. 712:136490. doi:10.1016/j.scitotenv.2019.136490.
- Kendrick, E. 1963. A mass scale based on CH2= 14.0000 for high resolution mass spectrometry of organic compounds. Anal. Chem. 35 (13):2146–54. doi:10.1021/ac60206a048.
- Kind, T., and O. Fiehn. 2007. Seven golden rules for heuristic filtering of molecular formulas obtained by accurate mass spectrometry. BMC Bioinform. 8 (1):105. doi:10.1186/1471-2105-8-105.
- Latz, E., T. S. Xiao, and A. Stutz. 2013. Activation and regulation of the inflammasomes. Nat. Rev. Immunol. 13:397–411. doi:10.1038/nri3452.
- Lee, F., and D. A. Lawrence. 2018. From infections to anthropogenic inflicted pathologies: involvement of immune balance. J. Toxicol. Environ. Health - B. 21 (1):24–46. doi:10.1080/10937404.2017.1412212.
- Mack, S. M., A. K. Madl, and K. E. Pinkerton. 2019. Respiratory health effects of exposure to ambient particulate matter and bioaerosols. Compr. Physiol. 10:1–20. doi:10.1002/cphy.c180040.
- Mahmutovic Persson, I., M. Menzel, S. Ramu, S. Cerps, H. Akbarshahi, and L. Uller. 2018. IL-1β mediates lung neutrophilia and IL-33 expression in a mouse model of viral-induced asthma exacerbation. Respir. Res. 19 (1):16. doi:10.1186/s12931-018-0725-z.
- McConnell, R., K. Berhane, F. Gilliland, S. J. London, T. Islam, W. J. Gauderman, E. Avol, H. G. Margolis, and J. M. Peters. 2002. Asthma in exercising children exposed to ozone: a cohort study. Lancet 359 (9304):386–91. doi:10.1016/S0140-6736(02)07597-9.
- Netea, M. G., C. A. Nold-Petry, M. F. Nold, L. A. B. Joosten, B. Opitz, J. H. M. van der Meer, F. L. van de Veerdonk, G. Ferwerda, B. Heinhuis, I. Devesa, et al. 2009. Differential requirement for the activation of the inflammasome for processing and release of IL-1β in monocytes and macrophages. Blood. 113(10):2324–35. doi:10.1182/blood-2008-03-146720.
- Osornio-Vargas, A. R., J. Serrano, L. Rojas-Bracho, J. Miranda, C. García-Cuellar, M. A. Reyna, G. Flores, M. Zuk, M. Quintero, I. Vázquez, et al. 2011. In vitro biological effects of airborne pm2.5 and pm10 from a semi-desert city on the Mexico–US border. Chemosphere. 83(4):618–26. doi:10.1016/j.chemosphere.2010.11.073.
- Sun, Y.-L., Q. Zhang, J. J. Schwab, K. L. Demerjian, W. N. Chen, M. S. Bae, H. M. Hung, O. Hogrefe, B. Frank, O. V. Rattigan, et al. 2011. Characterization of the sources and processes of organic and inorganic aerosols in New York City with a high-resolution time-of-flight aerosol mass spectrometer. Atmos. Chem. Phys. 11(4):1581–602. doi:10.5194/acp-11-1581-2011.
- Tracking California. 2018. Emergency department visits due to asthma, both sexes, all ages, all races/ethnicities, conventional, age-adjusted rates per 10,000, 2018, counties. Accessed May 15, 2019. https://trackingcalifornia.org/asthma/query.
- University of California Agriculture and Natural Resources. 2020. Imperial county agriculture. Accessed May 15, 2019. https://ceimperial.ucanr.edu/files/96429.pdf.
- U.S. Environmental Protection Agency. 2018. Outdoor air quality data. Accessed November 18, 2018. https://www.epa.gov/outdoor-air-quality-data/download-daily-data.
- Weather Spark. 2022. Climate and average weather year-round in Imperial. Accessed May 15, 2019. https://weatherspark.com/y/2204/Average-Weather-in-Imperial-California-United-States-Year-Round.
- Yang, Y., H. Wang, M. Kouadir, H. Song, and F. Shi. 2019. Recent advances in the mechanisms of NLRP3 inflammasome activation and its inhibitors. Cell Death Dis. 10:128. doi:10.1038/s41419-019-1413-8.
- Yazdi, A. S., G. Guarda, N. Riteau, S. K. Drexler, A. Tardivel, I. Couillin, and J. Tschopp. 2010. Nanoparticles activate the NLR pyrin domain containing 3 (NLRP3) inflammasome and cause pulmonary inflammation through release of IL-1α and IL-1β. Proceedings of the National Academy of Sciences of the United States of America 107: 19449–54. doi:10.1073/pnas.1008155107.
- Zheng, R., L. Tao, H. Jian, Y. Chang, Y. Cheng, Y. Feng, and H. Zhang. 2018. NLRP3 inflammasome activation and lung fibrosis caused by airborne fine particulate matter. Ecotox. Environ. Safe. 163:612–19. doi:10.1016/j.ecoenv.2018.07.076.