
Article title: The relationship between response-time effort and accuracy in PISA Science multiple-choice items
Authors: Michalis P. Michaelides, Militsa Ivanova, and Christiana Nicolaou
Journal: International Journal of Testing
Bibliometrics: Volume 20, Number 3, pages 187–205
DOI: http://dx.doi.org/10.1080/15305058.2019.1706529
“The relationship between response-time effort and accuracy in PISA Science multiple-choice items” was initially written in 2018 using the item timing variables, with names ending in “T,” from the publicly available “Cognitive Item Data File” of PISA 2015. In 2020, an amended and more accurate version of this data became available on the PISA website, with revised item timing variables based on the total time spent on each item (variable names ending in “TT”) for PISA 2015. The authors have corrected their results and analysis reflect the newly available item timing variables.
The following changes have been made to the text of the paper:
On page 187, an acknowledgement was added to the footnotes (“The authors would like to thank Neofytos Papapolydorou for assistance with the manipulation of the datasets.”)
On page 187, “A number of plausible explanations were graphically evaluated for items for which accuracy was higher for the rapid guessing subgroup,” was replaced with “Examinees with higher overall performance on the test items tended to engage in less rapid guessing than their lower performing peers.”
On page 194, “This response time variable served as a basis for evaluation of the student effort,” was removed and an explanation was added about the updated 2020 timing variables.
On page 195, “Data manipulation was performed in Python,” was added to the text.
On page 197, the footnote “For one simple MC item, there were no rapid guessers, so its accuracy could not be determined for rapid guessers. Fifty-two simple MC items are analyzed with respect to item accuracy” was replaced with “For a few items, there were no rapid guessers, so their accuracy could not be determined for rapid guessers.”
On pages 198-199 two paragraphs discussing plausible reasons for the inconsistent behavior for 29 items were deleted. In the updated analysis, only 9 items behaved inconsistently and a brief explanation was provided for the revised case. This issue was also discussed on page 202 and the fifth conclusion was slightly edited.
The fourth conclusion on pages 201-202 was replaced with “the percent correct for rapid guessers was not significantly different from chance for the simple MC, as anticipated (Wise & Kong, 2005). For complex MC items, the median proportion correct for rapid guessers was 0%.”
The sixth conclusion on page 202, on the relationship between the overall performance on the Science test and the extent of rapid guessing on MC items was characterized as “weakly” correlated and was changed to “moderately” correlated. The sentence “This relationship was in the expected direction: higher overall score was associated with more solution-based behavior, and less instances of rapid guessing” was replaced with “This relationship was in the expected direction and clearly supports the hypothesis that higher achieving students tend to exhibit more solution-based behavior and less instances of rapid guessing than lower performing ones, at least in low-stakes assessments.”
Additionally, , , , , , and were all replaced. Statistics throughout the “Results” section have been altered to align with the updated tables and figures and the analysis with the updated timing variables of PISA 2015.
Figure 1. Distribution of threshold values by type of item: simple (left) and complex (right) MC.
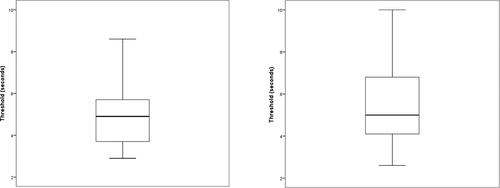
Figure 2: Boxplots for item accuracies by type of behavior and type of item: simple (left) and complex (right) MC.
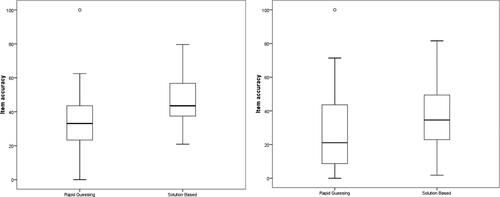
Figure 3. Scatterplots for the accuracy of rapid-guessing (RG) versus solution-based behavior (SB) for simple (left) and complex (right) MC items under sample size and key conditions.
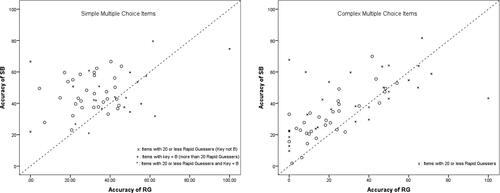
Figure 4. Histogram for the number of students engaging in solution-based behavior on the 114 MC items.
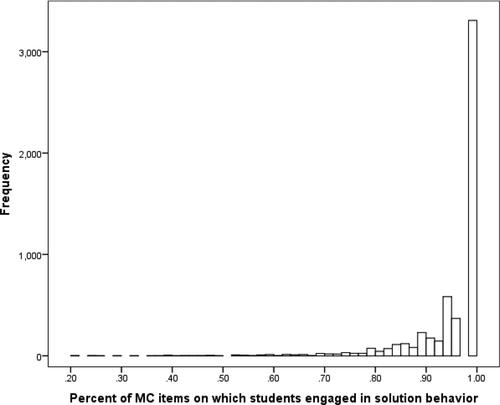
Table 1. Descriptive statistics for threshold and number of examinees by type of response behavior.
Table 2. Descriptive statistics for accuracy level by type of response behavior.
The original tables and figures are preserved below: