?Mathematical formulae have been encoded as MathML and are displayed in this HTML version using MathJax in order to improve their display. Uncheck the box to turn MathJax off. This feature requires Javascript. Click on a formula to zoom.
Abstract
The Programme for International Student Assessment (PISA) student questionnaire, despite being designed for low cognitive demand, may induce test burden due to its 306-item length, resulting in increased item nonresponse toward the questionnaire’s end. Using the PISA 2018 response data from 80 countries and a cross-classified mixed effects model, this study explored the average, cross-country, and individual nonresponse trends throughout the questionnaire. The average nonresponse probability increased from 2% at the questionnaire’s start to 11% at its end. East Asian countries displayed the flattest nonresponse trends, while South American countries showed the steepest. Individual differences were also prominent: students with a lower initial nonresponse propensity experienced a steeper increase in their nonresponse propensity as they progressed through the questionnaire, whereas those with a higher initial propensity remained at a relatively constant level. Our findings highlight the importance of the questionnaire design, the context in which it is administered, and its interaction with individual and cultural factors in shaping student response behavior. We discuss the implications for questionnaire design and researchers using PISA student questionnaire data for secondary analysis.
Item nonresponse is a frequently encountered issue in survey research, whereby respondents do not respond to one or more items on a survey (De Leeuw et al., Citation2003). Understanding the phenomenon of item nonresponse is crucial as it can substantially impact the psychometric quality of the instrument, lead to non-representative data, and introduce bias, which can undermine the reliability and validity of inferences (Meinck et al., Citation2017).
Questionnaire design is a critical component of survey research that can impact the extent of item nonresponse. Several questionnaire design features, including the mode of data collection, item format and complexity, and visual layout, have all been shown to influence item nonresponse rates in various ways (see, e.g., Denscombe, Citation2009; Dillman et al., Citation2014; Groves, Citation2009; Kmetty & Stefkovics, Citation2022). One design feature in particular that may affect item nonresponse is the position of the item on the questionnaire. Previous studies have suggested that items positioned toward the end of the questionnaire may elicit higher nonresponse rates due to a decline in respondents’ motivation and a growing fatigue (see, e.g., Bowling et al., Citation2021; Bulut et al., Citation2020; Galesic & Bosnjak, Citation2009). This mechanism may be further exacerbated in lengthier questionnaires, as they have been found to affect both the response rates and the response quality negatively (Burchell & Marsh, Citation1992; Heberlein & Baumgartner, Citation1978; Herzog & Bachman, Citation1981; Van Laar and Braeken, Citation2023). For instance, an experimental study found that longer questionnaires not only led to fewer respondents completing the questionnaire but also reduced the percentage of the questionnaire completed (compared to a shorter form of the same questionnaire), suggesting that even the respondents’ subjective perception of questionnaire length may influence their willingness to respond (Deutskens et al., Citation2004).
The mentioned studies have primarily focused on general population surveys administered via mail or the web and have targeted relatively narrow topics. To our knowledge, no systematic evidence exists on the association between item nonresponse and item position in student background questionnaires, which collect information on a broader range of topics and are administered in more stringent testing settings, such as in a classroom with a predetermined time to complete the questionnaire. Using a large-scale student background questionnaire administered to over 612000 15-year-old students from 80 countries during the Programme for International Student Assessment (PISA) 2018 (OECD, Citation2020), the present study aims to relate the sequential position of the item on the questionnaire - defined as the rank-order of an item on the questionnaire - and the item nonresponse propensity of the student - defined as a student’s tendency not to respond to an item.
PISA is a globally recognized and extensively used large-scale international assessment that measures the competencies and knowledge of 15-year-old students in reading, mathematics, and science (OECD, Citation2020). The PISA student background questionnaire is a critical component of the assessment that gathers additional information on students’ background, such as gender, socioeconomic status, immigration status, language spoken at home, educational aspirations, learning strategies, and well-being (OECD, Citation2019a). The data obtained from the questionnaire provide valuable insights into the complex dynamics that shape educational performance worldwide and is widely used in primary and secondary research to contextualize countries’ achievement scores and deliver standalone reporting indicators (Hopfenbeck et al., Citation2018; Nilsen et al., Citation2022).
The PISA student background questionnaire is commonly considered to have low cognitive demand and adequate time allocated for its completion, minimizing student burden (OECD, Citation2020). However, PISA is a low-stakes assessment where students do not face personal consequences for their performance. In low-stakes settings, students may exhibit reduced test-taking motivation, increasing nonresponse, especially on the items occurring later in the test (Wise et al., Citation2006; Wise & DeMars, Citation2005). Given that the PISA 2018 student questionnaire was administered after 2 hours of high cognitive demand achievement tests and contained 306 items in total, it is not unrealistic to expect a visible, increasing trend in item nonresponse toward the end of the questionnaire, potentially undermining the validity of research on the later items and the scales they comprise.
The study
The present study examines item nonresponse as a function of item position throughout the PISA 2018 student background questionnaire. International large-scale assessments such as PISA have traditionally prioritized achievement tests, with less emphasis on the design and validation of their questionnaires. This trend is arguably problematic given the integral role of questionnaire data in contextualizing achievement outcomes. The present study addresses the challenge of item nonresponse, focusing on its relationship with the design feature of item position. We hypothesize that items positioned later in the PISA 2018 student background questionnaire could be disproportionately affected by higher rates of nonresponse, thereby threatening the data quality and integrity. This concern is not merely technical but poses a considerable threat to the validity of conclusions drawn from these data (perhaps, particularly, in studies that contextualize achievement results with responses to the later questionnaire scales). Furthermore, if nonresponse trends exhibit systematic variation across different countries based on item position, it could seriously compromise the foundational principle of comparability that is cornerstone to PISA.
As such, the present study aims not only to document these nonresponse trends throughout the questionnaire but also to engage with their broader implications for research utilizing PISA questionnaire data, for the design and administration of the questionnaire itself, and for the interpretation of PISA findings in the global context.
Using cross-classified mixed effects models and response data from the PISA 2018 student questionnaire in 80 countries, this study examines the trend in item nonresponse as a function of sequential item position on the questionnaire. Based on the rational provided, the study is framed around the following research questions (RQ):
(RQ1) To what extent does nonresponse propensity vary throughout the questionnaire (i) for the average student and (ii) on average across students?
(RQ2) How large are the differences in item nonresponse trends between countries, and in what aspects of the trend do these differences manifest?
(RQ3) How large are the individual differences in item nonresponse trends within a country, and in what aspects of the trend do these differences manifest?
Method
Sample
The PISA 2018 consisted of a battery of core achievement (reading, mathematical, and science literacy), innovative (global competence), and optional (financial literacy) domain tests and several questionnaires to gather background information on the participating students and other major stakeholders in education (teachers, school principals, and parents). The PISA 2018 assessment took students approximately three hours to complete and included two 60-minute achievement tests, separated by a 5-min break, followed by a 15-30 min break before the student questionnaire was distributed to all students for approximately 35 min (OECD, Citation2020).
Countries & students
A total of 80 countries and jurisdictions (henceforth, ‘countries’) participated. The PISA guidelines stipulated that, subject to population size constraints, each country should aim to sample between 5200 to 6300 15-year-old students (countries’ sample sizes are provided in , Appendix A; OECD, Citation2020).
Student background questionnaire items
The student background questionnaire included 306 items distributed across 75 scales, covering a range of topics, such as, for example, students and their families’ demographic information, students’ learning strategies and attitudes, and school climate (OECD, Citation2019a). The questionnaire items were administered in a fixed sequential order to all students within each country. However, some countries did not administer certain scales, resulting in variations in the number of items administered across countries; Most countries administered at least 300 items (57 countries), while the number of items in the remaining 23 countries ranged from 169 to 299, with only four countries administering less than 220 items (i.e., North Macedonia, Lebanon, Norway, Japan; see , Appendix A; OECD, Citation2019a).
Measures
Outcome: Item nonresponse
Item nonresponse, defined as the occasions on which a student was administered an item but left the response blank (coded as 1), corresponded to the “No Response” category of the missing data in the PISA 2018 technical documentation (OECD, Citation2020). Valid responses (i.e., the occasions on which a student was administered an item and provided a response) were coded as 0. Responses on the items of the student questionnaire that were cross-referenced with student tracking forms were treated as missing-by-design, as no information on item nonresponse was available in these cases. The tracking forms were typically completed by the school or PISA officials and were used to verify or supplement the information provided by the students on the questionnaire (i.e., item responses on the scales ST001 “Grade”, ST003 “Date of Birth”, ST004 “Gender”, ST225 “Expected level of completed education”; OECD, Citation2019a, Citation2020). Additionally, the nonresponse outcome on item ST060Q01NA (‘In a normal, full week at school, how many < class periods > are you required to attend in total?’) was set to missing due to high rates of invalid responses. The PISA documentation did not explicitly discuss the high rates of invalid responses for the item. However, the format of the item (i.e., a slider) may have contributed to the high rates.
Sequential item position
The sequential item position corresponded to the item rank order in each country’s variant of the questionnaire. For interpretability of the models’ coefficients, the sequential item position variable was re-scaled in the analysis to count 50 items per unit with a starting point of zero. For example, if an item appeared fifth on the questionnaire, its sequential position was re-scaled as . However, one item was excluded from the analysis and was not assigned a sequential item position rank. This item, ST021Q01TA, was only administered to students who were not born in the country where the test was conducted, resulting in a reduced sample size (on average across countries, this item was administered to roughly 8% of the countries’ student samples; OECD, Citation2019a).
Statistical analysis
For general descriptive purposes, item-by-country nonresponse rates were calculated and examined (1) across countries to obtain average item nonresponse rates for each country and (2) across items to obtain average nonresponse rates for each questionnaire item.
Cross-classified mixed effects model
To track the students’ trends in item nonresponse propensity throughout the PISA 2018 student questionnaire, the following cross-classified mixed effects logistic regression model (De Boeck, Citation2008; Van den Noortgate et al., Citation2003) was formulated
(1)
(1)
where
and
The model considered that ), the probability of nonresponse by a student p on an item i, depended on the student’s nonresponse propensity as a function of the item’s sequential position.Footnote1 Each student had their own unique baseline nonresponse propensity from the start of the questionnaire, reflected by a person-specific random intercept
. The student’s baseline propensity gradually changed as a function of the sequential position of the item on the questionnaire, reflected by a person-specific random slope
of the item-level predictor
. Both random effects were allowed to correlate and jointly defined the individual students’ nonresponse propensity trends across the questionnaire. The means of the two random effects defined the nonresponse propensity trend for the ‘average student’,
, whereas the random-effect variances
and
quantified the individual differences in nonresponse propensity among the students.
The model incorporated two additional parameters to prevent distortion of the nonresponse propensity trends. First, the preliminary descriptive analyses pointed to unusually high nonresponse rates for items belonging to the ST006 and ST008 scales located at the item positions 6 to 14 in the questionnaire (i.e., translating into to
, when re-scaled). These spikes could pull the sequential item position trends toward themselves if left untreated. To address this potential issue, an additional predictor
(
equaled 1 if an item belonged to the ST006 and ST008 scales, and zero otherwise), with corresponding regression coefficient β, was introduced to account for the spikes in nonresponse rates for the items of the aforementioned scales. Second, to account for the fact that some items may elicit more nonresponse than expected given their sequential item position, a residual item-specific nonresponse propensity deviation was introduced as a random intercept varying by item, denoted by
.
The model counted three regression parameters and four variance-covariance parameters
. The person-specific coefficients
and
were obtained as model-implied predictions of their conditional modes. The model was independently estimated for each participating country (i.e., 80 models) using full information maximum likelihood through a first-order Laplace approximation with maximal number of iterations set to 900000 in the lme4 package (Bates et al., Citation2015) in version 4.2.0 of the R software environment (R Core Team, Citation2020).
Item nonresponse trend for the average student: Conditional effect
Together the fixed-effect parameters form the trend in nonresponse propensity for the average student, . A multivariate random-effects meta-analytical model (Cheung, Citation2015; Mavridis & Salanti, Citation2013) was used to pool the fixed-effect parameters across 80 countries. Three pooled estimates (
) were obtained, coupled with their respective confidence and prediction intervals to reflect the precision of the estimated effect sizes in the population and the heterogeneity in effect sizes across countries, respectively. The metafor package (Viechtbauer, Citation2010) was used to fit the model. The pooled nonresponse propensity trend for the average student was used to predict the probability of nonresponse across the questionnaire.
Average item nonresponse trend across students: Marginal effect
The trend for the average student in nonlinear mixed models does not necessarily reflect the average trend across all students (i.e., the difference between conditional and marginal effects), especially in the presence of heterogeneity (i.e., larger random-effect variances). Therefore, nonresponse probabilities were also computed for each questionnaire item within each country based on each individual student’s nonresponse propensity trend (i.e., finite-population average; Gelman & Hill, Citation2006). The resulting probabilities were averaged by item across students within each country and then by item across countries, yielding the pooled average item nonresponse trend across students.
Individual differences in item nonresponse trends
To provide insight into the individual differences in item nonresponse trends between students, we computed the percentages of students with a significantly positive and negative slope in each country, with a one-tailed significance level set at 5% for diagnostic purposes. These percentages summarize the extent to which students’ nonresponse propensity was predicted to remain stable, increase, or decrease throughout the questionnaire.
Results
Descriptive statistics
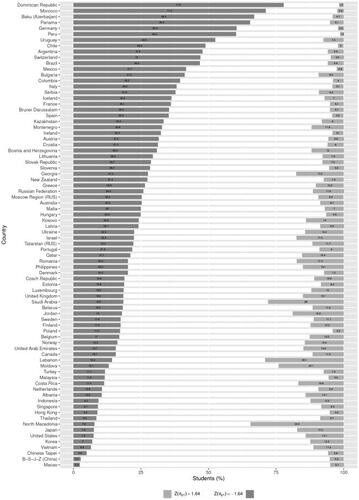
presents the country-by-item nonresponse rates providing an aggregate overview of the data. The country-wise item nonresponse rates (i.e., country-by-item nonresponse rates averaged across items per country) ranged from 0.4% in the Beijing, Shanghai, Jiangsu and Zhejiang provinces of China (henceforth, ‘B-S-J-Z (China)’) to 27% in the Dominican Republic, with a grand mean item nonresponse rate across countries of roughly 6%. The item-wise nonresponse rates (i.e., country-by-item nonresponse rates averaged across countries per item) ranged from 0.4% on the item ST022Q01TA (scale ST022 - ‘Which language do you speak at home most of the time’, item Q01TA - <Language 1>) to 14.4% − 19.6% on the items of the ST006 and ST008 scales (i.e., scales that inquired about parents’ level of completed education).
Figure 1. Country-by-item nonresponse rates on the PISA 2018 student background questionnaire.
Note. Nonresponse rates were calculated per country by item as the ratio of the number of students who did not respond to the item to the number of students who were administered said item. Countries are arranged in descending order of their mean item nonresponse rates.
The items with the highest nonresponse rates (items of the ST006 and ST008 scales) appeared early in the questionnaire (in the sixth sequential position onward), resulting in high leverage spikes in nonresponse rates in most countries. These spikes, as mentioned previously, were accounted for in the subsequent modeling of the item nonresponse trends.
Item nonresponse trend for the average student: Conditional effect
Across 80 countries, the average student responding to the PISA 2018 student questionnaire did not omit items from the outset of the student’s encounter with the questionnaire (). However, only six items deep into the 306-item questionnaire, the students had to respond to two scales asking them to provide information about their mother’s and father’s educational qualifications. The ST006 and ST008 scales posed a question stem:” Does your mother (father) have any of the following qualifications?” and comprised four items, asking students to indicate ‘yes’ or ‘no’ regarding whether their mother and father had attained the following education levels: non-tertiary post-secondary, vocational tertiary, theoretically oriented tertiary, and post-graduate. On average across 80 countries, the odds of nonresponse on the items of these scales were roughly 20 times greater than the odds of nonresponse on items in similar positions on the questionnaire (
).
Several potential issues could contribute to higher nonresponse on the ST006 and ST008 scales (Marcq & Braeken, Citation2023). For instance, students may only respond with ‘yes’ when prompted, ignoring instructions due to the sub-optimal response format. Additionally, the scales may not be appropriate for students who do not have a present mother or father, making it difficult for them to provide valid responses. Finally, expecting 15-year-olds to know their parents’ education levels may be unrealistic.
Aside from the local spikes in nonresponse on the items of the ST006 and ST008 scales, the odds of item nonresponse gradually increased throughout the questionnaire for each of its subsequent 50 items (), implying that, generally, the average student was more likely not to respond to further-positioned items than to those at the start of the questionnaire. Altogether, the average student’s probability of item nonresponse throughout the questionnaire was near-zero (i.e.,
at the start of the questionnaire and
at its end), with a minor spike to roughly 1% at the ST006 and ST008 scales.
Average item nonresponse trend across students: Marginal effect
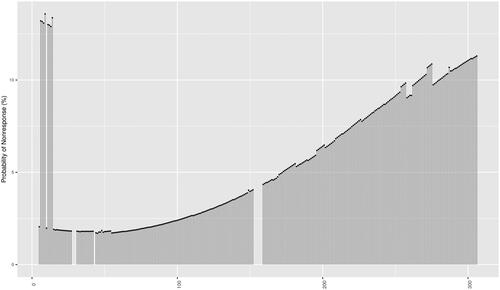
Although the results indicated that the average student barely omitted items as they progressed through the questionnaire, large individual differences in the population meant that the average of individual students’ trends better represented the true extent of nonresponse. At the start of the questionnaire, the probability of nonresponse was estimated to be relatively low, at around 2%, after which the probabilities spiked to 12-13% for the eight items of the ST006 and ST008 scales (i.e., the two spikes at the start of the questionnaire in ). The probabilities then gradually increased by approximately 1% for every 50 items initially and then by approximately 1% for every 10 to 20 items until they reached 11% on the final 306th item of the questionnaire.
Figure 2. Average item nonresponse trend across students.
Note. The figure displays the probabilities of nonresponse for each item of the questionnaire, predicted based on the cross-classified mixed effects models’ parameter estimates and
(EquationEquation 1
(1)
(1) ) for each individual student-by-item combination within each country. The probabilities were first aggregated across students per item within each country and then across countries. The probabilities are arranged in the sequence as the items appear on the questionnaire. The breaks in the curve represent the items that were free from nonresponse by design (see subsection Measures).
Between-country differences in item nonresponse trends
The prediction interval for , the cross-country pooled intercept of the nonresponse propensity trend for the average student, was wide but clearly negative (i.e.,
), implying that for most countries the probability of nonresponse for the average student was close to zero (, Appendix A). Averaging individual nonresponse trends across students within each country resulted in the probabilities of nonresponse at the start of the questionnaire ranging from approximately 0.4% in some countries of Southeast and East Asia (e.g., Malaysia, B-S-J-Z (China), Macao) to 8% − 10% in North Macedonia and Lebanon (see ).
The prediction interval for was clearly positive (i.e.,
), suggesting that the odds of item nonresponse occurring on the ST006 and ST008 scales were consistently higher than those on the items in similar positions on the questionnaire in all countries (, Appendix A). The resulting nonresponse spikes were visible in the across-students average item nonresponse trends, with the highest spike to 32% nonresponse probability in North Macedonia (see ).
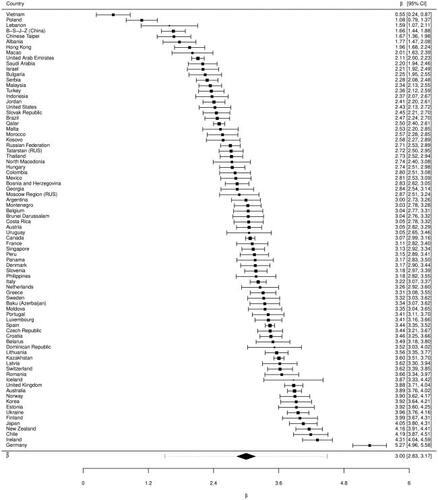
The prediction interval for , the cross-country pooled slope of the nonresponse propensity trend for the average student, was
, and hence, not uniform in direction. For each subsequent 50 items of the 306-item questionnaire, the average student’s odds of item nonresponse significantly increased in 50 countries, implying that the average student tended to show more item nonresponse the further they progressed into the questionnaire. The highest odds ratios were observed in primarily South American countries, with corresponding steeply increasing across-students average item nonresponse trends (see ). In the remaining countries, the μ1 slope of the nonresponse propensity trend for the average student was either insignificant or slightly negative, implying a more stable nonresponse propensity across the questionnaire for the average student.
Some regional commonalities among the countries with a negative trend were observed, including in several Middle Eastern, East and Southeast Asian, and Scandinavian countries. It is important to note that since the slope represents the change in nonresponse propensity, it does not directly inform the overall item nonresponse level. To understand the overall nonresponse level, one must consider both the slope and the intercept. In the case of the three regions noted, East and Southeast Asian countries exhibited stable low nonresponse propensity throughout the questionnaire, Scandinavian countries had stable low-to-moderate nonresponse propensity (albeit higher than in East Asia), and Middle Eastern countries showed stable high nonresponse propensity throughout the questionnaire.
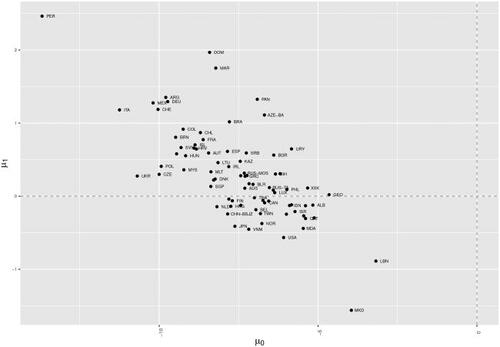
Lastly, countries with relatively lower baseline nonresponse propensity for the average student (i.e., μ0) also showed a steeper increase in item nonresponse as the average student progressed through the questionnaire (i.e., μ1), and vice versa (; see , Appendix B).
Individual differences in item nonresponse trends
The substantial variances in intercept
of the individual nonresponse propensity trends indicated that students strongly differed in how likely they were not to respond to an item at the start of the questionnaire. Across countries, the least intercept heterogeneity was observed in Lebanon, Costa Rica, and Albania (
; ) and the most in Italy, Ukraine, Argentina, and Peru (
). Supporting this, in Lebanon, for instance, the individual students’ trend lines at the start of the questionnaire are more closely clustered around the average trend, while in Peru, they were more dispersed (), indicating that individual students’ nonresponse propensities at the start of the questionnaire were more consistent with the average student’s trend in Lebanon than in Peru.
The substantial variances in slope
of the individual nonresponse propensity trends indicated that there were also large individual differences in how students’ nonresponse propensity developed throughout the questionnaire. More homogeneous trend slopes across students were observed in Albania, Costa Rica, Indonesia, Macao, and Turkey (
), implying relatively more consistency of individual slopes with the slope of the average student, than in countries with more heterogeneous slopes such as the Czech Republic, Peru, and Ukraine (
). The individual students’ item nonresponse trend lines visibly fan out more widely in Peru than in Albania, for instance ().
Variation across students in nonresponse propensity intercept and slope showed an exclusively negative correlation, with a mean correlation of across countries. Students with lower item nonresponse propensity at the start of the questionnaire exhibited a steeper increase in their nonresponse propensity as they progressed through the questionnaire. In comparison, those with higher item nonresponse propensity at the start remained relatively constant in their nonresponse propensity until the end (see also, ).
In countries where the average student’s nonresponse propensity trend showed a positive slope (i.e., nonresponse increased as a function of the sequential item position; e.g., Peru, Dominican Republic, Morocco; ), the majority of individual students exhibited a significant gradual increase in their nonresponse propensities as they progressed through the questionnaire (see , Appendix C). In the remaining countries, most individual students’ trends did not show a significant gradual increase (or decrease) and hence can be considered relatively stable in their item nonresponse propensity throughout.
Figure 3. Between-country differences in slope of the item nonresponse trend for the average student.
Note. The parameter represented is the random-effects slope μ1 in the cross-classified mixed effects models (EquationEquation 1(1)
(1) ). The slope is expressed in logits, and one unit on its corresponding predictor—the sequential item position—counts 50 items. Positive and negative μ1 parameter values correspond to higher and lower odds of item nonresponse as students progress through the questionnaire, respectively. At the grey dashed line, neither outcome (nonresponse or response) is more likely than the other. The pooled estimate
obtained via the multivariate random effects meta-analysis of fixed-effects parameters is presented at the bottom of the graph. The black diamond shape corresponds to the 95% confidence interval around the pooled estimate. The bars around it map the corresponding prediction interval to indicate cross-country dispersion around the pooled estimate.
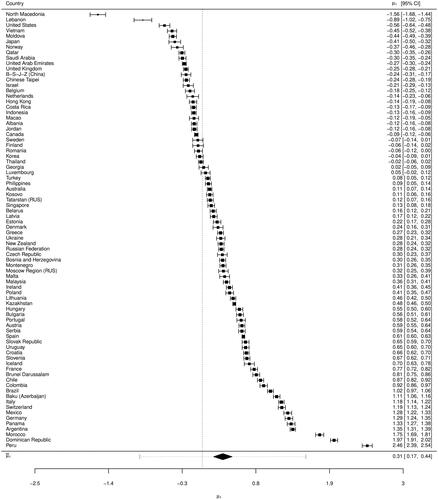
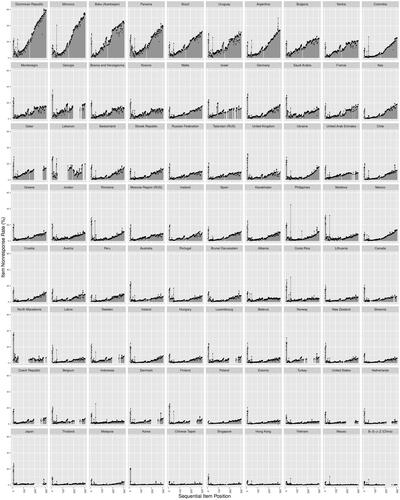
Figure 4. Country-wise average item nonresponse trends across students.
Note. The figure displays the average probabilities of nonresponse for each questionnaire item in each country. The probabilities of nonresponse were predicted based on the cross-classified mixed effects models’ parameters and
(EquationEquation 1
(1)
(1) ) for each individual student-by-item combination within each country. The probabilities were aggregated across students per item within each country. The probabilities are arranged in the sequence as the items appear on the questionnaire. The breaks in the curve represent the items that were free from nonresponse by design (see subsection Measures). The countries are arranged in ascending order of the slope μ1 for the average student ().
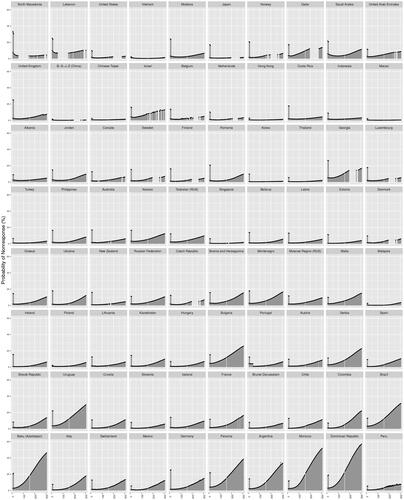
Figure 5. Individual students’ item nonresponse propensity trends.
Note. For each country, the grey lines connect the individual students’ item nonresponse propensities on the first item of the questionnaire (i.e., ) to the item nonresponse propensity on the last item of the questionnaire (i.e.,
). The black lines are the corresponding item nonresponse propensity trends for the country’s average student (i.e.,
).
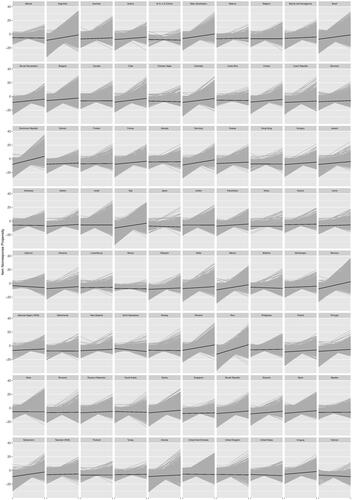
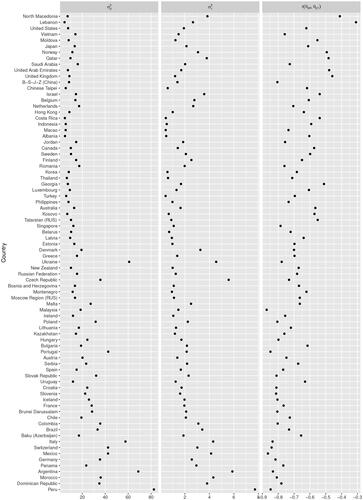
Figure 6. Country-specific variances of and correlations between the student-specific intercepts and slopes of the nonresponse propensity trends.
Note. The variances and
are presented on the logit scale and correspond to the variances of the cross-classified mixed effects models random-effects parameters
and
, respectively (EquationEquation 1
(1)
(1) ). The countries are arranged in ascending order of the slope μ1 for the average student ().
Discussion
The current study aimed to examine the item nonresponse trend throughout the PISA 2018 student questionnaire and the extent to which this trend varied between individuals and across 80 countries. The study findings confirmed our expectations of an increasing trend of item nonresponse toward the end of the questionnaire in most countries, consistent with prior research indicating that respondent fatigue and decreased test-taking motivation might contribute to such patterns (Wise et al., Citation2006, Citation2009), in line with the notion that students may grow more fatigued or disengaged as they navigate the extensive 306-item questionnaire, especially after completing a 2-hour series of high cognitive demand achievement tests.
Although our study did not directly measure test-taking motivation or respondent burden, the findings offer a foundation for future research to investigate these factors more thoroughly. For instance, researchers could explore the fluctuations of test-taking motivation and respondent burden throughout the PISA student questionnaire or across the entire 3-hour testing session and examine how these factors are associated with item nonresponse, as well as other aberrant test-taking behaviors, such as, for example, rapid guessing (see, e.g., Barry & Finney, Citation2016; Lundgren & Eklöf, Citation2023).
The item nonresponse trends in the PISA 2018 student questionnaire also varied considerably between countries. East and Southeast Asian countries, characterized by high power distance and predominantly collectivist cultures, exhibited the lowest item nonresponse rates. In contrast, Western European and North American countries, marked by individualism and lower power distance, demonstrated higher item nonresponse rates, aligning with our theoretical expectations regarding the influence of cultural dimensions on response behavior (Hofstede, Citation2001). However, some countries with primarily collectivist and higher power distance cultures, such as South American countries, the Middle East, and the Balkans, showed the highest item nonresponse rates. This discrepancy may arise from these regions’ inclination toward honor-based collectivism, emphasizing social image and reputation rather than modesty and conformity (Harkness et al., Citation2010).
The heterogeneity in item nonresponse trends across countries implies that nonresponse cannot be solely ascribed to questionnaire design or individual characteristics. The findings highlight the importance of the context in which the questionnaire is administered and its interaction with cultural factors in shaping response behavior. Consequently, a comprehensive understanding of item nonresponse can only be achieved by considering an array of factors, including the cultural dimensions discussed earlier, each country’s unique conditions (e.g., the ethnic diversity of the assessed sample, socioeconomic composition, educational system), and the specific context of the questionnaire (e.g., challenges related to the national questionnaire version and its translation, and questionnaire administration conditions).
The PISA 2018 student questionnaire exhibited considerable variation in item nonresponse trends not only across countries but also among individual students. Notable differences were observed in students’ initial propensity to omit items and the development of their nonresponse propensity throughout the questionnaire. The study results highlight an intriguing relationship between these two elements: students with a lower initial item nonresponse propensity exhibited a more pronounced increase in nonresponse propensity as they progressed through the questionnaire, while those with a higher nonresponse propensity at the start maintained a relatively stable level until the end.
Understanding these individual differences in item nonresponse trends can be crucial for enhancing survey design and administration. The pattern characterized by a consistently elevated nonresponse level from the start of the questionnaire to its end may reflect students who are either unwilling or unable to invest their full effort into completing the questionnaire, possibly due to administration issues. To mitigate this, potential administration challenges could be investigated, and strategies to boost engagement implemented, such as providing a conducive environment for the questionnaire’s completion and emphasizing the questionnaire’s importance. The latter, of course, can vary dramatically across countries. An illustrative example of these differences can be found in Wainer’s recollection of his colleagues’ impressions of one of the international large-scale assessments administration in Korea, “To be so chosen [to participate in the assessment] was perceived as an individual honor, and hence to give less than one’s best effort was unthinkable. Contrast this with the performance we would expect from an American student hauled out of gym class to take a tough test that didn’t count.” (Wainer, Citation1993, p.13).
In contrast, the pattern characterized by an increasing nonresponse rate as the questionnaire progresses may be attributed to decreasing motivation and increasing respondent burden stemming from fatigue. Potential solutions to this issue could include shortening the questionnaire or incorporating breaks. However, it may be crucial to recognize that a certain level of fatigue and waning motivation may be intrinsic to the process of completing lengthy questionnaires, suggesting a relative perspective (Deutskens et al., Citation2004) on the solvability of this issue if the questionnaire design remains unaltered.
Lastly, while our study made a focused effort to thoroughly examine one questionnaire design feature, item position, further studies could expand this investigation by incorporating additional predictors, both design-related and otherwise. Promising avenues for investigation could include exploring factors at the country level (e.g., GDP, cultural dimensions, educational system) and at the student level (e.g., gender, socioeconomic status, language), as well as item-specific aspects (e.g., item format, content; see, e.g., Marcq & Braeken, Citation2023; Rios & Soland, Citation2022). Such an expanded focus could further enhance our understanding of the dynamics influencing item nonresponse, further informing the design and administration of future questionnaires.
Naturally, it is essential to consider the previously reviewed cross-country, country-specific, and individual student item nonresponse trends collectively when examining these findings’ implications for current and future practices in PISA research. The implications can be broadly classified into two categories: challenges for research conducted using available PISA data and potential improvements related to the PISA student questionnaire design and administration.
Implications for researchers working with the PISA questionnaire
The increased item nonresponse rates on scales appearing toward the end of the questionnaire can adversely affect the reliability and validity of inferences drawn from analyses using these response data. On average across countries, the scales of concern (items with probabilities of nonresponse of over 10%) include, among others, those assessing global competence (ST223 ‘Multicultural school climate’) and scales assessing school climate (ST205’ Climate of competition,’ ST206 ‘Climate of cooperation,’ ST038 ‘Experience of being bullied,’ ST207 ‘Attitudes toward bullying’). The domain of global competence, freshly introduced in PISA 2018, is deemed critically important as it assesses students’ preparedness with the necessary knowledge, skills, and attitudes for thriving in an increasingly globalized and interdependent world, fostering intercultural sensitivity and helping students move beyond tolerance to acceptance, respect, and appreciation of diverse peoples, languages, and cultures (OECD, Citation2019a). The domain of school climate, although not new to the PISA questionnaire, is an integral aspect of the PISA assessment that evaluates the quality of the school atmosphere and students’ relationships, both with teachers and their peers (OECD, Citation2019a).
Given the increasing nonresponse rates toward the end of the questionnaire, a finding now supported by evidence but arguably intuitive and foreseeable, it is unfortunate that scales of such high importance according to the PISA framework were placed nearly at the very end of the questionnaire. This placement potentially hinders the psychometric quality of the instrument and compromises the validity of inferences drawn for these constructs. Consequently, researchers using these scales as standalone indicators or predictors of performance must be cognizant of the data limitations imposed by higher nonresponse rates and determine the most appropriate statistical methods to handle the missing data and safeguard the validity and reliability of their findings (see, e.g., approaches such as the use of an extra filter-weight in the context of insufficient effort responding; Ulitzsch et al., Citation2023).
Furthermore, the differences in item nonresponse trends across countries lead to varying proportions of scales potentially affected, ranging from no scales in B-S-J-Z (China) to over 60% of all questionnaire scales affected in countries such as the Dominican Republic and Morocco. Such disparities in item nonresponse have implications for both country-level analyses as well as cross-country comparisons, as the missing data may represent different groups in different countries. Hence, researchers must carefully consider these disparities when conducting cross-country analyses to ensure that the comparisons remain meaningful and that the conclusions drawn from such comparisons are valid.
Implications for the PISA questionnaire design and administration
Our findings emphasize the potential need for modifications to the PISA student questionnaire design and its administration procedures to address higher nonresponse rates on the latter scales. While it is uncertain which changes have been implemented for the latest PISA 2022 cycle, as the technical report and data are not yet available for review, certain options were considered and experimented with in the PISA 2022 pilot. For instance, the PISA 2022 field documentation suggests the potential use of a matrix sampling design, rotating questions within constructs and constructs themselves. Such a design would allow each student to receive questions on all questionnaire constructs but only answer a subset of questions for each construct (OECD, Citation2019b).Footnote2 It remains unclear whether such changes, if implemented, could effectively reduce the questionnaire length or alleviate student burden to a degree necessary to counter high nonresponse rates toward the end of the questionnaire.
If the questionnaire length cannot be sufficiently reduced, a tentative solution could involve randomizing the order of the scales using a booklet design. Although this approach may not directly decrease the total amount of nonresponse, it could help ensure that nonresponse is randomized across scales rather than systematically spiking on the same scales in later questionnaire positions. However, it is essential to consider the potential tradeoffs associated with this strategy. For instance, creating a unique questionnaire version for each student might not necessarily benefit comparability. That is, while randomizing the order of scales could result in a more balanced distribution of nonresponse, it could also introduce challenges in measuring change and maintaining the consistency of the measure across students. Thus, careful evaluation of the benefits and drawbacks of such strategies is necessary to determine the most suitable approach for improving the PISA questionnaire design and administration.
Disclosure statement
We confirm that this work is original and has not been published elsewhere, nor is it currently under consideration for publication elsewhere. Appropriate ethical guidelines were followed in the conduct of the research and we have no conflicts of interest to declare. No funding was received to assist with the preparation of this manuscript. All data analyzed in this study are readily available at https://www.oecd.org/pisa/data/2018database/.
Notes
1 Note that as we are not interested in the population inferences on the person side, but rather on the item side, we do not incorporate PISA sampling weights in our analysis.
2 Within-construct matrix sampling was in fact later implemented in the questionnaire (see PISA 2022 technical documentation for more detail; OECD, Citation2024).
References
- Barry, C. L., & Finney, S. J. (2016). Modeling change in effort across a low-stakes testing session: A latent growth curve modeling approach. Applied Measurement in Education, 29(1), 46–64. https://doi.org/10.1080/08957347.2015.1102914
- Bates, D., Mächler, M., Bolker, B., & Walker, S. (2015). Fitting linear mixed-effects models using lme4. Journal of Statistical Software, 67(1), 1–48. https://doi.org/10.18637/jss.v067.i01
- Bowling, N. A., Gibson, A. M., Houpt, J. W., & Brower, C. K. (2021). Will the questions ever end? Person-level increases in careless responding during questionnaire completion. Organizational Research Methods, 24(4), 718–738. https://doi.org/10.1177/1094428120947794
- Bulut, O., Xiao, J., Rodriguez, M. C., & Gorgun, G. (2020). An empirical investigation of factors contributing to item nonresponse in self-reported bullying instruments. Journal of School Violence, 19(4), 539–552. https://doi.org/10.1080/15388220.2020.1770603
- Burchell, B., & Marsh, C. (1992). The effect of questionnaire length on survey response. Quality and Quantity, 26(3), 233–244. https://doi.org/10.1007/BF00172427
- Cheung, M. W. L. (2015). Meta-analysis: A structural equation modeling approach. Wiley.
- De Boeck, P. (2008). Random item IRT models. Psychometrika, 73(4), 533–559. https://doi.org/10.1007/s11336-008-9092-x
- De Leeuw, E. D., Hox, J., & Huisman, M. (2003). Prevention and treatment of item nonresponse. Journal of Official Statistics, 19(2), 153–176.
- Denscombe, M. (2009). Item non-response rates: A comparison of online and paper questionnaires. International Journal of Social Research Methodology, 12(4), 281–291. https://doi.org/10.1080/13645570802054706
- Deutskens, E., de Ruyter, K., Wetzels, M., & Oosterveld, P. (2004). Response rate and response quality of internet-based surveys: An experimental study. Marketing Letters, 15(1), 21–36. https://doi.org/10.1023/B:MARK.0000021968.86465.00
- Dillman, D. A., Smyth, J. D., & Christian, L. M. (2014). Internet, phone, mail, and mixed-mode surveys: The tailored design method (4th ed.). Wiley.
- Galesic, M., & Bosnjak, M. (2009). Effects of questionnaire length on participation and indicators of response quality in a web survey. Public Opinion Quarterly, 73(2), 349–360. https://doi.org/10.1093/poq/nfp031
- Gelman, A., & Hill, J. (2006). Data analysis using regression and multilevel/hierarchical models (1 ed.). Cambridge University Press.
- Groves, R. M. (Ed.) (2009). Survey methodology. Wiley series in survey methodology (2nd ed.). Wiley.
- Harkness, J. A., Braun, M., Edwards, B., Johnson, T. P., Lyberg, L. E., Mohler, P. P., Pennell, B.-E., & Smith, T. W. (Eds.). (2010). Survey methods in multinational, multiregional, and multicultural contexts. Wiley series in survey methodology. Wiley.
- Heberlein, T. A., & Baumgartner, R. (1978). Factors affecting response rates to mailed questionnaires: A quantitative analysis of the published literature. American Sociological Review, 43(4), 447–462. https://doi.org/10.2307/2094771
- Herzog, A. R., & Bachman, J. G. (1981). Effects of questionnaire length on response quality. Public Opinion Quarterly, 45(4), 549–559. https://doi.org/10.1086/268687
- Hofstede, G. (2001). Cultures consequences: Comparing values, behaviors, institutions and organizations across nations (2nd ed.). SAGE Publications.
- Holtom, B., Baruch, Y., Aguinis, H., & A Ballinger, G. (2022). Survey response rates: Trends and a validity assessment framework. Human Relations, 75(8), 1560–1584. https://doi.org/10.1177/00187267211070769
- Hopfenbeck, T. N., Lenkeit, J., El Masri, Y., Cantrell, K., Ryan, J., & Baird, J.-A. (2018). Lessons learned from PISA: A systematic review of peer-reviewed articles on the Programme for International Student Assessment. Scandinavian Journal of Educational Research, 62(3), 333–353. https://doi.org/10.1080/00313831.2016.1258726
- Kmetty, Z., & Stefkovics, Á. (2022). Assessing the effect of questionnaire design on unit and item-nonresponse: Evidence from an online experiment. International Journal of Social Research Methodology, 25(5), 659–672. https://doi.org/10.1080/13645579.2021.1929714
- Lundgren, E., & Eklöf, H. (2023). Questionnaire-taking motivation: Using response times to assess motivation to optimize on the PISA 2018 student questionnaire. International Journal of Testing, 23(4), 231–256. https://doi.org/10.1080/15305058.2023.2214647
- Marcq, K., & Braeken, J. (2023). Gender differences in item nonresponse in the PISA 2018 student questionnaire. Educational Assessment, Evaluation and Accountability. https://doi.org/10.1007/s11092-023-09412-7
- Mavridis, D., & Salanti, G. (2013). A practical introduction to multivariate meta-analysis. Statistical Methods in Medical Research, 22(2), 133–158. https://doi.org/10.1177/0962280211432219
- Meinck, S., Cortes, D., & Tieck, S. (2017). Evaluating the risk of nonresponse bias in educational large-scale assessments with school nonresponse questionnaires: A theoretical study. Large-Scale Assessments in Education, 5(3), 1–21. https://doi.org/10.1186/s40536-017-0038-6
- Nilsen, T., Stancel-Piątak, T. A., & Gustafsson, J.-E. (Eds.). (2022). International handbook of comparative large-scale studies in education: Perspectives, methods and findings. Springer International Handbooks of Education. Springer.
- OECD. (2019a). PISA 2018 background questionnaires. In PISA 2018 assessment and analytical framework. OECD Publishing.
- OECD. (2019b). PISA 2021 context questionnaire framework (field trial version). OECD Publishing.
- OECD. (2020). PISA 2018 technical report. OECD Publishing.
- OECD. (2024). PISA 2022 technical report. OECD Publishing.
- R Core Team. (2020). R: A language and environment for statistical computing. R Foundation for Statistical Computing.
- Rios, J. A., & Soland, J. (2022). An investigation of item, examinee, and country correlates of rapid guessing in PISA. International Journal of Testing, 22(2), 154–184. https://doi.org/10.1080/15305058.2022.2036161
- Schwarz, N., Oyserman, D., & Peytcheva, E. (2010). Cognition, communication, and culture: Implications for the survey response process. In J. A. Harkness, M. Braun, B. Edwards, T. P. Johnson, L. E. Lyberg, P. P. Mohler, B.-E. Pennell, & T. W. Smith (Eds.), Survey methods in multinational, multiregional, and multicultural contexts (pp. 175–190). Wiley.
- Ulitzsch, E., Shin, H. J., & Lüdtke, O. (2023). Accounting for careless and insufficient effort responding in large-scale survey data—Development, evaluation, and application of a screen-time-based weighting procedure. Behavior Research Methods ,56(2), 804–825. https://doi.org/10.3758/s13428-022-02053-6
- Van den Noortgate, W., De Boeck, P., & Meulders, M. (2003). Cross-classification multilevel logistic models in psychometrics. Journal of Educational and Behavioral Statistics, 28(4), 369–386. https://doi.org/10.3102/10769986028004369
- Van Laar, S., & Braeken, J. (2023). Prevalence of random responders as a function of scale position and questionnaire length in the TIMSS 2015 eighth-grade student questionnaire. International Journal of Testing, 24(1), 24–52. https://doi.org/10.1080/15305058.2023.2263206
- Viechtbauer, W. (2010). Conducting meta-analyses in R with the metafor package. Journal of Statistical Software, 36(3), 1–48. https://doi.org/10.18637/jss.v036.i03
- Wainer, H. (1993). Measurement problems. Journal of Educational Measurement, 30(1), 1–21. https://doi.org/10.1111/j.1745-3984.1993.tb00419.x
- Wise, S. L., Bhola, D. S., & Yang, S.-T. (2006). Taking the time to improve the validity of low-stakes tests: The effort-monitoring CBT. Educational Measurement: Issues and Practice, 25(2), 21–30. https://doi.org/10.1111/j.1745-3992.2006.00054.x
- Wise, S. L., & DeMars, C. E. (2005). Low examinee effort in low-stakes assessment: Problems and potential solutions. Educational Assessment, 10(1), 1–17. https://doi.org/10.1207/s15326977ea1001_1
- Wise, S. L., Pastor, D. A., & Kong, X. J. (2009). Correlates of rapid-guessing behavior in low-stakes testing: Implications for test development and measurement practice. Applied Measurement in Education, 22(2), 185–205. https://doi.org/10.1080/08957340902754650
Appendix A:
Parameter estimates of the cross-classified mixed effects models
Figure A1. Country-wise parameter estimates μ0 of the cross-classified mixed effects models.
Note. The parameter estimates are presented on the logit scale and correspond to the μ0 parameters of the cross-classified mixed effects models (EquationEquation 1(1)
(1) ). Positive and negative μ0 parameter values correspond to higher and lower odds of item nonresponse as students begin the questionnaire, respectively. The pooled estimate obtained via the multivariate random effects meta-analysis (
) is presented at the bottom of the graph. The black diamond shape corresponds to the 95% confidence interval around the pooled average, and the bars around it map the corresponding prediction interval as an indication of dispersion around the pooled average.
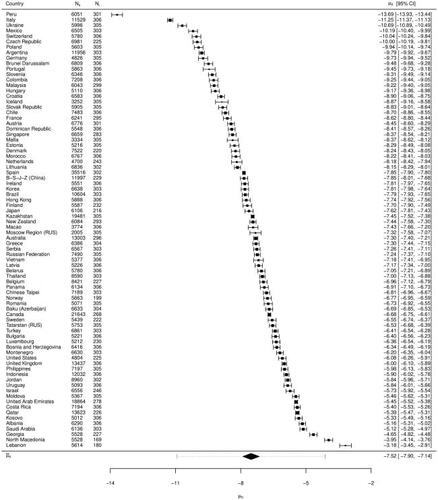
Figure A2. Country-wise parameter estimates β of the cross-classified mixed effects models.
Note. The parameter estimates are presented on the logit scale and correspond to the β parameter estimates of the cross-classified mixed effects models (EquationEquation 1(1)
(1) ). The scales ST006 and ST008 included eight items that inquired about students’ parents’ qualifications (i.e., scale ST006: Does your mother have any of the following qualifications? ST006Q01TA < ISCED level 6>, ST006Q02TA < ISCED level 5A> (theoretically oriented tertiary and post-graduate), ST006Q03TA < ISCED level 5B> (vocational tertiary), ST006Q04TA < ISCED level 4> (non-tertiary post-secondary)). A ‘yes’ or ‘no’ response had to be selected for each item. Positive and negative β parameter values correspond to higher and lower odds of item nonresponse on an average item of the ST006 and ST008 scales, respectively, compared to the odds of item nonresponse on the other items with a similar position on the questionnaire. The pooled estimate obtained via the multivariate random effects meta-analysis (
) is presented at the bottom of the graph. The black diamond shape corresponds to the 95% confidence interval around the pooled average, and the bars around it map the corresponding prediction interval as an indication of dispersion around the pooled average.
Appendix B:
Association between the average student’s intercept and the sequential item position slope
Figure B1. Association between the average student’s intercept μ0 and the sequential item position slope μ1.
Note. The figure shows the association between two sets of parameters across 80 countries, μ0 (i.e., the average student’s baseline nonresponse propensity) and μ1 (i.e., the average student’s item nonresponse propensity as a function of sequential item position; EquationEquation 1(1)
(1) ).
Appendix C:
Students with significantly positive and negative individual sequential item position slopes
Figure C1. Percentages of students with significantly positive and negative individual sequential item position slopes.
Note. Percentages are calculated as proportions of the total countries’ students’ samples that were identified by one-tailed Wald tests as having significantly positive, stable, and significantly negative individual sequential position slopes, , and
, respectively. The countries are arranged in descending order of the percentage of students with a significantly positive sequential position slope (
).