
Abstract
The opening of data has been credited for improving transparency and for providing a window on government functioning. Although this relationship is intuitively apparent, it is in fact complex and the mere opening of data might not actually yield transparency. In this paper, a comprehensive model of determinants that enable or impede transparency enabled by open government data and the expected effects have been derived by surveying public administration and information systems literature. Public administration literature tends to be focused on factors such as participation and trust, whereas information systems literature focuses on factors such as user interface, user experience, and data quality. Digital government literature attempts to bridge these elements. The Window Theory is introduced, in order to unify existing models by integrating a broad range of factors within a single model. The Window Theory can be used to develop context-dependent models that are both comprehensive and parsimonious.
Introduction
Creating transparency is a main driver for the opening of government data (Bertot, Jaeger, & Grimes, Citation2010; McDermott, Citation2010p. 45) and is expected to result into benefits like better government decisions (Puron-Cid, Gil-Garcia, & Luna-Reyes, Citation2012) and accountability (Helbig, Styrin, Canestraro, & Pardo, Citation2010). Expectations of the benefits of transparency by of open government data are high (see for example European Commission, Citation2010) and may even be exorbitantly high (Bannister & Connolly, Citation2011).
Transparency is about creating an insight for someone who is not involved. There is an information asymmetry between the government and the public, as those who are involved in government processes will generally possess more information about their activities than the public (Ahn et al., Citation2018; Yoon, Zo, & Ciganek, Citation2011). Transparency is aimed at overcoming this discrepancy in information, thus enabling the public to view what is happening within the government. This is often viewed in the context of the principle-agent theory (Eisenhardt, Citation1989). In the digital government, transparency portals have created a window to view government functioning, aimed at overcoming the information asymmetry between the government and the public.
Although transparency might be intuitively an appealing concept, people are likely to give different meanings to the concept, with ambiguity as a result. In some cases, the mere opening of data are viewed as a form of transparency, whereas others suggest that there is only transparency if the public is able to understand and interpret the data (Zyl, Citation2014). Furthermore, transparency is subjective. What is transparent to one person, might not be transparent to another. For example, one person might possess statistical knowledge and be able to interpret the data, whereas another person might lack the required knowledge. Transparency is sometimes even perceived as a “magical concept for everything” (Ward, Citation2014, p. 45). Despite the ambiguity surrounding this concept, there is an agreement that transparency is a crucial factor for creating an open government and that government data should be opened for this purpose (Zuiderwijk, Gascó, Parycek, & Janssen, Citation2014). However, simply disclosing more information can actually result in less understanding, more confusion and less trust (Bannister & Connolly, Citation2011) and might not necessarily result in transparency. Therefore, it is important to understand the elements that influence transparency.
OGD initiatives are often focused on creating transparency (Bertot et al., Citation2010; McDermott, Citation2010), however, there is no overview of enabling or impeding factors. Understanding these factors is of paramount importance to advice efforts to create transparency enabled by OGD. Furthermore, there are many factors influencing OGD-enabled transparency. They range from the technical aspects of data such as metadata (Strathern, Citation2000) and system characteristics such as usability (Bertot, Gorham, Jaeger, Sarin, & Choi, Citation2014) to organizational factors such as internal resistance to transparency (Navarro-Galera, Alcaraz-Quiles, & Ortiz-Rodríguez, Citation2016). Although there are many models for transparency in general, there exists no model for OGD-enabled transparency. Researchers focus on different aspects of transparency and there is no overall overview of determinants influencing transparency.
Also, there is a variety of effects of transparency that ranged from accountability (Gandía, Marrahí, & Huguet, Citation2016) to trust and credibility (Michener, Citation2015). This diversity of factors suggest that transparency is multi-faceted. The effects of transparency enabled by OGD are not known. The multi-faceted nature of transparency poses difficulties for measurement, theory-building, and testing (Hollyer, Rosendorff, & Vreeland, Citation2014).
Our research questions are 1) what are determinants influencing OGD-enabled transparency and 2) what are possible effects of OGD-enabled transparency? By answering these questions, this paper aims to develop a comprehensive model of the determinants that enable or impede transparency and to understand the possible effects of transparency in the field of Open Government Data (OGD). The resulting model is labeled the Window Theory. These determinants can help policy-makers and designers of OGD efforts to truly create transparency. Researchers can use this model to select factors that are relevant to them. This paper is structured as follows. In the next section, the structured literature review (SLR) approach is presented, followed by an overview of determinants and effects of transparency. In Section “The window theory”, the determinants and effects found are used to create the model of the Window Theory. The findings and further research are discussed in Section “Discussion and further research". Finally, our conclusions are drawn.
Research method
Our goal is to advance our understanding of transparency in the field of OGD. We opted for conducting a literature review, as there is a large body of work available in the field of transparency. SLR is a “method of making sense of large bodies of information” (Petticrew & Roberts, Citation2006, p. 2).
Literature review method
The literature review method was based on the Petticrew and Roberts (Citation2006) approach to the literature review, which was extended using the Hsieh and Shannon (Citation2005) approach to content analysis. The latter was used to identify the determinants of transparency and the expected effects. We adopted an instrumental view in which transparency is positioned between determinants and effects. The initial model, that positions transparency in the center, is shown schematically in . Determinants are variables that enable or impede transparency, whereas expected effects refer to variables showing the intended and unintended consequences of transparency.
Figure 1. Basic model of transparency.
The literature surveyed included the top 25 journals with an average impact factor higher than 1,0 in the fields of Public Administration (PA) and Information Systems (IS), based on the 2016 Scientific Journal Rank (SJR - Scimago/Scopus). The keywords used for searching were kept broad by including “transparency” and “government” to avoid missing any relevant papers. The terms were only searched in the fields: title, abstract, and keywords. The SLR was conducted in April 2017. Papers published in 2017 were excluded, to avoid any confusion about which subset of papers from 2017 should be included. Searching on “transparency” and “government” returned a large number of papers, as transparency and government are also commonly used words outside the OGD field. For example, chemistry and environmental science use these words within a different context, such as the transparency of glass or water. Some journals did not have a search function and in these cases, the search was performed manually by accessing each paper and searching for the keywords using the search feature for an article. The results show that there is a lot of work available in the financial domain. Budget transparency is based on the use of well-defined measures and financial reports and is guided by regulations (e.g. Mauro, Cinquini & Grossi, Citation2018). Articles that focused on budget transparency were excluded, as these do not represent the typical challenges faced by OGD (Conradie & Choenni, Citation2014; Harrison et al., Citation2012; Janssen, Charalabidis, & Zuiderwijk, Citation2012). This resulted in an initial selection of 173 papers. The number of papers was further reduced to 73 papers by only including papers published between 2007 and 2017. This enabled us to focus on the papers relevant to the OGD domain.
Content analysis method
After identifying the papers content analysis was used for data analysis. Content analysis can be defined as a “research method for the subjective interpretation of the content of text data through the systematic classification process of coding and identifying themes or patterns” (Hsieh & Shannon, Citation2005, p. 1278). Content analysis classifies large amounts of text into a number of categories. In each paper, determinants and effects were identified by reading the entire paper and marking each determinant and each effect. The analysis was confronted with heterogeneity in research approaches and context and limited research employing quantitative research methods. Not only different constructs and measurements were used, but also the quality of empirical publications were found to be different and the selection of measurements was found to be context-dependent. This confirmed our starting point that transparency is context-dependent and there is a need to identify determinants influencing OGD-enabled transparency and its possible effect.
As most of the papers are not addressing the OGD field, the determinants and effects needed to be decontextualized from the context in which the study was performed to the OGD field. The content analysis was conducted by both authors and the results were discussed. Initially, all determinants and effects were marked, in order to keep the list broad. This resulted in a long list of factors in which synonyms were found to be used in different papers to depict to the same determinant or effect. It was often impossible to determine whether the authors of one paper used similar definitions of a determinant or effect to other authors. Many papers lack clear definitions and conceptualization and this complicated our SLR. In such situations, it was assumed that they would use the same definitions. On several occasions, the same wording was used in reference to slightly different situations. For example, primary data can refer to raw data that has not yet been processed, but also to data collected from the source and made ready for use. Instead of trying to define each element, we would label them both as primary data. In further research, we suggest that the determinants and effects should be defined in detail.
In many situations where the literature suggested a causal or correlated relationship, the explanatory mechanisms were poorly described or could be challenged. For example, often it is stated that access should be given to raw data. Although publishing raw data enables finding new insights and avoids predefining view, it might not per se result in transparency, as raw data might not easy to understand and use for most people. As such, the mechanisms for creating transparency might not work in all circumstances. In further research, we suggest that empirical research should be conducted to explain the relationship between determinants, transparency, and effects, and to conduct experiments to investigate the causality of relationships.
Model construction
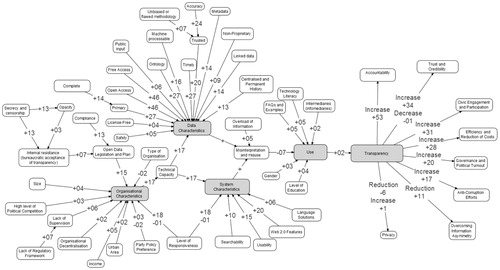
Hsieh and Shannon suggest to keep the number of categories limited to ensure that they are more easy to understand. This can be done by merging similar codes. The researchers merged the codes independently and then discussed them while comparing them to existing models in the literature. After studying the models, the content analysis resulted in 4 clusters of determinants and 1 cluster of expected effects of transparency. Hsieh and Shannon (Citation2005) recommend to create relationships between categories and subcategories based on their concurrence, influence, and consequences. Determinants and effects were cataloged accordingly, including whether a determinant had a positive or negative relationship with transparency. Factors having similar semantics were clustered. After reading the papers, a total of 42 determinants and 8 expected effects were found. Hsieh and Shannon suggest to create a diagram showing the relationships between the clusters and factors. A tree diagram was created using the software Visual Understanding Environment (http://vue.tufts.edu/). This diagram is presented in and was named “The Window Theory”, reflecting the determinants of transparency and their possible effects. The Window Theory is not a tested theory, but merely a comprehensive overview of relationships suggested by the papers that were surveyed.
Figure 2. The window theory: determinants and expected effects of transparency enabled by OGD.
Our SLR depends on previously published research and the availability of these studies. The selection/exclusion criteria limit the number of surveyed papers in order to make the number of papers manageable. Some papers that might have been relevant were missed because they were not published in the outlets surveyed. We excluded literature concerning budgetary data as this is well-structured and well-defined, whereas this is not the situation for most OGD. The authors had to interpret the work of others and to derive what they found to be relevant. Although there is a lot of work available about transparency, there is no uniformity in the measurement and use of constructs. Furthermore, many studies did not provide definitions, or simply mentioned that determinants of effects were relevant. The studies surveyed are diverse and contain different interpretations of determinants and effects. The authors had to interpret the studies and make decisions on how to aggregate them. Sometimes there were discussions about whether determinants should be merged into one or be kept separate. We made this decision based on the relevance of OGD, which might not apply in other situations. In addition, the relevance and significance of factors could not be aggregated. The studies employ different constructs and are conducted in different contexts, which made it impossible to deduce insight into the magnitude of factors. The Window Theory aggregates determinants and effects into a single mode but does not take the contextual factors into account. Some factors might only be relevant to a certain situation.
Findings
A content analysis was conducted on 73 papers to identify the determinants and effects of transparency. Of these 73 papers, 41 (56% of all 73 papers) used a quantitative research method. Only 16 papers include an explicit model associating determinants with transparency and its effects. None of these models contain more than 16 determinants and 3 effects. This confirms our original premise of the need for a unified model. The analyses of papers revealed 4 stages of OGD for transparency development which will be presented next. This will be followed by a presentation of the determinants and effects of transparency.
The evolution of OGD-driven transparency
shows the number of identified papers per year. The survey of the literature shows a steady increase in the number of publications. Most manuscripts were published in public administration (PA) literature (49 papers) accounting for 67% of the total papers, whereas 33% of papers were published in the field of information systems (IS) (24 papers). Digital government papers can be found in both the PA and IS domains, although journals such as Government Information Quarterly are classified in the IS domain.
Figure 3. Frequency of publications per year and area.
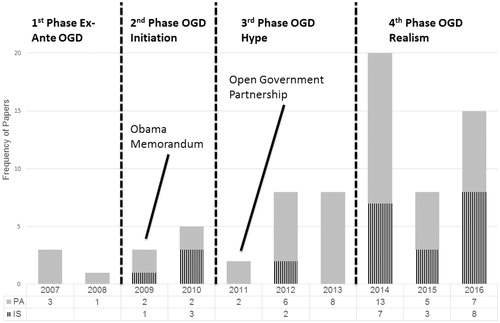
From the SLR and content analysis, four phases of transparency research in OGD were identified by looking at the discontinuity. Discontinuity signifies some form of observable change driven by an event, whereas continuity implies maintaining the status quo. Discontinuity helps to find the boundaries for groups of things that are alike (Cook, Citation1996). The events resulting in discontinuity are derived from the content analysis of the papers and its influence becomes only visible after a while. The first discontinuity is the initiation of Obama’s memorandum of understanding in 2009, resulting in the rise of literature from mainly Western countries. There are many papers referring to this memorandum of understanding published in the subsequent years. The second discontinuity is driven by the creation of Open Government Partnership in 2011. The final discontinuity is less visible as an event, but clearer from the number of papers published. There is an increase in the number of papers in this field which are focused on viewing possible benefits from OGD from a realistic perspective. This phase is less explicit in the literature. The phase is found by papers showing the impediments and disadvantages, whereas the simply stating of advantages still continues.
1. Ex-ante phase (before 2009)
2. Initiation phase (2009-2011)
3. Hype phase (2011- 2013)
4. Realism phase (2014-now)
In the first phase, ex-ante open government data, transparency was given regular attention by researchers. OGD and transparency had no momentum and had gained only limited political attention. Many countries had Freedom of Information Acts (FOIAs) in place, through which citizens could request information (Petticrew & Roberts, Citation2006). FOIAs allow the public to ask for (partial) disclosure of unreleased information.
The second phase, OGD initiation, is hallmarked by Obama’s Memorandum on ‘Transparency and Open Government’ published in 2009. Before the Memorandum there was limited attention for OGD, even though transparency has always been an important topic for researchers in the field of government and public administration. The Memorandum encouraged active disclosure of public data. This Memorandum resulted in the development of the OGD portals (www.opendata.gov) which offered open data to the public.
This is followed by the OGD hype phase characterized by an unbridled enthusiasm that resulted in many followers. Many local and central governments initiated open data portals to publish their data. In 2011, several countries around the world joined the Open Government Partnership (OGP) to create Open Data Plans and to increase the proactive disclosure of public data (Petticrew & Roberts, Citation2006). In 2013, the G8 Charter also declared its objective of opening up high-value data from the government (Hsieh & Shannon, Citation2005, p. 1279). This reflected a change from waiting for a specific request for papers or electronic forms (FOIA) to the pro-active opening of data resulting in massive amounts of data sets in a friendly format (open data, linked data) with free and open access, with the intention of contributing to transparency.
In the fourth phase, named realism, a more feasible ambition has been set and research is initiated to advance OGD efforts in creating transparency. After the initial excitement, scholars identified that data disclosure per se would not lead to proper levels of transparency, accountability, anti-corruption, and the other expected effects. The fourth phase was driven by improving practices and the need for research to deal with limited use. The massive disclosure of data raised the question of whether the opened data had fulfilled the expected promises, for example, and whether transparency enhanced trust, accountability transparency and engagement (Obama, Citation2009). The number of papers increased substantially, including papers with a technical perspective from IS. At the same time, the term “big data” started to emerge, aimed at using data for the purpose of value creation (Piotrowski & Van Ryzin, Citation2007).
This research broadened the research in transparency across the board from technical to societal issues. The more technical papers demanded data in standardized, electronic formats using web services following Tim Berners-Lee’s 5 Star model (Obama, Citation2009). At the same time, the indiscriminate opening of data resulted in privacy concerns Coglianese (Citation2009) and concerns about the proper use of data (Harrison, Pardo, & Cook, Citation2012). This more technical focus resulted in new concepts such as “transparency-by-design”, in which the opening of data is integrated within the design of information systems (Janssen et al., Citation2017).
Determinants of transparency
The content analysis revealed many and diverse determinants of transparency for OGD. For each of the determinants, it was described whether the factor enabled or impeded transparency and the explanatory mechanism as shown in . The first column of shows the total number of studies in which the determinants were found. The second column gives this number for only the quantitative studies. This is followed by the determinant name, the description of the determinant, the description of the effect(s). The final two columns contain the references to the studies reviewed.
Table 1. Types of possible effects of transparency.
shows the determinants and the number of papers mentioning the determinants. From this figure, it becomes clear that some factors are only mentioned a few times, such as urban areas and types of organization, while open and free access were mentioned most frequently. Some factors are viewed as conditions for creating transparency, whereas others are enablers or inhibitors of transparency. For example, a condition for transparency is completeness, as missing information results in less transparency. Metadata is a typical enabler for the creation of transparency, whereas lack of usability inhibits transparency. Making a distinction between quantitative and qualitative studies enabled us to compare whether different determinants were found in both kinds of studies. Only “technology Literacy” was found in 2 qualitative studies, but not in any of the quantitative study, whereas all the other determinants were found at least one time. Although there are some variations in the number occurrences, the differences between quantitative and qualitative studies are limited.
Figure 4. Frequency of determinants per area.
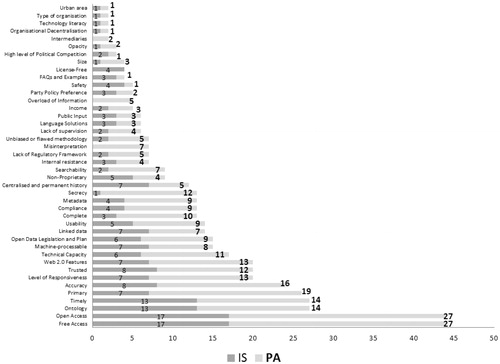
The variety and diversity of determinants also show the complexity of creating. It is both challenging and costly to satisfy all factors, and may even be unnecessary (Roberts, Citation2002).
The question remains: which of these factors are conditions that have to be satisfied, which are most influential and which are nice to have. The SLR does not shed a lot of light on this, as there is no consensus in the literature. Different authors suggest that different factors are of importance.
Determinants were found to have different influences on the desired effect. For example, for anti-corruption and fraud, 35 determinants out of 42 were found to have an effect. In contrast, only 27 determinants were found to be related to accountability (see ). The SLR shows that creating transparency in order to reduce fraud is influenced by other determinants than creating transparency for accountability. This suggests that the form of transparency needed is dependent on the intended effects of transparency.
Expected effects of transparency
Transparency can offer many benefits, but also some unintended or even adverse effects, as listed in . In the literature, positive effects are emphasized, while negative effects have been given less attention. Examples of negative effects include violation of privacy due to the release of data containing privacy-sensitive information (Harrison et al., Citation2012), or the fact that the release of large amounts of OGD can result in information overload and errors (Grimmelikhuijsen, Citation2012). The achievement of either negative or positive effects is highly dependent on how information is released and shared as – Types of Possible Effects of Transparency shows.
Figure 5. Overview of expected effects and areas.
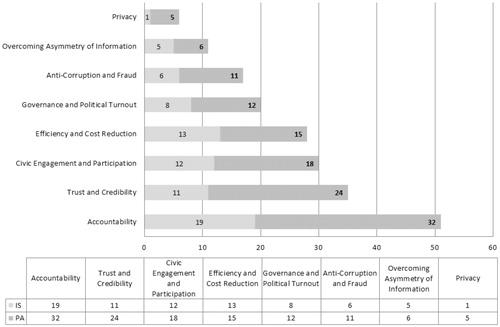
Table 2. List of determinants of OGD-enabled transparency.
Additionally, discussions can be found in the literature about what happens when inaccurate data are shared, and the issue of who is accountable for decisions based on inaccurate data (French, Citation2011). Finally, some work mentions both the positive and negative effects of transparency. Appendix A – The overall classification of the papers summarizes the descriptions and the types of effects identified in the SLR of transparency.
The most mentioned effects of transparency are headed by accountability (51 papers), followed by trust and credibility (35 papers), civic engagement and participation (30 papers), efficiency and reduction of costs (28 papers), governance and political turnout (20 papers), anti-corruption efforts (17 papers), error and asymmetry of information (11 papers) and privacy (6 papers). The papers often mention more than one expected effect. As an example, Janssen, Matheus, and Zuiderwijk (Citation2015) found that transparency can increase accountability and can help anti-corruption efforts. That an effect is mentioned does not mean that the effect is also achieved. There is still discussion about whether transparency results in accountability (Park & Gil-Garcia, Citation2017).
Most of the literature is focused on the positive effects of transparency. The number of papers mentioning negative effects is low: we found that only 16% of the papers (12 out of 73) mentioned negative effects. The average of expected effects is in the surveyed PA literature 62% higher than in IS. In PA there is a wider discussion of the effects of transparency, whereas in IS literature transparency is often viewed as the outcome (dependent variable). Not surprisingly, discussions in IS are more focused on technical solutions and the determinants of transparency.
The window theory
The disclosure of OGD should result in transparency by creating a window on governmental functioning. Our aim is to develop a comprehensive model of possible determinants that enable or impede transparency for OGD and the efficacy of transparency. Hence, the Window Theory is not a tested theory, but a comprehensive account of the determinants and effects of transparency. We label it as a theory as it is a supposition of factors aimed at explaining how transparency can be created and what its effects are. The SLR provides a long list of factors but gives little insight into which factors are conditions, which would be good to include, which are nice to have and which have hardly any influence. Nor does literature give insight into the significance of factors or whether they are antecedents or moderators. Therefore, we opted for creating a comprehensive model that contains all determinants deemed to be relevant, as shown in . The model shows the relationship between 42 determinants and 8 possible effects and unifies various views on transparency within a single model. Some relationships are likely to be strong, whereas others will be weak. The determinants are grouped into 4 clusters and the effects into 1 cluster based on the content analysis.
The resulting model is named “The Window Theory” as OGD should provide a window to see what has happened or what is happening within the government. The frame of the window determines if it can be used. This is expressed by the “organizational characteristics” and “system quality” cluster. In the window, the “data quality” cluster determines if the data becomes transparent. Governments are creating the window to the outside world by disclosing OGD in portals. The determinants show that simply disclosing OGD is not sufficient and that a large number of determinants need to be addressed. Addressing the determinants can governments to arrive at OGD portals that really create transparency.
As a metaphor: a window is very effective during the day, but at night, nothing can be viewed without artificial light. The model shows that the night will remain dark unless users are guided towards the data. The same data that create a greater level of transparency for the expert, offer less transparency for someone with different conditions of access and a lack of knowledge about how to use the data. This aspect is addressed by the “individual characteristics” cluster.
The many determinants and its relationship suggest that transparency should be viewed as a complex, continuous construct rather than a dichotomous construct. Transparency is hard to express on a single scale ranging from zero to full transparency. Furthermore, the two extremes (zero or full transparency) are less likely to occur as there will always be some degree of transparency.
There are four main clusters of determinants identified, as shown in . In the figure in parentheses is the total count of the individual times that the groups of factors are mentioned.
1. Data quality (315): The aspects determining the quality of the OGD published
2. System Quality (56): Characteristics of systems that are used for publishing data
3. Organizational characteristics (135): Variety of organizations that publish the OGD
4. Individual characteristics (21): Variety of users of the OGD
Data quality determinants were found most frequently. In almost all the IS papers data quality is mentioned. One of the explanations for this is that data quality plays a major role in the Delone and McLean (Citation2003) success model for information systems, one of the most cited papers in the IS field. This model also includes system quality dimensions, but this is less evident in the literature surveyed. In most IS literature system quality is not viewed as being directly connected to transparency, and in the first three phases (), system quality factors are rarely mentioned in the literature. Only recent literature, mostly after 2014, acknowledges that system quality also influences transparency. The simple release of data was not found to be sufficient, and characteristics such as usability, performance (for real-time data provision) and comparability are found to be important for creating transparency (Bertot et al., Citation2014; Janssen & Kuk, Citation2015; Muñoz-Soro, Esteban, Corcho, & Serón, Citation2016).
Both organizational and individual characteristics play a role, according to the literature. Organizational characteristics are diverse and range from leadership to geographic (urban) area. Some organizations are better prepared and are better equipped to create transparency, while others lack these capabilities (Barry & Bannister, Citation2014; Guillamón, Ríos, Gesuele, & Metallo, Citation2016; Ølnes, Citation2016). Political orientation also plays a role, as some political movements favor disclosure and transparency, whereas others do not (Gandía et al., Citation2016; Reynaers & Grimmelikhuijsen, Citation2015).
Users can be diverse, possessing varying individual characteristics, as depicted in . Users can be citizens (Bertot et al., Citation2010), company employees (David‐Barrett & Okamura, Citation2016), public servants from other organizations (Angst, Agarwal, Gao, Khuntia, & McCullough, Citation2014), persons working in public-private organizations delivering public services (Reynaers & Grimmelikhuijsen, Citation2015), and employees of supra-national organizations (Cross, Citation2014). User characteristics such as technology literacy (Owen, Cooke, & Matthews, Citation2013), level of education (Grimmelikhuijsen & Meijer, Citation2014), and gender (Bauhr & Grimes, Citation2014) influence the ability to make use of data. Some users only read news from intermediaries such as journalists, who themselves used OGD and FOI (Piotrowski & Van Ryzin, Citation2007), or use applications providing a predefined view on the data.
The Window Theory contains a long list of factors, but not all factors are always relevant for every situation at hand. Our analyses suggest that the determinants are dependent on the desired effects of transparency and the context. Dependent on what the aim of transparency is, other factors were deemed to be found relevant in the literature. Metaphorically speaking, different windows are needed for different purposes. This implies that for a given situation the Window theory can be used as the basis, but determinants and factors need to be selected to make them context-specific. This can also explain the many different models and lack of uniformity in the literature review. Dependent on the context, user group and objective different aspects are of importance.
Discussion and further research
The Window Theory is based on the idea that OGD creates a window through which to observe government, and thus to overcome information asymmetry. There are two parties, those who look through the window and those who determine what is showcased in the window. OGD is showcased by governments. What is showcased reflects the intentions of the publisher, but might not fit the needs and desires of what the public wants to see. Glass is often set in a window to protect against weather conditions, but blurs the view. If not properly done there can be dust on the window. The physical characteristics of glass let it transmit, reflect and refract light. In a similar vein, many transparency efforts only reveal a part of the full picture, reflecting what you want to see and not necessarily resulting in transparency. The quality of glass can be enhanced by cutting and polishing. Policy-makers and designers can use a comprehensive model to enhance transparency by addressing the determinants.
Transparency is a multidimensional concept (Furtado et al., Citation2010), which makes it both hard to define and to create. Opening too much data without proper guiding mechanisms can only result in blurring the window and actually preventing the viewer from seeing what is happening inside the government. This is labeled as “disclosure overload” in compliance and regulation literature (Hoitash & Hoitash, Citation2017). In this field, regulators ask for more and more information and reporting, which in turn is hardly used by the agencies in charge of the supervision. The volume of disclosure is not helpful in creating transparency and might even have the opposite effect. Removing the blur and presenting the public with easily understandable information presented in a manageable form requires significant investment. The level of transparency is influenced by the type of window (data, quality) but also by who is looking (stakeholders), from where (context, position in charge), when (time) and how people look through the same window (objective use of data). Research is needed on how to lower the threshold of public involvement and to avoid disclosure overload.
The most comprehensive model addressing transparency that we identified using SLR defined 16 determinants and a maximum of 3 effects. Our model is focused on transparency enabled by OGD and is the most comprehensive, as the Window Theory lists 42 determinants and 8 expected effects. The disadvantages of our model are related to the many factors involved. Furthermore, the relative importance of each factor is unclear. The number of works on the subject of data quality and transparency was found to be high (+315), however research is not evenly distributed across all factors. For example, most quantitative transparency models do not take the technical aspects into account, whereas case-based research shows that these can be highly relevant. In addition the relative importance found in one domain might not hold in the OGD domain. We recommend conducting empirical research into the relative importance of factors.
The findings show that the information systems literature focuses more on determinants such as information quality and system quality dimensions, whereas public administration research focuses more on aspects such as trust and accountability. Give the focus of the domains this comes not as a surprise. However, these fields seem to be converging, a development that is expressed in current work that attempts to bridge the gap between them (Bertot et al., Citation2014; Janssen & Kuk, Citation2015; Muñoz-Soro et al., Citation2016). The work combining elements from the public administration and information systems field might be best characterized as the “digital government” domain. It is likely that these domains will learn from each other and will start to influence each other. More research is needed in order to understand the influence and relevance of the factors involved, in particular whether a determinant is a condition, a facilitator or an inhibitor of transparency. The SLR shows that the importance of determinants is dependent on the intended effect. Also, the significance of factors might be dependent on the type of OGD and the policy and institutional context. We excluded literature concerning budgetary data as this is well-structured and well-defined and guided by regulations, whereas this is not the case for most OGD. A comparison between OGD and budgetary data can be made in further research. We recommend using the Window Theory in future research as a starting point for identifying most influential factors and developing a parsimonious model. Also, we recommend the development of contextual models that provide insight into the deeper structure and meaning of determinants and effects.
The complexity and the quantity of determinants challenge the assertion that the opening of data will result in transparency. The simple opening of data is unlikely to result in transparency per se. There is no single recipe for creating transparency. Some determinants might have a larger influence than others and some might be conditions for creating transparency, but the literature does not provide a clear view on this. Our review suggests that transparency is context-dependent and that the creation of transparency depends on what information is supplied, how it is provided and on its users, who need to have the knowledge and the capabilities to understand the open data. Alongside the data, details of the context have to be shared in order to allow the public the opportunity to interpret the data.
One of the main ideas behind OGD is to create transparency for the general public. The determinants show that this might be more complicated than initially expected. Individual characteristics hinder the use of OGD to create transparency. Hence, the creation of mass-transparency is not easy to accomplish. The requisite individual characteristics are only found in a relatively small group, and consequently, transparency is only created for the happy few. By taking the comprehensive list of determinants into account, the Window Theory can be used to facilitate a much broader audience.
Budget transparency was left out in our SLR, as this is a well-defined domain with a long track record in the standardization of financial reporting. It is likely that a subset of determinants and effects are relevant to budget transparency. Further research can evaluate whether all factors for budget transparency can be found in the Window Theory and whether a specific subset can be derived for this domain.
The Window Theory started with transparency and investigated both determinants and effects. Use is a central construct influencing transparency. Without the use of OGD, there can be no creation of transparency. Use is a complicated construct and often requires participation and interaction amongst people. Citizen’s engagement and participation were also found to result from transparency (Harrison & Sayogo, Citation2014). Although both elements are related to engagement and participation, engagement and interaction are needed as determinants to make sense of the OGD. Once OGD is understood and transparency is created this can result in engagement and participation in order to influence policy-making and political decisions. As such, these two elements should be separated and not combined. Making sense of OGD by interaction and using analytical capabilities is an area of limited research. We only found a few studies that referred to this aspect, whereas it might be the most important element in creating transparency once OGD is published in a suitable format.
Transparency covers a broad range of concepts and elements. In the SLR we encountered the fact that in the literature different names are used to express similar determinants and effects, although there are sometimes slightly different interpretations. This complicated the aggregating of the determinants and effects and the comparison. For example, completeness and incompleteness refer to a variable showing various degrees of completeness, ranging from zero data to complete data. Another example of using different names for what could be similar concepts is the use of the words “trust” and “reliability” of data. Both can refer to data that are defined clearly enough to arrive at similar results, but reliability can refer to being continuously available and trust can refer to whether the data provider can be trusted. Trust is often viewed as being broader than reliability, with reliability as one of its properties. The use of the terms seem to be dependent on the community: PA prefers to use trust, while IS typically prefers to use the term reliability. A limitation of our work is that we merged some of the concepts into one to keep the number of determinants manageable. Although the determinants provide a solid starting point, their descriptions in should be refined in further research.
The literature suggests that full transparency is hard to achieve, but is also unnecessary (Roberts, Citation2002). Given the many factors involved, it seems to be better to discuss the level of transparency. However, the question remains of how much transparency is sufficient, and this might be dependent on the situation at hand and the users. We do not need to scrutinize public servants at all times during their work, and the privacy of public servants should be respected. A level of trust is necessary, that the public servant is able to do his job properly and the prevailing culture should ensure that public services are executed in a professional way.
Politicians want to create transparency using OGD, whereas public servants still need to realize this. The Window Theory shows that there is a large discrepancy between the intuitive notion and the actual realization. Many open data portals release OGD, but this does not always create transparency, as determinants of transparency have not been considered or not been handled in a suitable way. It is too simple to assert that transparency is automatically created by realizing OGD. We suggest to use the determinants as a form of checklist to evaluate transparency initiatives and to use this evaluation to broaden the view on creating transparency. Also, the impact of creating transparency can be more diverse, as the effects show.
Conclusion
The creation of transparency using OGD has become one of the key areas in digital government research. The literature review showed an increase in papers related to open data and transparency over time, but also fragmentation, as authors look at different determinants and effects of transparency. There was no comprehensive overview, which makes it hard to determine which factors should be deemed to be important. Many studies only take a few actors into account.
We unraveled the concept of transparency for OGD by finding 42 determinants influencing transparency and 8 types of expected effects. The determinants were clustered in four groups of factors, data quality, system quality, organizational characteristics, and individual characteristics.
The Window Theory is an unifying model containing these determinants and effects of transparency. By creating an overview, the Window Theory unifies the various work in this area originating from public administration and information system publications. The nature and objectives of transparency are likely to differ per situation and the model can be used to select the determinants that are appropriate to a given context. Factors might be more or less important dependent on the situation.
Our SLR depends on previously published research and the availability of these studies, which limits its outcome. We had to interpret the descriptions in the literature which were often ill-defined and ambiguous and sometimes suggested relationships while lacking a clear description of the explanatory mechanisms. We were not able to discriminate between antecedents and moderators. Empirical research is needed to develop explanations of the relationship between the determinants of and effects of transparency. In further research, a distinction between factors as a condition, facilitator or inhibitor of transparency should be made. The determinants with the highest explanative power can be selected to develop a parsimonious model. Furthermore, we recommend further research to focus more on what data is needed and in what form, and on the interpretation and sense-making of data.
Additional information
Funding
Notes on contributors
Ricardo Matheus
Ricardo Matheus is a researcher in the field of Open government Data and infrastructures at the Information and Communication Technology research group of the Technology, Policy and Management Faculty of Delft University of Technology (The Netherlands). He was a lecturer at Rotterdam School of Management of Erasmus Rotterdam University (The Netherlands) teaching Data Science and Programming for Managers courses. He leads WPs in the CAP4CITY Project (www.cap4city.eu/) and managed WPs in the OpenGovIntelligence project (www.opengovintelligence.eu) which was aimed at creating transparency using open government data in six governmental pilots.
Marijn Janssen
Prof. Dr. Marijn Janssen is a full Professor in ICT & Governance and head of the Information and Communication Technology research group of the Technology, Policy and Management Faculty of Delft University of Technology. His research interests are in the field of orchestration, shared services arrangements, and open and big data. He is Co-Editor-in-Chief of Government Information Quarterly, conference chair of IFIP EGOV series and is chairing mini-tracks at e-government and information systems conferences. He has published over 500 refereed publications. He was nominated in 2018 and 2019 by Apolitical as one of the 100 most influential people in the Digital Government worldwide https://apolitical.co/lists/digital-government-world100. More information: www.tbm.tudelft.nl/marijnj.
Related Research Data
References
- Abu-Shanab, E. A. (2015). Reengineering the open government concept: An empirical support for a proposed model. Government Information Quarterly, 32(4), 453–463. doi:10.1016/j.giq.2015.07.002
- Ahn, T. S., Choi, Y. S., Hwang, I., & Hyeon, J. (2018). The effect of information asymmetry and participative target setting on target ratcheting and incentives. Public Performance and Management Review, 41(3), 439–468. doi:10.1080/15309576.2018.1456940
- Angst, C., Agarwal, R., Gao, G. G., Khuntia, J., & McCullough, J. S. (2014). Information technology and voluntary quality disclosure by hospitals. Decision Support Systems, 57, 367–375. doi:10.1016/j.dss.2012.10.042
- Auger, G. A. (2014). Trust me, trust me not: An experimental analysis of the effect of transparency on organizations. Journal of Public Relations Research, 26(4), 325–343. doi:10.1080/1062726X.2014.908722
- Bannister, F., & Connolly, R. (2011). The trouble with transparency: A critical review of openness in e-Government. Policy and Internet, 3(1), 8. doi:10.2202/1944-2866.1076
- Barry, E., & Bannister, F. (2014). Barriers to open data release: A view from the top. Information Polity, 19(1–2), 129–152. doi:10.3233/IP-140327
- Bauhr, M., & Grimes, M. (2014). Indignation or resignation: The implications of transparency for societal accountability. Governance, 27(2), 291–320. doi:10.1111/gove.12033
- Bertot, J. C., Gorham, U., Jaeger, P. T., Sarin, L. C., & Choi, H. (2014). Big data, open government and e-government: Issues, policies and recommendations. Information Polity, 19(1–2), 5–16. doi:10.3233/IP-140328
- Bertot, J. C., Jaeger, P. T., & Grimes, J. M. (2010). Using ICTs to create a culture of transparency: E-government and social media as openness and anti-corruption tools for societies. Government Information Quarterly, 27(3), 264–271. doi:10.1016/j.giq.2010.03.001
- Blomgren, M. (2007). The drive for transparency: Organizational field transformations in Swedish healthcare. Public Administration, 85(1), 67–82. doi:10.1111/j.1467-9299.2007.00634.x
- Bonsón, E., Torres, L., Royo, S., & Flores, F. (2012). Local e-government 2.0: Social media and corporate transparency in municipalities. Government Information Quarterly, 29(2), 123–132. doi:10.1016/j.giq.2011.10.001
- Bridges, F., Appel, L., & Grossklags, J. (2012). Young adults' online participation behaviors: An exploratory study of web 2.0 use for political engagement. Information Polity, 17(2), 163–176. doi:10.3233/IP-2012-0271
- Chen, Y.-C. (2012). A comparative study of e-government XBRL implementations: The potential of improving information transparency and efficiency. Government Information Quarterly, 29(4), 553–563. doi:10.1016/j.giq.2012.05.009
- Chen, Z.-J., Vogel, D., & Wang, Z.-H. (2016). How to satisfy citizens? Using mobile government to reengineer fair government processes. Decision Support Systems, 82, 47–57. doi:10.1016/j.dss.2015.11.005
- Chun, S., & Cho, J.-S. (2012). E-participation and transparent policy decision making. Information Polity, 17(2), 129–145. doi:10.3233/IP-2012-0273
- Coglianese, C. (2009). The transparency president? The Obama administration and open government. Governance, 22(4), 529–544. doi:10.1111/j.1468-0491.2009.01451.x
- Conradie, P., & Choenni, S. (2014). On the barriers for local government releasing open data. Government Information Quarterly, 31(Supp 1), S10–S17. doi:10.1016/j.giq.2014.01.003
- Cook, M. A. (1996). Building Enterprise Information Architectures. Reengineering Information Systems. New Jersey: Prentice Hall.
- Cross, J. P. (2014). The seen and the unseen in legislative politics: Explaining censorship in the Council of Ministers of the European Union. Journal of European Public Policy, 21(2), 268–285. doi:10.1080/13501763.2013.830354
- Cuadrado-Ballesteros, B. (2014). The impact of functional decentralization and externalization on local government transparency. Government Information Quarterly, 31(2), 265–277. doi:10.1016/j.giq.2013.10.012
- David‐Barrett, E., & Okamura, K. (2016). Norm diffusion and reputation: The rise of the extractive industries transparency initiative. Governance, 29(2), 227–246. doi:10.1111/gove.12163
- de Fine Licht, J. (2014). Policy area as a potential moderator of transparency effects: An experiment. Public Administration Review, 74(3), 361–371. doi:10.1111/puar.12194
- De Fine Licht, J., Naurin, D., Esaiasson, P., & Gilljam, M. (2014). When does transparency generate legitimacy? Experimenting on a context‐bound relationship. Governance, 27(1), 111–134. doi:10.1111/gove.12021
- Delone, W. H., & McLean, E. R. (2003). The DeLone and McLean model of information systems success: A ten-year update. Journal of Management Information Systems, 19(4), 9–30.
- Deng, S., Peng, J., & Wang, C. (2013). Fiscal transparency at the Chinese provincial level. Public Administration, 91(4), 947–963. doi:10.1111/padm.12031
- Eisenhardt, K. M. (1989). Agency theory: An assessment and review. Academy of Management Review, 14(1), 57–74. doi:10.5465/amr.1989.4279003
- European Commission. (2010). The European eGovernment Action Plan 2011-2015. Retrieved from Brussels: https://eur-lex.europa.eu/LexUriServ/LexUriServ.do?uri=COM:2010:0743:FIN:EN:PDF
- Evans, A. M., & Campos, A. (2013). Open government initiatives: Challenges of citizen participation. Journal of Policy Analysis and Management, 32(1), 172–185. doi:10.1002/pam.21651
- French, P. E. (2011). Enhancing the legitimacy of local government pandemic influenza planning through transparency and public engagement. Public Administration Review, 71(2), 253–264. doi:10.1111/j.1540-6210.2011.02336.x
- Furtado, V., Ayres, L., De Oliveira, M., Vasconcelos, E., Caminha, C., D’Orleans, J., & Belchior, M. (2010). Collective intelligence in law enforcement–The WikiCrimes system. Information Sciences, 180(1), 4–17. doi:10.1016/j.ins.2009.08.004
- Ganapati, S., & Reddick, C. G. (2014). The use of ICT for open government in US municipalities: Perceptions of chief administrative officers. Public Performance and Management Review, 37(3), 365–387. doi:10.2753/PMR1530-9576370302
- Gandía, J. L., Marrahí, L., & Huguet, D. (2016). Digital transparency and Web 2.0 in Spanish city councils. Government Information Quarterly, 33(1), 28–39. doi:10.1016/j.giq.2015.12.004
- Graham, F. S., Gooden, S. T., & Martin, K. J. (2016). Navigating the Transparency–Privacy Paradox in Public Sector Data Sharing. The American Review of Public Administration, 46(5), 569–591. doi:10.1177/0275074014561116
- Grimmelikhuijsen, S. (2009). Do transparent government agencies strengthen trust?. Information Polity, 14(3), 173–186. doi:10.3233/IP-2009-0175
- Grimmelikhuijsen, S. (2011). Being transparent or spinning the message? An experiment into the effects of varying message content on trust in government. Information Polity, 16(1), 35–50. doi:10.3233/IP-2011-0222
- Grimmelikhuijsen, S. (2012). A good man but a bad wizard. About the limits and future of transparency of democratic governments. Information Polity, 17(3–4), 293–302. doi:10.3233/IP-2012-000288
- Grimmelikhuijsen, S. G., & Feeney, M. K. (2016). Developing and testing an integrative framework for open government adoption in local governments. Public Administration Review, doi:10.1111/puar.12689
- Grimmelikhuijsen, S. G., & Meijer, A. J. (2014). Effects of transparency on the perceived trustworthiness of a government organization: Evidence from an online experiment. Journal of Public Administration Research and Theory, 24(1), 137–157. doi:10.1093/jopart/mus048
- Grimmelikhuijsen, S., & Klijn, A. (2015). The effects of judicial transparency on public trust: Evidence from a field experiment. Public Administration, 93(4), 995–1011. doi:10.1111/padm.12149
- Guillamón, M.-D., Ríos, A.-M., Gesuele, B., & Metallo, C. (2016). Factors influencing social media use in local governments: The case of Italy and Spain. Government Information Quarterly, 33(3), 460–471.
- Halachmi, A., & Greiling, D. (2013). Transparency, e-government, and accountability: Some issues and considerations. Public Performance and Management Review, 36(4), 562–584. doi:10.2753/PMR1530-9576360404
- Harrison, T. M., & Sayogo, D. S. (2014). Transparency, participation, and accountability practices in open government: A comparative study. Government Information Quarterly, 31(4), 513–525. doi:10.1016/j.giq.2014.08.002
- Harrison, T. M., Pardo, T. A., & Cook, M. (2012). Creating open government ecosystems: A research and development agenda. Future Internet, 4(4), 900–928. doi:10.3390/fi4040900
- Harrison, T. M., Guerrero, S., Burke, G. B., Cook, M., Cresswell, A., Helbig, N., … Pardo, T. (2012). Open government and e-government: Democratic challenges from a public value perspective. Information Polity, 17(2), 83–97. doi:10.3233/IP-2012-0269
- Helbig, N., Styrin, E., Canestraro, D., & Pardo, T. (2010, May). Information and transparency: Learning from recovery act reporting experiences. Paper presented at the Proceedings of the 11th Annual International Digital Government Research Conference on Public Administration Online: Challenges and Opportunities (pp. 59–65). Digital Government Society of North America.
- Höffner, K., Martin, M., & Lehmann, J. (2015). LinkedSpending: Openspending becomes linked open data. Semantic Web, 7(1), 95–104. doi:10.3233/SW-150172
- Hoitash, R., & Hoitash, U. (2017). Measuring accounting reporting complexity with XBRL. The Accounting Review, 93(1), 259–287. doi:10.2139/ssrn.2433677.
- Hollyer, J. R., Rosendorff, B. P., & Vreeland, J. R. (2014). Measuring transparency. Political Analysis, 22(4), 413. mpu001. doi:10.1093/pan/mpu001
- Hsieh, H.-F., & Shannon, S. E. (2005). Three approaches to qualitative content analysis. Qualitative Health Research, 15(9), 1277–1288. doi:10.1177/1049732305276687
- Jaeger, P. T., & Bertot, J. C. (2010). Transparency and technological change: Ensuring equal and sustained public access to government information. Government Information Quarterly, 27(4), 371–376. doi:10.1016/j.giq.2010.05.003
- Janssen, M., & Kuk, G. (2015). Big and open linked data (BOLD) in research, policy and practice. Journal of Organizational Computing and Electronic Commerce, 26(1), (just-accepted). doi:10.1080/10919392.2015.1124005
- Janssen, M., & van den Hoven, J. (2015). Big and open linked data (BOLD) in government: A challenge to transparency and privacy? Government Information Quarterly, 32(4), 363–368. doi:10.1016/j.giq.2015.11.007
- Janssen, M., Charalabidis, Y., & Zuiderwijk, A. (2012). Benefits, adoption barriers and myths of open data and open government. Information Systems Management, 29(4), 258–268. doi:10.1080/10580530.2012.716740
- Janssen, M., Janssen, M., Matheus, R., Matheus, R., Longo, J., Longo, J., … Weerakkody, V. (2017). Transparency-by-design as a foundation for open government. Transforming Government: People, Process and Policy, 11(1), 2–8. doi:10.1108/TG-02-2017-0015
- Janssen, M., Matheus, R., & Zuiderwijk, A. (2015). Big and open linked data (BOLD) to create smart cities and citizens: Insights from smart energy and mobility cases. In E. Tambouris, M. Janssen, H. J. Scholl, M. A. Wimmer, K. Tarabanis, M. Gascó, B. Klievink, I. Lindgren, & P. Parycek (Eds.), Electronic Government (Vol. 9248, pp. 79–90). Cham: Springer International Publishing.
- Kashin, K., King, G., & Soneji, S. (2015). Explaining Systematic Bias and Nontransparency in US Social Security Administration Forecasts. Political Analysis, 23(3), 336–362. doi:10.1093/pan/mpv011
- Lourenço, R. P. (2013). Data disclosure and transparency for accountability: A strategy and case analysis. Information Polity, 18(3), 243–260. doi:10.3233/IP-130310
- Lourenço, R. P. (2015). An analysis of open government portals: A perspective of transparency for accountability. Government Information Quarterly, 32(3), 323. doi:10.1016/j.giq.2015.05.006
- Martin, M., Stadler, C., Frischmuth, P., & Lehmann, J. (2014). Increasing the financial transparency of european commission project funding. Semantic Web, 5(2), 157–164.
- Mauro, S. G., Cinquini, L., & Grossi, G. (2018). External pressures and internal dynamics in the institutionalization of performance-based budgeting: An endless process? Public Performance and Management Review, 41(2), 224–252. doi:10.1080/15309576.2018.1431137
- McDermott, P. (2010). Building open government. Government Information Quarterly, 27(4), 401–413. doi:10.1016/j.giq.2010.07.002
- McNeal, R., & Hale, K. (2010). E-disclosure of campaign finance information: Divergent interests in the states. Journal of Information Technology and Politics, 7(1), 52–66. doi:10.1080/19331680903255759
- Meijer, A. (2013). Understanding the complex dynamics of transparency. Public Administration Review, 73(3), 429–439. doi:10.1111/puar.12032
- Michener, G. (2015). How cabinet size and legislative control shape the strength of transparency laws. Governance, 28(1), 77–94. doi:10.1111/gove.12075
- Michener, G., & Bersch, K. (2013). Identifying transparency. Information Polity, 18(3), 233–242. doi:10.3233/IP-130299
- Muñoz-Soro, J. F., Esteban, G., Corcho, O., & Serón, F. (2016). PPROC, an ontology for transparency in public procurement. Semantic Web, 7(3), 295–309. doi:10.3233/SW-150195
- Munson, S. A., Avrahami, D., Consolvo, S., Fogarty, J., Friedman, B., & Smith, I. (2012). Sunlight or sunburn: A survey of attitudes toward online availability of US public records. Information Polity, 17(2), 99–114. doi:10.3233/IP-2012-0267
- Navarro-Galera, A., Alcaraz-Quiles, F. J., & Ortiz-Rodríguez, D. (2016). Online dissemination of information on sustainability in regional governments. Effects of technological factors. Government Information Quarterly, 33(1), 53–66.
- Obama, B. (2009). Transparency and open government, memorandum for the heads of executive departments and agencies. Retrieved from http://www.whitehouse.gov/the_press_office/TransparencyandOpenGovernment
- Ølnes, S., (2016). Beyond Bitcoin Enabling Smart Government Using Blockchain Technology. In H. J., Scholl, O., Glassey, M., Janssen, B., Klievink, I., Lindgren, P., Parycek, E., Tambouris, M. A. Wimmer, T. Janowski, & D. S Soares (Eds.), Electronic Government: 15th IFIP WG 8.5 International Conference, EGOV 2016, Guimarães, Portugal, September 5-8, 2016, Proceedings (pp. 253–264). Cham: Springer International Publishing.
- Owen, B. B., Cooke, L., & Matthews, G. (2013). The development of UK government policy on citizens' access to public sector information. Information Polity, 18(1), 5–19. doi:10.3233/IP-2012-00286
- Park, S., & Gil-Garcia, J. R. (2017). Understanding Transparency and Accountability in Open Government Ecosystems: The Case of Health Data Visualizations in a State Government. Paper presented at the Proceedings of the 18th Annual International Conference on Digital Government Research, Staten Island, NY, USA.
- Peiffer, C., & Alvarez, L. (2016). Who Will Be the “Principled‐Principals”? Perceptions of Corruption and Willingness to Engage in Anticorruption Activism. Governance, 29(3), 351–369. doi:10.1111/gove.12172
- Petticrew, M., & Roberts, H. (2006). Systematic reviews in the social sciences: A practical guide. Oxford: Blackwell Publishing.
- Pina, V., Torres, L., & Royo, S. (2007). Are ICTs improving transparency and accountability in the EU regional and local governments? An empirical study. Public Administration, 85(2), 449–472. doi:10.1111/j.1467-9299.2007.00654.x
- Piotrowski, S. J., & Van Ryzin, G. G. (2007). Citizen attitudes toward transparency in local government. The American Review of Public Administration, 37(3), 306–323. doi:10.1177/0275074006296777
- Porumbescu, G. (2015). Linking transparency to trust in government and voice. The American Review of Public Administration, 47(5), 0275074015607301. doi:10.1177/0275074015607301
- Puron-Cid, G., Gil-Garcia, J. R., & Luna-Reyes, L. F. (2012). IT-enabled policy analysis: New technologies, sophisticated analysis and open data for better government decisions. Paper presented at the Proceedings of the 13th Annual International Conference on Digital Government Research, College Park, MD, USA.
- Rawlins, B. (2008). Give the emperor a mirror: Toward developing a stakeholder measurement of organizational transparency. Journal of Public Relations Research, 21(1), 71–99. doi:10.1080/10627260802153421
- Reddick, C. G., Chatfield, A. T., & Brajawidagda, U. (2016). Open government process and government transparency in crisis communication: The case of AirAsia QZ8501 crash. Information Polity, 21(3), 255–271. doi:10.3233/IP-160392
- Relly, J. E., & Sabharwal, M. (2009). Perceptions of transparency of government policymaking: A cross-national study. Government Information Quarterly, 26(1), 148–157. doi:10.1016/j.giq.2009.01.002
- Reynaers, A., & Grimmelikhuijsen, S. (2015). Transparency in public–private partnerships: Not so bad after all? Public Administration, 93(3), 609–626. doi:10.1111/padm.12142
- Ríos, A.-M., Bastida, F., & Benito, B. (2016). Budget transparency and legislative budgetary oversight: An international approach. The American Review of Public Administration, 46(5), 546–568. doi:10.1177/0275074014565020
- Roberts, N. (2002). Keeping public officials accountable through dialogue: Resolving the accountability paradox. Public Administration Review, 62(6), 658–669. doi:10.1111/1540-6210.00248
- Rodríguez Bolívar, M. P., Alcaide Muñoz, L., & López Hernández, A. M. (2013). Determinants of financial transparency in government. International Public Management Journal, 16(4), 557–602. doi:10.1080/10967494.2013.849169
- Shaikh, M., & Vaast, E. (2016). Folding and unfolding: Balancing openness and transparency in open source communities. Information Systems Research, 27(4), 813–833. doi:10.1287/isre.2016.0646
- Smith, E., Umans, T., & Thomasson, A. (2018). Stages of PPP and principal–Agent conflicts: The Swedish water and sewerage sector. Public Performance and Management Review, 41(1), 100–129. doi:10.1080/15309576.2017.1368399
- Song, C., & Lee, J. (2016). Citizens’ use of social media in government, perceived transparency, and trust in government. Public Performance and Management Review, 39(2), 430–453. doi:10.1080/15309576.2015.1108798
- Strathern, M. (2000). The Tyranny of Transparency. British Educational Research Journal, 26(3), 309–321. doi:10.1080/713651562
- Tan, Y. (2014). Transparency without democracy: The unexpected effects of China's environmental disclosure policy. Governance, 27(1), 37–62. doi:10.1111/gove.12018
- Themudo, N. S. (2013). Reassessing the impact of civil society: Nonprofit sector, press freedom, and corruption. Governance, 26(1), 63–89. doi:10.1111/j.1468-0491.2012.01602.x
- Van Ryzin, G. G., & Lavena, C. F. (2013). The credibility of government performance reporting: An experimental test. Public Performance and Management Review, 37(1), 87–103. doi:10.2753/PMR1530-9576370104
- Venkatesh, V., Thong, J. Y., Chan, F. K., & Hu, P. J. (2016). Managing citizens’ uncertainty in e-government services: The mediating and moderating roles of transparency and trust. Information Systems Research, 27(1), 87–111. doi:10.1287/isre.2015.0612
- Villeneuve, J.-P. (2014). Transparency of Transparency: The pro-active disclosure of the rules governing Access to Information as a gauge of organisational cultural transformation. The case of the Swiss transparency regime. Government Information Quarterly, 31(4), 556–562. doi:10.1016/j.giq.2013.10.010
- Ward, S. J. (2014). The magical concept of transparency. Ethics for Digital Journalists: Emerging Best Practices, 45–58.
- Worthy, B. (2010). More open but not more trusted? The effect of the Freedom of Information Act 2000 on the United Kingdom central government. Governance, 23(4), 561–582. doi:10.1111/j.1468-0491.2010.01498.x
- Worthy, B. (2015). The impact of open data in the UK: Complex, unpredictable, and political. Public Administration, 93(3), 788–805. doi:10.1111/padm.12166
- Yavuz, N., & Welch, E. W. (2014). Factors affecting openness of local government websites: Examining the differences across planning, finance and police departments. Government Information Quarterly, 31(4), 574–583. doi:10.1016/j.giq.2014.07.004
- Yoon, H., Zo, H., & Ciganek, A. P. (2011). Does XBRL adoption reduce information asymmetry? Journal of Business Research, 64(2), 157–163.
- Zuiderwijk, A., Gascó, M., Parycek, P., & Janssen, M. (2014). Special issue on innovation through open data: Guest editors' introduction. Journal of Theoretical and Applied Electronic Commerce Research, 9(3), i–xiii. doi:10.4067/S0718-18762014000200001
- Zyl, A. (2014). How civil society organizations close the gap between transparency and accountability. Governance, 27(2), 347–356.