
 ?Mathematical formulae have been encoded as MathML and are displayed in this HTML version using MathJax in order to improve their display. Uncheck the box to turn MathJax off. This feature requires Javascript. Click on a formula to zoom.
ABSTRACT
Several diagnostic measures have been employed to precisely detect the SARS-CoV-2 viral infection using viral antigens, nucleic acids, and other serological approaches. The sensitivity and specificity of the serological tests remain a challenging need. Here, we describe the detection of human anti-SARS-CoV-2 IgG and IgM antibodies qualitatively through two optimized in-house ELISA and lateral flow immunoassay. Both approaches are based on the prokaryotic expression of 50 kDa SARS-CoV-2 recombinant nucleocapsid protein. This SARS-CoV-2rN-6×His was used either to coat ELISA plates or to be conjugated to gold nanoparticles followed by colorimetric detection of bound human IgG or IgM. In the LFA, we show the optimization of nanoparticle size, protein-binding capacity, membrane treatment, and finally testing the potential capacity of using either the optimized ELISA or LFA in detecting antibodies raised against viral infection. Assessment of both methods was carried out using human sera-positive and negative SARS-CoV-2 antibodies. The ELISA and LFA tests showed 86%, 96.5% sensitivity, 92%, 93.75% specificity, 97%, 98.2% PPV, and 64%, 88.2% NPV, respectively. In conclusion, both approaches were able to successfully detect human antibodies against SARS-CoV-2 nucleocapsid protein. The importance of both protocols cannot be overstated in the detection and diagnosis of viral infections, especially in developing countries.
Introduction
The new member of Coronavirus subfamily, Coronavirinae, was discovered in 2019 by metagenomic RNA sequencing of samples from patients with unexplained pneumonia in Wuhan, China.[Citation1–4] Before 2019, there were six known human coronaviruses, belonging to α-coronavirus and β-coronavirus genera, causing respiratory diseases of different severity, including four common coronaviruses and two highly pathogenic emerging coronaviruses: severe acute respiratory syndrome coronavirus (SARS-CoV) and Middle East respiratory syndrome coronavirus (MERS-CoV).[Citation5] As distinguished from the previously isolated MERS-CoV and SARS-CoV, this seventh emerged coronavirus is named SARS-CoV-2 that harbors 380 amino acids substitution.[Citation2] The resultant coronavirus disease 2019 (COVID-19) leads to not only acute respiratory syndrome but also sudden setbacks in cardiovascular, brain, kidney, liver, and immune system.[Citation6–10] In general, fast and accurate detection of viral infection is crucial to limit the spread of resultant disease.[Citation11,Citation12]
Reverse transcription polymerase chain reaction (RT-PCR) has been used as a rapid diagnostic test during the epidemic. However, the sensitivity of this viral RNA testing varies depending on the timing of testing relative to exposure, which could lead to false-negative results.[Citation13,Citation14] Therefore, numerous laboratories pay attention to serological tests especially for patients with undetectable viral RNA. In addition, serological tests do not require high levels of biosafety or highly specialized equipment such as that of RT-PCR. The current serological assays used for COVID-19 early diagnosis are mainly based on detecting specific antibodies in patients’ sera raised against targets like nucleocapsid, spike, envelope, and receptor-binding domain, and include the enzyme-linked immunosorbent assay (ELISA), the chemiluminescence immunoassay (CLIA), lateral flow immunoassay (LFA), and electrochemiluminescence immunoassay (ECLIA).[Citation11,Citation15–18] Among them, ELISA is the commonly used laboratory assay. However, accurate detection of the target antibody depends on its specificity toward the antigen, so if the antigen is correctly chosen and purified, the assay can be made very specific.
The seventh emerged SARS-CoV-2 is a typical envelope, single-stranded positive sense RNA virus belonging to β-coronaviruses with four structural proteins: nucleocapsid protein (N), membrane protein (M), envelope protein (E), and spike protein (S). Among them, (N) protein is the most conservative, abundant, and immunogenic protein. The primary function of (N) protein is to package the viral genome (gRNA) into a long helical ribonucleocapsid (RNP) complex. Upon maturation, this complex undergoes subsequent virion assembly by interacting with the other structural proteins (M), (E), and (S). Interestingly, current studies have also shown that (N) protein can hinder the host defending RNAi pathway supporting widespread replication of virion in the host cells.[Citation19,Citation20]
In this study, we performed a comparative evaluation of two in-house approaches, ELISA and Lateral Flow Immunoassay (LFA), to detect anti-SARS-CoV-2 IgM/IgG in sera of Egyptian patients using purified recombinant SARS-CoV-2 nucleocapsid protein expressed in E. coli BL21(DE3). The availability of both protocols would be valuable for local diagnostics and epidemiological studies, especially with increasing number of samples requiring screening. Besides, both approaches are worthy for the majority of the population in developing countries since the imported tests are too expensive and not affordable.
Materials and methods
Human immune sera
A total of 235 preserved human serum samples (185 seropositive and 50 seronegative for SARS-CoV-2 antibody determined by commercial SARS-COV-2 IgG kit) (Abbott, Ireland) were tested. These sera were previously collected from patients in the first 5 months of the pandemic and before emerging of SARS-CoV-2 vaccines. The use of the serum samples was approved by the NRC ethical committee (Reference # NRC-20192).
Gene synthesis and plasmid construction
The nucleotide sequence of SARS-CoV-2-nucleocapsid gene (MN908947.2: 28290 … .2954) was obtained from the NCBI database (Gene Bank: QHD43423.1) and optimized for expression in E. coli BL21(DE3). The codon-optimized N-gene sequence was synthesized and cloned in pET28a (+) vector by GenScript, USA. It was cloned in frame with the C-terminal histidine tag (6× His) between the restriction sites NcoI and XhoI at the 5’ and 3’ ends, respectively. The recombinant plasmid was first transformed into chemically competent cells of E. coli DH5α and then purified using a plasmid miniprep purification kit (Thermo scientific). The presence of an optimized N-gene into the pET28a (+) vector was confirmed by PCR using T7 promoter forward primer and T7 terminator universal primer.
Optimized expression of SARS-CoV-2 nucleocapsid (N) protein
A single colony of successfully transformed E. coli BL21(DE3) with the recombinant plasmid SARS-CoV-2-N-pET28a (+) was grown overnight in 5 mL Luria-Bertani (LB) medium supplemented with kanamycin (25 µg/mL) at 37°C and 180 rpm. On the next day, aliquot of grown culture was diluted 100 times in fresh LB medium containing kanamycin (25 µg/mL) and grown at 30°C and 200 rpm till OD600 = 0.5–0.7 (about 2.5 hr). Isopropyl-β-D-thiogalactoside (IPTG, Bio Basic, Canada, 367-93-1) was then added at different final concentrations ranging from 0.1 to 1 mM for expression induction. The induced cultures were incubated either for 4 hr at 37°C or overnight at 20°C with agitation. SARS-CoV-2-N expression was then checked by 10% SDS-PAGE of 1 mL aliquot either after direct centrifugation and pellet resuspension in 1× SDS buffer (100 µL) or adding trichloroacetic acid (TCA) followed by an acetone wash before centrifugation and resuspension of pellet in 1× SDS. All the samples were boiled at 95°C for 10 min before loading on 10% SDS gel.
Ni-Agarose purification of SARS-CoV-2 recombinant N-protein
For purification, 100 mL of 0.1 mM IPTG-induced culture and incubated overnight at 20°C was centrifuged and resuspended in 5 mL of lysis buffer (1× phosphate buffered saline (PBS) buffer pH 7.4, 10 mM Imidazole (Sigma-Aldrich, I2399), and 0.1 mg/mL lysozyme (Vivantis, PC0710)) with agitation. The suspension was then incubated for 30 min on ice and further subjected to sonication (15 s with 15-s pause for 5–8 cycles). After centrifugation for 30 min at 5000 × g, the supernatant was incubated overnight at 4°C with Ni-NTA agarose resin (Invitrogen, R901-15) pre-equilibrated with the same buffer (lysis buffer without lysozyme). After column packaging, the resin was washed with 3 volumes of washing buffer (1× PBS buffer pH 7.4, 25 mM imidazole). N-6×His protein was then eluted using elution buffer 1 (1× PBS buffer pH 7.4, 250 mM imidazole) followed by elution buffer 2 (1× PBS buffer pH 7.4, 750 mM imidazole). Only elution fractions showing the highest concentration of purified N-6×His on 10% SDS gel were pooled, and their buffer was exchanged using centrifugal filter unit (10,000 MWCO) to remove residual imidazole.
Development and optimization of SARS-CoV-2 N-protein-human IgG/IgM ELISA
The purified recombinant N-6×His protein was used as an antigenic tool to establish and optimize an in-house rapid ELISA test following the protocol of Hussein et al..[Citation15] After optimization, plates were coated with 50 ng/well of purified rN-6×His protein in 50 mM carbonate buffer, pH 9.6 for 1 hr, to detect IgG and IgM anti SARS-CoV2 in patient’s serum. Blocking of free sites was carried out using 3% gelatin in a coating buffer for 30 min at room temperature, followed by washing with 0.01 M Tris buffered saline (TBS) containing 0.05% Tween 20, pH 7.4. Positive and negative human sera were diluted 100 times in 0.01 M TBS containing 0.5% gelatin, pH 7.4, whereas the conjugate dilution was 1:10000 in the same buffer. The incubation of antibodies was for 15 min for each antibody, before washing with 0.01 M TBS containing 0.05% Tween 20, pH 7.4. Finally, 100 µL of O-phenylenediamine (Loba Chemie, 05207) solution (0.33 mg/mL in 0.1 M citrate buffer, pH 5.2, in the presence of 0.04% hydrogen peroxide) was added. Absorbance values were determined at 450 nm after 15 min. Statistical analysis of the obtained measurements was carried out using the Statistical Package for Social Sciences (SPSS).
Immunoblot analysis
The purified rN-6×His protein was electrophoresed on 10% SDS-PAGE gel, and then transferred onto a 0.22 mm PVDF membrane using the semidry method described in Hussein et al.[Citation21] After protein transfer, the membranes were blocked in 3% (w/v) gelatin dissolved in 0.01 M TBS, pH 7.4 for 1 hr at room temperature and washed three times with TBS containing 0.05% Tween 20 for 5 min. Washed membranes were then incubated for another 1 hr with the patient’s serum samples diluted in 0.01 M TBS (1:1000). Membranes were washed three times again for 5 min and then incubated with the secondary antibody. We used anti-human secondary antibodies conjugated to horseradish peroxidase (Invitrogen, A18805) and signals were detected after incubation in 4-chloro-1-naphthol solution containing hydrogen peroxide.
Preparation and characterization of gold nanoparticles (AuNPs)
Gold nanoparticles of different sizes (65 ± 4 nm, 40 ± 4 nm, and 20 ± 4 nm) were synthesized via chemical reduction method. Briefly, serial volumes (0.5, 1, and 2 mL) of 1% tri-sodium citrate (Na3C6H5O7·2 H2O) (Sigma-Aldrich, 6132-04-3) were added to a boiling 0.01% hydrogen tetrachloroaurate (HAuCl4n) (Sigma-Aldrich, 520918) with continuous shaking until the color changes from blue to dark red. The gold nanoparticle solutions were then left to cool down to room temperature and stored in an amber colored bottle. The samples from each solution were characterized using high-resolution transmission electron microscopy (HR-TEM, JOEL JEM-2100) operating at 200 kilovolt (kV) and equipped with Gatan digital camera Erlangshen ES500.
Conjugation of AuNPs with Rn-6×His and rabbit IgG proteins
To prepare AuNPs-rN-6×His and AuNPs-rabbit IgG, we tested different conditions of protein concentration and pH to reach the optimum conjugation with AuNPs. The pH of AuNPs was adjusted to pH values: 7.5 (using 100 mM of 4-(2-hydroxethyl)-1piperazineethanesuulfonic acid (HEPES, Sigma-Aldrich, H3375), 8.5 (using 100 mM phosphate Buffer Solution (PBS), and 9.5 and 10.5 (using 100 mM potassium carbonate buffer (PCB)). In detail, 20 µL of each titration solution were mixed with 150 µL of each colloidal AuNPs solution. Then, different concentrations of either purified rN-6×His (0.85 mg/mL and 0.32 mg/mL) or rabbit IgG (purified according to the method described by Aly et al.[Citation22]) (5 µL, 10 µL, 15 µL, and 20 µL) were added. Both rNP-6×His and rabbit IgG were used as such or after dialysis against 0.02 M sodium borate for 24 hr with three buffer changes. The mixtures were vortexed for 5 s and then rotated for 10 min. Subsequently, an aliquot of 50 µL from each mixture was mixed separately with 50 µL of 10% NaCl solution, to verify the stability of AuNP conjugates, vortexed for 5 s and rotated for 1 hr at room temperature. The determination of the optimum protein concentration and pH were monitored by observing the changes in the mixture’s color.
Blocking the residual surface of the AuNPs and assessment of unbound proteins
After determining the optimum concentration of purified SARS-CoV-2rN-6×His and rabbit IgG, the determined concentrations were added to a colloidal gold solution of selected size (20 nm) and incubated for 20 min under gentle shaking. Then, 5 μg of 17-β-estradiol (Sigma-Aldrich, E2257) was added to the IgG conjugate solutions, to enhance the orientation attachment of antibodies, with gentle shaking. Subsequently, 30 µL of 10% Bovine Serum Albumin (BSA) dissolved in 0.02 M sodium borate solution was added to block the residual surface of the AuNPs. The mixtures were then incubated for 20 min with gentle shaking before being centrifuged at 15,000 × g for 30 min at 4°C. The centrifugation step was done three times to remove the supernatant containing the unbound proteins. After the last centrifugation, the pellets were suspended in 2 mL of 0.02 M sodium borate solution (containing 1% BSA, 0.05% sodium azide and 1% polyethylene glycol (PEG-20000, Sigma-Aldrich, 95172)). AuNPs-rN-6×His and AuNPs-Rabbit IgG were stored at ‒20°C before use. In parallel, to assess the efficiency of conjugation, protein concentration in the removed supernatants was determined using Bio-Rad protein determination kit according to the manufacturer’s instructions.
Preparation and treatment of immunochromatographic lateral flow strip (LF)
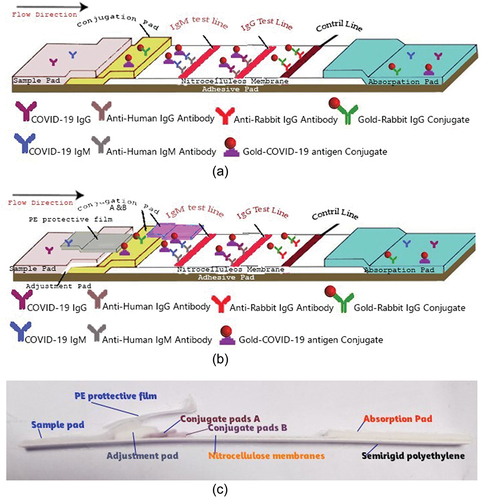
Two types of LF strips (LF 1 and 2) were prepared. LF-type 1 which does not contain the Adjustment pads, second conjugated pads, and self-adhesive polyethylene protective film, while the second type (LF-type 2, ) contained all three missing pads in type 1. All membranes were purchased from GE Healthcare. The treatments were performed as follows:
Figure 1. Schematic illustration of the two types (A shows type 1, B and c show type 2) of immunochromatographic lateral flow strips (LF) for IgG/IgM detection.
Sample pad treatment and preparation
One glass fiber pad from LF-type 1 with thickness 247 μm, wicking rate 35.6 s/4 cm, and water absorption of 25.3 mg/cm2 was prepared and cut into 1.5 × 30 cm2. Subsequently, the pad was immersed in a sample pad treatment solution (0.01 M PBS, pH 7.4 containing 0.3% Tween 20, 0.1% sodium azide, and 0.1 M sodium chloride) for 1 min at room temperature and dried at 45°C for 35 min in a drying oven.
Adjustment pad treatment and preparation
One glass fiber pad from VF2 type with thickness 785 μm, wicking rate 23.8 s/4 cm, and water absorption of 82.6 mg/cm2 was prepared and cut into 0.5 × 30 cm2. Subsequently, the pad was immersed in an adjustment pad treatment solution (0.01 PBS, pH 7.4 containing 0.1 M sodium chloride, 0.3% Tween 20, 3% sucrose, and 0.05% sodium azide) for 2 min at room temperature and dried at 50°C for 35 min in a drying oven. There are two main roles of the adjustment pad: 1 – Extra filtration process which prevents any impurities or RBCs to pass to nitrocellulose membrane and 2 – Enhancement of strip’s flow by adding 0.3% Tween 20 and 3% sucrose as an emulsion solution which will increase the sample flow on the nitrocellulose membrane, and minimize the test time to be within 7–10 min.
Conjugate release pads treatment and preparation
Two glass fiber pads from Standard 17 type with thickness 370 μm, wicking rate 34.5 s/4 cm, water absorption of 44.9 mg/cm2, and 75% release of gold conjugate after 90 s were prepared. Subsequently, the pads were immersed in a conjugate treatment solution (0.02 M sodium borate pH 8.0 containing 0.05% sodium azide, 2% Bovine Serum Albumin, 0.5 M Sodium chloride, 0.2% Tween 20, and 3% sucrose) for 1 min at room temperature and dried at 45°C for 35 min in a drying oven. Then, 0.5 mL of each of the AuNPs-Ag conjugate solution and AuNPs-rabbit IgG conjugate solution was added separately to 1 mL of the conjugate treatment solution (as mentioned before), and the solutions were gently mixed well. Then, each mixture conjugate solutions was sprayed onto the glass fiber pads (Standard 17) at 15 μL/cm using the Air-Jet sprayer, followed by drying the strips at 45°C for 35 min by using an air drying oven, and the pads were cut into 0.5 × 30 cm2 strips.
Nitrocellulose membranes preparation
The nitrocellulose membranes (FF80HP blocked type with capillary rise 60–100 s/4 cm, total caliper 200 μm) were cut into 2.5 × 30 cm2 strips. Anti-human Immunoglobulin G (Invitrogen, A18805), anti-human Immunoglobulin M (Invitrogen, A18835), and anti-rabbit immunoglobulin G antibodies (Merck, 12-348) were diluted to 1 mg/mL in 0.01 M PBS, pH 7.4 for the IgG test line, IgM test line and control line, respectively. The solutions were dispensed onto the membranes at 1 μL/cm as tests and control lines with a space of 0.3 cm between lines. The strips were dried at 37°C for 30 min by using an air drying oven.
Absorption pads preparation
The absorption pad membranes (CF5, 100% cotton linter type) with thickness 954 μm, wicking rate 63.3 s/4 cm, and water absorption of 99.2 mg/cm2 were cut into 2 × 30 cm2 strips.
Semirigid polyethylene (adhesive sheet) preparation
The adhesive sheet (double-sided adhesive) was cut into 6.5 × 30 cm2 strips.
Self-adhesive polyethylene protective film
Transparent low-viscosity self-adhesive PE protective film 60-micron polyvinyl chloride (PVC) was cut into 1 × 30 cm2 strips.
Statistical analysis
GraphPad Prism software (version 8) was used to generate graphs. Statistical analysis, determination of cutoff value, and calculations of sensitivity, specificity, agreement, positive predicted value (PPV), and negative predicted value (NPV) were carried out as described in Hussein et al..[Citation15]
Results
Cloning, expression, and purification of SARS-CoV-2 N protein
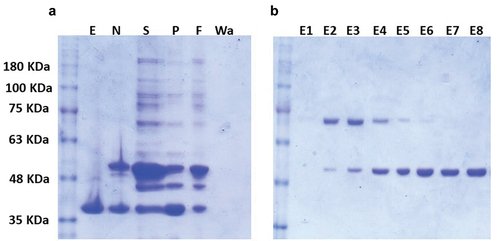
Using the pET28a plasmid, a full-length codon-optimized sequence of the N-gene was cloned and expressed in E. coli BL21(DE3). Then, the optimal conditions for high yield expression of soluble SARS-CoV-2-N-fusion protein were determined. First, we tested different IPTG concentrations (ranging from 0.1 to 1 mM) and found that there was no detectable difference in the level of the overexpressed band at 50 kDa, corresponding to the predicted molecular mass of recombinant SARS-CoV-2-rNP-6×His (data not shown). Second, we tested different induction temperature/time and found that higher expression level was achieved at 20°C and overnight incubation compared to 37°C for 4 hr (). The cells of E. coli BL21 (DE3) transformed with the recombinant pET28a-rN-6×His plasmid were grown to an OD600 = 0.6–0.8 at 30°C, then after induction with 0.1 mM IPTG, the temperature was changed to 20°C and the culture incubated overnight. Before proceeding to SARS-CoV-2rN-6×His purification, we tested whether it is present as soluble cytosolic protein or as insoluble inclusion bodies. For this purpose, the lysate supernatant and pellet were separately analyzed by 10% SDS-PAGE (Supplementary Fig. S1). Interestingly, SARS-CoV-2rNP-6×His was mainly detected in the soluble fraction under the tested conditions. Therefore, the soluble fraction was used for further purification step with Ni-NTA agarose as mentioned in Materials and Methods. Successfully, we obtained a SARS-CoV-2rNP-6×His purified to homogeneity in all elution fractions with an elution buffer containing 750 mM imidazole (). For further investigations, the elution fractions from E5 to E8 were pooled while the elution buffer was exchanged with 1× PBS pH 7.4.
Figure 2. SDS–PAGE analysis of N-fusion protein expressed under different conditions. Cultures of E. coli BL21(DE3) transformed with either pEt28a-N-6×His or empty pEt28a (+) were induced using 0.1 mM IPTG but incubated at different temperatures for different incubation periods. Lanes 1 to 4: incubation at 37°C for 4 h; lanes 5–8: incubation at 20°C overnight. Lanes 1, 3, 5, and 7: negative control (E. coli BL21(DE3) transformed with empty pEt28a(+)); lanes 2, 4, 6, and 8: expression of N-6×His recombinant vector; lanes 1, 2, 5, and 6: Samples were treated with TCA, washed with acetone, and then dissolved in 1× SDS buffer after centrifugation. Lanes 3, 4, 7, and 8: samples were directly centrifuged and then resuspended in 1× SDS buffer. All samples were then boiled for 10 min at 95°C and loaded on 10% SDS–PAGE. Black arrow points to the overexpressed 50 kDa fused protein corresponding to the predicted molecular mass of N-6×His protein.
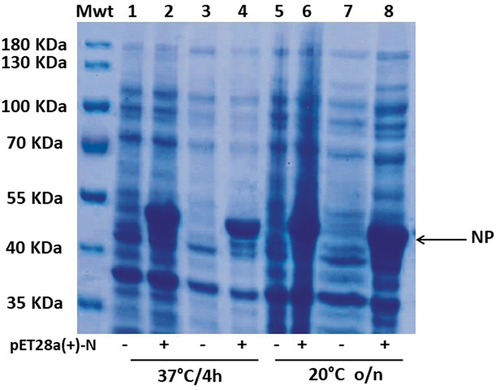
Figure 3. Expression and purification of SARS-CoV-N-6×His protein using Ni-NTA column. Samples were obtained from overnight cultures of E. coli BL21(DE3) transformed with either empty pEt28a (+) or pEt28a-N-6×His vectors. The cultures were incubated at 20°C and induced with 0.1 mM IPTG. (a): the expression of empty pEt28a vector (E) and recombinant N-6×His vector (N); (S) is the soluble fraction of culture while (P) is the precipitate; (F) represents the column flow through containing unbound N-6×His protein; (Wa) is the washing buffer containing any residuals of unbound N-6×His protein. (b) All elution fractions using 250 mM imidazole (E1 to E5) followed by 750 mM imidazole (E6 to E8). The E6 to E8 fractions were pooled, dialyzed, and used for further analysis.
Testing of SARS-CoV-2rN-6×His protein for specific reactivity and cross reactivity
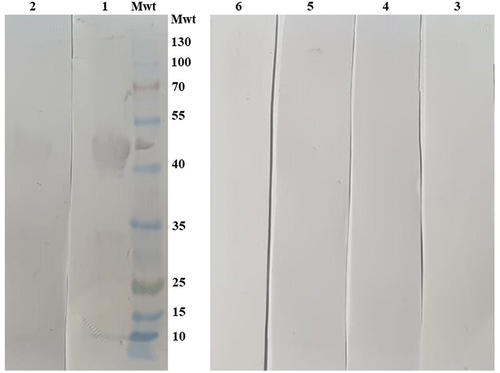
To confirm if the purified SARS-CoV-2rN-6×His will specifically react with sera of patients infected with SARS-CoV-2, a western blot assay was developed using five SARS-CoV-2 positive and five negative sera. The band of the corresponding SARS-CoV-2rN-6×His molecular mass (50 kDa) was detected only in the seropositive sera (). This indicated that the SARS-CoV-2rN-6×His protein is a promising candidate for the detection of anti-SARS-CoV-2 antibodies. Next, we wondered if the SARS-CoV-2rN-6×His protein could cross-react with other antibodies that might be present at high titer in Egyptian sera. Accordingly, we tested the cross reactivity of SARS-CoV-2rN-6×His with sera of patients infected with Hepatitis C virus, collected before 2018. We found no cross-reaction between the N-fusion protein and sera against other human viruses like that of Hepatitis C (). Taken together, these results suggested that SARS-CoV-2rN-6×His protein is a promising antigen for the specific detection of human SARS coronavirus antibodies. Accordingly, the purified recombinant SARS-CoV-2rNP-6×His protein was used to develop two rapid detection methods including ELISA and LFA.
Figure 4. Validation of the purified recombinant SARS-CoV-2 nucleocapsid protein cross reactivity and specificity using Western blot analysis. Nucleocapsid-6×His protein was loaded on 10% SDS gel, transferred onto 0.22 mm PVDF membrane, and tested against human sera previously collected and stored from patients infected with Hepatitis C virus. Lanes 1 and 2 are two SARS-CoV-2 positive sera, lanes 3 and 4 are two SARS-CoV-2 negative sera, and two hepatitis C positive sera in lanes 5 and 6.
Loading of purified SARS-CoV-2rN-6×His on solid support for development of LFA and ELISA
For the development of LFA, gold nanoparticles (AuNP) were synthesized and optimized for conjugation of purified SARS-CoV-2rN-6×His protein. Based on our screening of different sizes of AuNP (65 ± 4, 40 ± 4 or 20 ± 4 nm) which were obtained by addition of 0.5 mL, 1 mL, and 2 mL of 1% trisodium citrate solution, respectively, to 100 mL of HAuCl4 solution with maximum conjugation efficiency, we used AuNPs with diameter size of 20 nm and a protein conjugation efficiency of 66%. This efficiency was obtained by conjugation of purified SARS-CoV-2rN-6×His protein after dialysis against 0.02 M sodium borate buffer at pH 7.4 for 24 h at 4°C to be loaded to the immunochromatographic lateral flow strips (LF) (Supplementary Table S1). The dialysis step of SARS-CoV-2rN-6×His protein was mandatory for the success of the conjugation since the un-dialyzed SARS-CoV-2rN-6×His protein could not be adsorbed on the surface of AuNPs (data not shown). In parallel, the optimal conjugation efficiency of 74% was obtained with the rabbit IgG using the same size of AuNP (20 nm). Before and after conjugation, both N-protein and rabbit IgG concentrations were estimated to calculate the conjugation efficiency (Supplementary Table S1).
In parallel, 96-well polypropylene flat bottom ELISA plates were coated with different concentrations of purified SARS-CoV-2rN-6×His protein ranging from 12.5 ng to 400 ng, and the reactivity of different serum dilutions (ranging from 1:20 to 1:320) was tested for detection of either anti-SARS-CoV-2 IgM or anti-SARS-CoV-2 IgG. The lowest rN-6×His concentration yielding more than 6 times difference in optical density at 450 nm between SARS-CoV-2 negative and positive sera was chosen for the next steps. For both IgM and IgG detection, this concentration of SARS-CoV-2rN-6×His protein was found to be 50 ng (Supplementary Fig. S1) using serum dilution of 1:100 and conjugate dilution of 1:10000.
Assessment of anti-SARS-CoV-2 IgM and IgG using LF assay and ELISA
A total of 110 confirmed IgG-positive samples for SARS-CoV-2 infection and 30 confirmed negative samples using the commercial kit SARS-CoV-2 IgG (Abbott, Ireland) were tested using our laboratory-prepared immunochromatographic lateral flow strips of type 2 (LF-type 2) since type 1 of LF showed low-efficiency detection as shown in Supplementary Table S2.
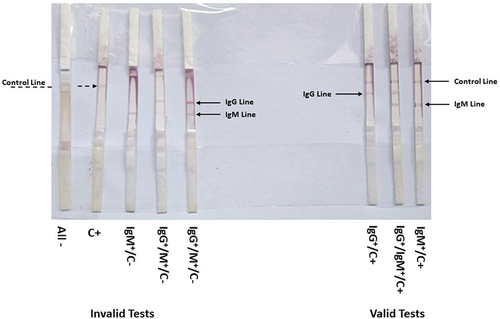
All IgG confirmed positive sera samples were also positive in our trial using LF (showing a colored band at both the control line and IgG), with the exception of four samples that showed false-negative results. The elapsed average time between loading the sera samples and the appearance of the colored band(s) was between 7 and 10 min. The IgG negative sera were also negative, with only two samples showing false-positive results (). With respect to IgM testing, all commercial ELISA-confirmed IgM sera showed 98% positivity on the LF as represented in (). The tests were considered invalid if the control bands did not appear even if bands corresponding to IgG or IgM were present.
Figure 5. Assessment of the constructed lateral flow (LF) strips of type 2 using SARS-CoV-2 negative (-) and positive (+) IgG sera. Serum samples were loaded on sample pad of LF-type 2 strips and left to migrate. The colored bands were clearly observed after 10 min. Solid arrow describes the positive control red line and the dashed arrow shows the positive IgG red line of positive sera. Negative sera lack the IgG red line.
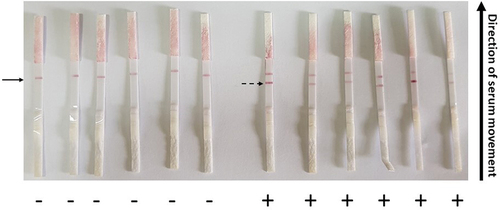
Figure 6. Validity testing of LF-type 2 strips. The strips showing invalid if the control band is not detected (C‒) and valid tests (C+) of SARS-CoV-2 negative (‒) and positive (+) controls, IgG, and IgM lines.
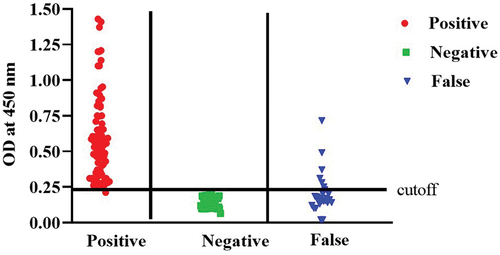
In parallel, we used the ELISA plates coated with 50 ng of purified SARS-CoV-2rN-6×His protein as described in the previous section to test its suitability for detection of specific anti-SARS-CoV-2 immunoglobulin. The developed ELISA test showed a cutoff value of 0.23 and the results are represented in (). Apart from the 50 negative samples used in this ELISA test, the OD450 readings of 44 negative samples were less than the cutoff value, while six samples were above this value, indicating false-positive results. On the other hand, 158 samples of the positive samples predetermined with the same commercial kit SARS-CoV-2 IgG kit (Abbott, Ireland), were tested as positive () and 27 of these samples were considered as false negative. Similar results were obtained from three independent experiments.
Figure 7. The cut-off value of ELISA assay and testing of human sera for the presence of IgG antibodies directed to SARS-CoV-2 N-protein using the optimized ELISA conditions. False group means both false positive and false negative. The cutoff value of the developed assay was determined as follow:.
The accuracy of the ELISA test was assessed using ROC analysis, and the cutoff value that provides the best sensitivity and specificity was determined. With an area under the curve (AUC) of 0.892 ± 0.028 and a 95% confidence interval of 0.84 to 0.95, the created and refined ELISA displayed a remarkable accuracy ().
Figure 8. Receiver operating characteristics (ROC) analysis of the optimized developed indirect ELISA using recombinant SARS-CoV-2 N-protein.

Comparison of parameters Specificity, PPV between in-house ELISA and LFA
Diagnostic indices, such as sensitivity, specificity, positive predictive value (PPV), and negative predictive values (NPV), between the ELISA technique and the lateral flow assay using immunochromatographic strips (LF) were compared (). The figure shows the indices for the IgG testing. The LFA showed 10.5% more sensitivity than ELISA and 24.2% efficiency more than ELISA, to exclude SARS-CoV-2 infectivity.
Table 1. Comparison of the characteristics of test (sensitivity and specificity) and the clinical relevance of test (PPV and NPV) of Indirect ELISA and LF-type 2, using SARS-CoV-2 recombinant N-Protein antigen.
Discussion
Since SARS-CoV-2 broke out in 2019, the development of accurate and fast immunological assay became of essential importance either for early diagnosis or epidemiological purposes. However, the lack of required sensitivity and specificity of many of the tests available has led some to conclude that they have limited clinical utility.[Citation23] We have previously developed and optimized an ELISA assay that enables sensitive and specific detection of IgG against the receptor-binding domain (RBD) of SARS CoV-2 spike protein.[Citation15] However, ongoing mutations and deletions in the viral S-protein of new SARS-CoV-2 variants as well as the escalating utilization of S-based vaccines have promoted us to evaluate the most conservative viral protein, the nucleocapsid (N) protein, as an antigen for a specific and accurate diagnostic ELISA protocol specially to distinguish between SARS-CoV-2 infection and vaccine response. More importantly, we also used the E. coli expressed N protein in a home-made lateral flow assay. The results obtained following the application of both locally prepared approaches, ELISA and LFA, were compared and evaluated. In many studies, high titer of IgG antibodies against the N protein has been detected in sera from SARS-CoV-2 patients.[Citation24–26]
Unlike our previous RBD-expression,[Citation15] we successfully expressed the full-length N recombinant protein under mild induction conditions and easily recovered it in soluble form without using any denaturing agents. Similar results were obtained by Li et al.,[Citation16] but the expression level of N protein was very low and therefore they focused on inclusion body expression which will present a considerable challenge for large-scale production. For purification, one step of nickel affinity chromatography was successful and adequate to obtain highly purified N-protein compared to other studies using E. coli to express recombinant N-protein, have applied a second step of purification such as size-exclusion chromatography or cation exchange chromatography.[Citation16,Citation27–29] More importantly, recombinant N-protein purification from soluble fraction was shown previously to maintain its secondary structure.[Citation30] Altogether, these results support the use of our E. coli expressed N-protein for further applications.
During the early stages of viral infections, the detection of antibody presence might be of limited success. The immune system is still unfamiliar with the invading pathogen and its antigens. During this period IgM appears and disappears after a short life span of days to 2 weeks. On the other hand, the long-lasting IgG will provide with the IgM information about the time course infection of the virus.
Various immunoassays have different specificity, sensitivity, and different times of turnaround. The developed ELISA test described here used the E. coli expressed N-protein, showed 86% sensitivity, 92% specificity, 87% agreement, 97.5% positive predicted value (PPV), and 64% negative predicted value (NPV) and the estimated time of turnaround is 45 min (starting from adding the patient sample till the absorbance detection). The commercially available ELISA kits are manufactured by Calbiotech Inc. and EUROIMMUN AG. Both are targeting the S protein and the S1 RBD, the time of turnaround is 60 and 120 min, with sensitivity of 98.3% and 94.4% and specificity of 98.1% and 99.6% for Calbiotech and EUROIMMUN, respectively,[Citation11,Citation17] showed binding antibodies against S-RBD of 76% but of 86% to the N-protein upon using the same sera. Both N and S-RBD proteins were expressed in mammalian system. These data along with those obtained in this study and our previously published work[Citation15] suggest that viral antigens show heterogeneous IgG response.
In order to construct a lateral flow immunochromatographic strip to detect SARS-CoV-2 immunoglobulins, two types of strips were prepared and evaluated. The first type (LF-type 1) contains sample pad, one conjugate release pad, nitrocellulose membrane, absorption pad, and semirigid polyethylene sheet, while the second type (LF-type 2) contains, besides the components found in LF-type 1, an adjustment pad, a second conjugate release pad, and a self-adhesive polyethylene protective film.
Furthermore, the conjugation capacity for either N-protein or rabbit antibodies to gold nanoparticles was also assessed using two methods, the passive conjugation by electrostatic attraction and the direct conjugation after protein dialysis. The color of the three gold nano sizes prepared (20 ± 4 nm, 40 ± 4 nm, and 65 ± 4 nm) changed from red, bloody red, and dark bloody red to violet, blue, or a precipitate in colorless solution. This change occurred at four different pHs (7.5, 8.5, 9.5, and 10.5). These results indicate that the conjugation between AuNPs and the target protein was not successful. On the contrary, upon using the direct conjugation of proteins to the gold nanoparticles after dialysis, the color of the three gold nano sizes with pHs (7.5, 8.5, and 10.5) was gradually changed from red, bloody red, and dark bloody red of AuNPs to violet, blue, or blackish blue. Interestingly, no change in color was observed when using N-protein at pH 9.5 with the three sizes of AuNPs indicating an optimum pH and protein concentration for colloidal gold labeling. On the other hand, the conjugation of AuNPs with rabbit IgG was stable at pH 8.5. It is worth mentioning that ionic adsorption takes place during the direct conjugation with the antibodies, especially when the isoelectric point (pI) of the antibody is close to the metal (AuNPs). This leads to random orientation attachment of the antibodies and decrease in binding stability at different pHs. Therefore, 17-β-estradiol was used to enhance the orientation attachment of antibodies to utilize the minimum amount of antibodies.[Citation31]
However, the results of using LF-type 1 with N-Protein conjugated AuNPs (20 nm) showed 17 out of 30 with red lines at control (C) line zone and 13 out of 30 were invalid and showed absence of C red lines. Moreover, 16 out of 45 appeared positive for IgG, 4 out of 45 showed positive for both IgG and IgM, and 25 out of 45 appeared as invalid results. The use of AuNPs (40 nm) showed 6 out of 30 negative samples showed red lines at C line zone and 24 out of 30 were invalid with no C red lines. Eight out of 45 appeared positive IgG, 27 out of 45 appeared invalid results. Additionally, using of AuNPs (65nm) showed invalid results with all samples. Unfortunately, we could not calculate the sensitivity, specificity, positive predictive value (PPV), and negative predictive value (NPV) of LF using direct conjugation of N-protein without dialysis (Supplementary Table S2) compared with that obtained by ELISA which were 86%, 92%, 97.5%, and 64%, respectively.
We may attribute the previously described results of using LF-type 1 to several factors. First, the direct effect of the treatment solution that labels the conjugate pad and its flow rate, leading to a decreased flow rate of the conjugate solution. Therefore, we proceeded to build a new pad of separation that will carry the treatment solution, thus reducing the effects on the conjugate solution. This new pad is the adjustment pad that was introduced in LF-type 2. Secondly, the stability and affinity of an antibody conjugation to its corresponding antigen, on the same conjugation pad, are critical points to be achieved in such assays. The optimal binding between antibodies and antigens in our assay using the LF-type 1 may be interrupted due to different pHs of both molecules. Therefore, we added two conjugate pads in the LF-type 2 instead of one. The first pad is the conjugate pad “A” and the second pad is the conjugate pad “B” for Ag and Ab, respectively. Lastly, we have observed the presence of loose adhesion between the overlapped pads and membranes that were not correctly pressed during the manual construction of the strip. This defect led to misdirection and an incomplete flow of the conjugate solutions during the application of the test experiment. Consequently, we added a self-adhesive polyethylene tape to act as protective films which in turn will enforce the right directed flow of conjugate solutions.
Li et al.[Citation32] have developed an immunoassay using the lateral flow strips to detect both immunoglobulins IgM and IgG against the RBD of the spike protein of SARS-CoV-2. They reported a sensitivity and specificity of 88.66% and 90.63%, respectively. They proposed that a combined assay detecting both IgG and IgM is more sensitive compared to single tests.
In our study, the comparison of the different parameters of sensitivity, specificity, PPV, and NPV between both in-house tests ELISA and LFA showed improvement in both sensitivity and NPV indices by 11% and 27.5%, respectively. Similar results were obtained by Hoste et al.[Citation33] They used a recombinant nucleocapsid protein produced in E. coli and tested 1065 sera samples comparing between ELISA and lateral flow assays. They showed values of sensitivity between 91.2% and 100%, and specificity of 100% and 98.2% for LFA and ELISA, respectively.[Citation33] On the other hand, Russo et al.[Citation34] showed LFA specificity of 89.8% upon using the Xiamen Wiz Biotech (Xiamen, China) LFA Diagnostic Kit (Colloidal Gold) and WANTAI SARS-CoV-2 Ab ELISA (based on receptor-binding domain detection) (Xiamen, China), to compare both tests and ELISA showed 100% specificity with all 196 sera samples used. The specificity and sensitivity of available commercial LFA in the market and reviewed in the literature[Citation11] are shown in Supplementary Table S3, and the product represented in this work is referred by NRC-STDF43703.
Conclusion
The pandemic caused by SARS-CoV-2 which continued for more than 2 years was a marked tragedy in human history. The virus produced several variants that showed major public concerns. These variants differentiated in the spike region and mainly in the receptor-binding domain. Of the most stable proteins in the viral particle is the nucleocapsid that may present the most suitable antigen to detect these viral variants. Successfully, in this work, we developed and compared protocols for two in-house immunoassays based on the expression of the nucleocapsid protein in E. coli. More importantly, the viral detection tool based on the nanomaterial technology has shown significant improvement in sensitivity, costs, and test duration. This work describes in detail the manufacturing trajectory of lateral flow strips to be applied in immunoassays.
Ethical approval
All the steps were approved by the Ethical Review Board of the National Research Centre, Egypt (NRC#20192) according to Helsinki Declaration (1975).
Supplemental Material
Download Zip (106 KB)Disclosure statement
The authors declare that they have no known competing financial interests or personal relationships that could have appeared to influence the work reported in this paper.
Data availability statement
The data used to support the findings of this study are included within the article.
Supplementary Material
Supplemental data for this article can be accessed online at https://doi.org/10.1080/15321819.2023.2224865
Additional information
Funding
References
- Ren, L. L.; Wang, Y. M.; Wu, Z. Q.; Xiang, Z. C.; Guo, L.; Xu, T.; Jiang, Y. Z.; Xiong, Y.; Li, Y. J.; Li, X. W., et al. Identification of a Novel Coronavirus Causing Severe Pneumonia in Human: A Descriptive Study. Chin Med J (Engl). 2020, 133(9), 1015–1024. DOI: 10.1097/CM9.0000000000000722.
- Wu, A.; Peng, Y.; Huang, B.; Ding, X.; Wang, X.; Niu, P.; Meng, J.; Zhu, Z.; Zhang, Z.; Wang, J., et al. Genome Composition and Divergence of the Novel Coronavirus (2019-nCov) Originating in China. Cell Host Microbe. 2020, 27(3), 325–328. DOI: 10.1016/j.chom.2020.02.001.
- Zhu, N.; Zhang, D.; Wang, W.; Li, X.; Yang, B.; Song, J.; Zhao, X.; Huang, B.; Shi, W.; Lu, R., et al. A Novel Coronavirus from Patients with Pneumonia in China, 2019. N. Engl. J. Med. 2020, 382(8), 727–733. DOI: 10.1056/NEJMoa2001017.
- Wu, F.; Zhao, S.; Yu, B.; Chen, Y. M.; Wang, W.; Song, Z. G.; Hu, Y.; Tao, Z. W.; Tian, J. H.; Pei, Y. Y., et al. A New Coronavirus Associated with Human Respiratory Disease in China. Nature. 2020, 579(7798), 265–269. DOI: 10.1038/s41586-020-2008-3.
- de Wit, E.; van Doremalen, N.; Falzarano, D.; Munster, V. J. SARS and MERS: Recent Insights into Emerging Coronaviruses. Nat. Rev. Microbiol. 2016, 14(8), 523–534. DOI: 10.1038/nrmicro.2016.81.
- Amor, S.; Fernández Blanco, L.; Baker, D. Innate Immunity During SARS-CoV-2: Evasion Strategies and Activation Trigger Hypoxia and Vascular Damage. Clin. Exp. Immunol. 2020, 202(2), 193–209. DOI: 10.1111/cei.13523.
- Cheng, M. P.; Yansouni, C. P.; Basta, N. E.; Desjardins, M.; Kanjilal, S.; Paquette, K.; Caya, C.; Semret, M.; Quach, C.; Libman, M., et al. Serodiagnostics for Severe Acute Respiratory Syndrome-Related Coronavirus 2: A Narrative Review. Ann. Intern. Med. 2020, 173(6), 450–460. DOI: 10.7326/M20-2854.
- Huang, C.; Wang, Y.; Li, X.; Ren, L.; Zhao, J.; Hu, Y.; Zhang, L.; Fan, G.; Xu, J.; Gu, X., et al. Clinical Features of Patients Infected with 2019 Novel Coronavirus in Wuhan, China. Lancet. 2020, 395(10223), 497–506. DOI: 10.1016/S0140-6736(20)30183-5.
- Machhi, J.; Herskovitz, J.; Senan, A. M.; Dutta, D.; Nath, B.; Oleynikov, M. D.; Blomberg, W. R.; Meigs, D. D.; Hasan, M.; Patel, M., et al. The Natural History, Pathobiology, and Clinical Manifestations of SARS-CoV-2 Infections. J. Neuroimmune Pharmacol. 2020, 15(3), 359–386. DOI: 10.1007/s11481-020-09944-5.
- Vitiello, A.; La Porta, R.; D’Aiuto, V.; Ferrara, F. The Risks of Liver Injury in COVID-19 Patients and Pharmacological Management to Reduce or Prevent the Damage Induced. Egypt Liver J. 2021, 11(1), 11. DOI: 10.1186/s43066-021-00082-y.
- Alpdagtas, S.; Ilhan, E.; Uysal, E.; Sengor, M.; Ustundag, C. B.; Gunduz, O. Evaluation of Current Diagnostic Methods for COVID-19. APL Bioeng. 2020, 4(4), 041506. DOI: 10.1063/5.0021554.
- Tabll, A. A.; Shahein, Y. E.; Omran, M. M.; Elnakib, M. M.; Ragheb, A. A.; Amer, K. E. A Review of Monoclonal Antibodies in COVID-19: Role in Immunotherapy, Vaccine Development and Viral Detection. Hum Antibodies. 2021, 29(3), 179–191. DOI: 10.3233/HAB-200441.
- Asselah, T.; Durantel, D.; Pasmant, E.; Lau, G.; Schinazi, R. F. COVID-19: Discovery, Diagnostics and Drug Development. J. Hepatol. 2021, 74(1), 168–184. DOI: 10.1016/j.jhep.2020.09.031.
- Woloshin, S.; Patel, N.; Kesselheim, A. S. False Negative Tests for SARS-CoV-2 Infection - Challenges and Implications. N. Engl. J. Med. 2020, 383(6), e38. DOI: 10.1056/NEJMp2015897.
- Hussein, N. A.; Ali, E. A. A.; El-Hakim, A. E.; Tabll, A. A.; El-Shershaby, A.; Salamony, A.; Shaheen, M. N. F.; Ali, I.; Elshall, M.; Shahein, Y. E. Assessment of Specific Human Antibodies Against SARS-CoV-2 Receptor Binding Domain by Rapid In-House ELISA. Hum Antibodies. 2022, 30(2), 105–115. DOI: 10.3233/HAB-220003.
- Li, G.; Li, W.; Fang, X.; Song, X.; Teng, S.; Ren, Z.; Hu, D.; Zhou, S.; Wu, G.; Li, K. Expression and Purification of Recombinant SARS-CoV-2 Nucleocapsid Protein in Inclusion Bodies and Its Application in Serological Detection. Protein Expr. Purif. 2021, 186, 105908. DOI: 10.1016/j.pep.2021.105908.
- McAndrews, K. M.; Dowlatshahi, D. P.; Dai, J.; Becker, L. M.; Hensel, J.; Snowden, L. M.; Leveille, J. M.; Brunner, M. R.; Holden, K. W.; Hopkins, N. S., et al. Heterogeneous Antibodies Against SARS-CoV-2 Spike Receptor Binding Domain and Nucleocapsid with Implications for COVID-19 Immunity. JCI Insight. 2020, 5(18). DOI: 10.1172/jci.insight.142386.
- Peeling, R. W.; Wedderburn, C. J.; Garcia, P. J.; Boeras, D.; Fongwen, N.; Nkengasong, J.; Sall, A.; Tanuri, A.; Heymann, D. L. Serology Testing in the COVID-19 Pandemic Response. Lancet Infect. Dis. 2020, 20(9), e245–e249. DOI: 10.1016/S1473-3099(20)30517-X.
- Bai, Z.; Cao, Y.; Liu, W.; Li, J. The SARS-CoV-2 Nucleocapsid Protein and Its Role in Viral Structure, Biological Functions, and a Potential Target for Drug or Vaccine Mitigation. Viruses. 2021, 13(6), 1115. DOI: 10.3390/v13061115.
- Mu, J.; Xu, J.; Zhang, L.; Shu, T.; Wu, D.; Huang, M.; Ren, Y.; Li, X.; Geng, Q.; Xu, Y., et al. SARS-CoV-2-Encoded Nucleocapsid Protein Acts as a Viral Suppressor of RNA Interference in Cells. Sci. China Life Sci. 2020, 63(9), 1413–1416. DOI: 10.1007/s11427-020-1692-1.
- Hussein, N. A.; Shahein, Y. E.; El-Hakim, A. E.; Abouelella, A. M.; Guneidy, R. A.; Hamed, R. R. Molecular Cloning of Ra-Shspi, a Novel Member of the HSP20 Family from Rhipicephalus Annulatus Salivary Glands. Int. J. Biol. Macromol. 2014, 67, 7–15. DOI: 10.1016/j.ijbiomac.2014.02.057.
- Aly, I.; Taher, E. E.; El Nain, G.; El Sayed, H.; Mohammed, F. A.; Hamad, R. S.; Bayoumy, E. M. Advantages of Bioconjugated Silica-Coated Nanoparticles as an Innovative Diagnosis for Human Toxoplasmosis. Acta Trop. 2018, 177, 19–24. DOI: 10.1016/j.actatropica.2017.09.024.
- GeurtsvanKessel, C. H.; Okba, N. M. A.; Igloi, Z.; Bogers, S.; Embregts, C. W. E.; Laksono, B. M.; Leijten, L.; Rokx, C.; Rijnders, B.; Rahamat-Langendoen, J., et al. An Evaluation of COVID-19 Serological Assays Informs Future Diagnostics and Exposure Assessment. Nat. Commun. 2020, 11(1), 3436. DOI: 10.1038/s41467-020-17317-y.
- Okba, N. M. A.; Müller, M. A.; Li, W.; Wang, C.; GeurtsvanKessel, C. H.; Corman, V. M.; Lamers, M. M.; Sikkema, R. S.; de Bruin, E.; Chandler, F. D., et al. Severe Acute Respiratory Syndrome Coronavirus 2-Specific Antibody Responses in Coronavirus Disease Patients. Emerg. Infect. Dis. 2020, 26(7), 1478–1488. DOI: 10.3201/eid2607.200841.
- Qu, J.; Wu, C.; Li, X.; Zhang, G.; Jiang, Z.; Li, X.; Zhu, Q.; Liu, L. Profile of Immunoglobulin G and IgM Antibodies Against Severe Acute Respiratory Syndrome Coronavirus 2 (SARS-CoV-2). Clin. Infect. Dis. 2020, 71(16), 2255–2258. DOI: 10.1093/cid/ciaa489.
- Sun, B.; Feng, Y.; Mo, X.; Zheng, P.; Wang, Q.; Li, P.; Peng, P.; Liu, X.; Chen, Z.; Huang, H., et al. Kinetics of SARS-CoV-2 Specific IgM and IgG Responses in COVID-19 Patients. Emerg Microbes Infect. 2020, 9(1), 940–948. DOI: 10.1080/22221751.2020.1762515.
- Djukic, T.; Mladenovic, M.; Stanic-Vucinic, D.; Radosavljevic, J.; Smiljanic, K.; Sabljic, L.; Devic, M.; Cujic, D.; Vasovic, T.; Simovic, A., et al. Expression, Purification and Immunological Characterization of Recombinant Nucleocapsid Protein Fragment from SARS-CoV-2. Virology. 2021, 557, 15–22. DOI: 10.1016/j.virol.2021.01.004.
- Kang, S.; Yang, M.; Hong, Z.; Zhang, L.; Huang, Z.; Chen, X.; He, S.; Zhou, Z.; Zhou, Z.; Chen, Q., et al. Crystal Structure of SARS-CoV-2 Nucleocapsid Protein RNA Binding Domain Reveals Potential Unique Drug Targeting Sites. Acta Pharm. Sin. B. 2020, 10(7), 1228–1238. DOI: 10.1016/j.apsb.2020.04.009.
- Ye, Q.; West, A. M. V.; Silletti, S.; Corbett, K. D. Architecture and Self-Assembly of the SARS-CoV-2 Nucleocapsid Protein. Protein sci. 2020, 29(9), 1890–1901. DOI: 10.1002/pro.3909.
- Zeng, W.; Liu, G.; Ma, H.; Zhao, D.; Yang, Y.; Liu, M.; Mohammed, A.; Zhao, C.; Yang, Y.; Xie, J., et al. Biochemical Characterization of SARS-CoV-2 Nucleocapsid Protein. Biochem. Biophys. Res. Commun. 2020, 527(3), 618–623. DOI: 10.1016/j.bbrc.2020.04.136.
- Oliveira, J. P.; Prado, A. R.; Keijok, W. J.; Antunes, P. W. P.; Yapuchura, E. R.; Guimarães, M. C. C. Impact of Conjugation Strategies for Targeting of Antibodies in Gold Nanoparticles for Ultrasensitive Detection of 17β-Estradiol. Sci. Rep. 2019, 9(1), 13859. DOI: 10.1038/s41598-019-50424-5.
- Li, Z.; Yi, Y.; Luo, X.; Xiong, N.; Liu, Y.; Li, S.; Sun, R.; Wang, Y.; Hu, B.; Chen, W., et al. Development and Clinical Application of a Rapid IgM-Igg Combined Antibody Test for SARS-CoV-2 Infection Diagnosis. J. Med. Virol. 2020, 92(9), 1518–1524. DOI: 10.1002/jmv.25727.
- Hoste, A. C. R.; Venteo, A.; Fresco-Taboada, A.; Tapia, I.; Monedero, A.; López, L.; Jebbink, M. F.; Pérez-Ramírez, E.; Jimenez-Clavero, M. A.; Almonacid, M., et al. Two Serological Approaches for Detection of Antibodies to SARS-CoV-2 in Different Scenarios: A Screening Tool and a Point-Of-Care Test. Diagn. Microbiol. Infect. Dis. 2020, 98(4), 115167. DOI: 10.1016/j.diagmicrobio.2020.115167.
- Russo, A.; Minichini, C.; Starace, M.; Astorri, R.; Calò, F.; Coppola, N. Current Status of Laboratory Diagnosis for COVID-19: A Narrative Review. Infect Drug Resist. 2020, 13, 2657–2665. DOI: 10.2147/IDR.S264020.