
 ?Mathematical formulae have been encoded as MathML and are displayed in this HTML version using MathJax in order to improve their display. Uncheck the box to turn MathJax off. This feature requires Javascript. Click on a formula to zoom.
Abstract
The conditional expectation and conditional variance of Brownian motion, B(t), is considered given B(t = 1), its maximum and its argmax, as well as those with less information:
where the close is the final value:
and
We compute the expectation and variance of a Brownian meander in time. By splicing together two Brownian meanders, the mean and variance of the constrained process are calculated. Analytic expressions are given for
and
as well as the analogous expression for the conditional variance. Computational results displaying both the expectation and variance in time are presented. Comparison of the simulation with theoretical values are shown when the close and argmax are given. We show that using the values of
and
as well as the final value, c, significantly reduces the variance of the process compared to the variance of the Brownian bridge.
1. Introduction
The study of Brownian extrema dates back to Lèvy[Citation14]. We give a brief overview of the results following Devroye[Citation7] with additional results taken from Durrett et al.[Citation8], Durrett and Iglehart[Citation9], Shepp[Citation19], and Imhof[Citation11]. Our research focuses on distribution of B(t) on given argmax of B(t) and one or more of the maximum and the final value,
For each Brownian path on
we denote the maximal value of B(t) by h, denoting the “high.” We denote the minimal value, the “low,” by
The location of the first time when the B(t) reaches h will be denoted by θ (and occasionally by argmax). The location of the first time when the B(t) reaches
will be denoted by
We are interested in the density of Brownian paths conditional on
Unfortunately, this five dimensional parameterization is too complex for us to evaluate. Instead, we settle for evaluating the conditional density,
as well as
and
The distribution,
is well known[Citation6,Citation20], and has a representation in terms of two Brownian meanders[Citation3,Citation8–11]. We do give a more explicit representation of this density in Corollary 4.2. Our companion article[Citation17] examines on
and
To better understand the conditional probability, we calculate the first and second moments of the probability conditional with respect to x. We evaluate the distribution, mean and variance of and
Our companion article of Riedel[Citation17] examines on
and
For our results, we view the maximum value, the final value and the location of the maximum, θ, as statistics on the Brownian motion. In other words, given values of
we can estimate the properties of a realization of Brownian motion by plugging in the values of these statistics into the density and its first and second moments. The calculation of the moments of
is new, as is the evaluation of
and
and their moments.
By computing the moments, and
we show how the values of (close, high, low, argmax) determine the behavior of B(t) over the entirety of the region,
Both the analytic formulae of the conditional expectation and variance as well as the figures in this paper build intuition about Brownian paths.
Section 2 reviews the distribution of Brownian motion extrema. Section 3 reviews the Brownian meander and calculates its expectation and variance in Theorem 3.3. Section 4 elaborates on Williams’s construction[Citation6,Citation20,Citation21] of conditional Brownian motion as the splicing together of two Brownian meanders. Theorem 4.3 gives analytic expressions for the expectation and variance of the conditional density, and
Section 5 calculates the density (Theorem 5.1) and moments,
and
of
We compare the analytic moments with our simulation. Section 7 and Appendix B describe our simulation framework and compares the simulation with our analytic expressions for the conditional mean and variance. Section 6 presents our analytic
including expressions for
and
It compares our analytic moments with those of the simulation. We conclude by comparing the time averaged expected variance given one or more of
2. Distributions of Brownian extrema
The study of Brownian extrema dates back to the founders of the field[Citation14]. Our brief discussion follows Devroye[Citation7] with additional results taken from Borodin and Salminen[Citation4], Durrett[Citation8], Durrett and Iglehart[Citation9], Imhof[Citation11], and Shepp[Citation19]. To our knowledge, there is no known expression for There are expressions for
p(c, h),
as well as p(c), p(h) and
In Karatzas and Shreve[Citation13] and Shepp[Citation19], the joint density of the close, the high,
the location of the high,
is shown to be:
(2.1)
(2.1)
Conditional density of θ and h given B(1) is
(2.2)
(2.2)
The unconditional density of θ and h is obtained by integrating Equation(2.1)(2.1)
(2.1) on c < h[Citation1,Citation7,Citation19]:
(2.3)
(2.3)
The conditional density of h given θ[Citation19] is
(2.4)
(2.4)
Thus The classic result[Citation12,Citation14] derived using the reflection principle is the joint distribution of the close, c, the high, h is
(2.5)
(2.5)
where we denote the Gaussian density by
This result has been generalized to other diffusions in Pitman and Yor[Citation16]. The marginal density of the maximum, h, and B(1):
(2.6)
(2.6)
[Citation12,Citation14]. This can be derived by differentiating Equation(2.6)(2.6)
(2.6) or by integrating Equation(2.1)
(2.1)
(2.1) over θ.
Let Hc be the random variable conditional on
The density of Hc,
can be computed using Devroye[Citation7] and McLeish[Citation15]:
(2.7)
(2.7)
where E is a standard exponentially distributed random variable and
means equality in distribution. The marginal density of h is the half normal:
(2.8)
(2.8)
The marginal density of the location, θ, of the maximum of B(t) is the well-known arcsine distribution, Using (Citation2.Citation1), one can generate the joint distribution of
[Citation7] as
(2.9)
(2.9)
An immediate consequence of Equation(2.9)(2.9)
(2.9) is that the variance of B(1) given θ, the time of the maximum of B(t), is independent of θ and satisfies:
(2.10)
(2.10)
Here E, U are independent random variables where E and
are standard exponentially distributed and U is uniformly distributed in
We are unaware of any previous derivation of this straightforward result. We actually discovered it during our simulation. We now evaluate
For c > 0:
(2.11)
(2.11)
(2.12)
(2.12)
Here is the complimentary error function,
For
the same integral over h runs from 0 to
(2.13)
(2.13)
This result corresponds to the conditional density in Alabert and Caballero[Citation1].
A result that goes back to Lèvy[Citation5,Citation14], if not earlier, is
Theorem 2.1.
The joint distribution of the close, c, the high, h, and the low, is
(2.14)
(2.14)
(2.15)
(2.15)
where
Although Equation(2.14)(2.14)
(2.14) is classic, Equation(2.15)
(2.15)
(2.15) seems to be new. By refactoring Equation(2.14)
(2.14)
(2.14) into the symmetric form, Equation(2.15)
(2.15)
(2.15) , we not only treat h and
symmetrically, but also show that the series is in an alternating form. Here
is a distribution in
and a density in c. The density,
may be found in Riedel[Citation17].
3. Brownian meander and its moments
A Brownian meander, can be thought of as a Brownian motion restricted to those paths where
Since this is a set of paths with measure zero, we rescale the Brownian paths to get a Brownian meander. Following Belkin[Citation2] and Durrett[Citation8], let B(t) be a Brownian motion,
we define the Brownian meander as
By
we denote the Brownian meander restricted to
Results for the distribution of meanders can be found in Biane[Citation3], Durrett[Citation8], Durrett and Iglehart[Citation9], Imhof[Citation10], and Imhof[Citation11]. Brownian meanders at a fixed time, t, are distributed as Devroye[Citation7] and Imhof[Citation10]:
(3.1)
(3.1)
where N is a standard normal variable, E is a standard exponentially distributed random variable, and N and E are independent. EquationEquation (3.1)
(3.1)
(3.1) applies for a single fixed time and not for the process,
for all
We are more interested in the transition density of the meander. Following Durrett et al.[Citation8], let
then
Theorem 3.1
[Citation8,Citation10]. Bme has transition density: for
, y > 0. For
(3.2)
(3.2)
(3.3)
(3.3)
is the Rayleigh distribution.
In Equation(3.2)(3.2)
(3.2) , we slightly abuse notation: The probability that
is infinitesimally small and is a density in x:
With this understanding, we will continue to write the conditional densities without dx. The Bayesian Rule gives the conditional density given the final value of a Brownian meander:
Corollary 3.2
[Citation7]. For , Bme has density:
(3.4)
(3.4)
where
For t = 1, Equation(3.4)
(3.4)
(3.4) can be rewritten as
Equivalent formulae to Equation(3.4)(3.4)
(3.4) are found in Devroye[Citation7]. In Appendix A, we calculate the expectation and variance of the Brownian meander using this transition density:
Theorem 3.3.
For the Brownian meander, , the first and second moments are
(3.5)
(3.5)
(3.6)
(3.6)
(3.7)
(3.7)
Proof:
These formulae are derived in Appendix A using the transition density Equation(3.4)(3.4)
(3.4) .
Theorem 3.3 is new and is the basis for the moment calculations in the remainder of the article. If t = 1, we often suppress the third argument: The variance of the meander satisfies:
Thus, Vr(s, c) is the variance of a Brownian meander when the end time, t = 1 with final value c.
4. Spliced Brownian meander representation and its moments
Following Williams[Citation6,Citation7,Citation20,Citation21], we represent a Brownian motion on given the location, θ, its maximum, h and its final value c. We represent B(t) in
in terms of a meander
Theorem 4.1.
Consider a Brownian motion conditional on , θ is the smallest s such that
and
. For a fixed time t,
is distributed as a scaled Brownian meander to the left of θ and a second scaled Brownian meander to the right of θ.
(4.1)
(4.1)
Here is the meander process with
and
. Similarly for
, define
(4.2)
(4.2)
and
is an independent Brownian meander.
The formal proof may be found in Denisov[Citation6], Williams[Citation20], and Williams[Citation21]. The result is easy to understand: A Brownian meander, is equivalent to a Brownian bridge restricted to non-negative paths. On either side of the first maximum, θ, the Brownian paths are restricted to not go above the maximum. Thus on either side of θ, we subtract off the appropriately scaled Brownian meander.
A rigorous notation would replace with
Theorem 4.1 is well known and sometimes called the Williams representation. We need a more explicit representation to calculate the moments. We now derive it using the meander density representation of the previous situation. We believe the following corollary is more explicit than previous analyses.
Corollary 4.2.
Under the assumptions of Theorem 4.1, the conditional density of a Brownian motion at a fixed time, t, satisfies
(4.3)
(4.3)
For
(4.4)
(4.4)
For the joint density satisfies
(4.5)
(4.5)
where
For
the joint density is
(4.6)
(4.6)
Proof.
To prove Equation(4.3)(4.3)
(4.3) and Equation(4.4)
(4.4)
(4.4) , we insert the transition density of Equation(3.4)
(3.4)
(3.4) into the results of Theorem 4.1. To prove Equation(4.5)
(4.5)
(4.5) , we multiply Equation(4.3)
(4.3)
(4.3) by
from Equation(2.1)
(2.1)
(2.1) . To prove Equation(4.6)
(4.6)
(4.6) , we multiply Equation(4.4)
(4.4)
(4.4) by
□
Using Equation(4.1)(4.1)
(4.1) and Equation(3.7)
(3.7)
(3.7) , we calculate the moments of the conditional Brownian motion:
Theorem 4.3.
Under the assumptions of Theorem 4.1, the expectation of a Brownian motion satisfies
(4.7)
(4.7)
(4.8)
(4.8)
for
For
the expectation satisfies:
(4.9)
(4.9)
For
Thus the variance satisfies
(4.10)
(4.10)
(4.11)
(4.11)
where
Proof.
In the representations, Equation(4.1)(4.1)
(4.1) and Equation(4.2)
(4.2)
(4.2) , the conditional density of the Brownian motion (on either side of the
θ), is a linear transformation of the Brownian meander density. Thus the moments of the conditional density, Equation(4.4)
(4.4)
(4.4) and Equation(4.3)
(4.3)
(4.3) , are linear transformations of the Brownian meander moments given in Theorem 3.3. The representations in Equation(4.7)
(4.7)
(4.7) –Equation(4.11)
(4.11)
(4.11) follow by substituting the appropriate transformations of the Brownian meander moments into Equation(4.1)
(4.1)
(4.1) –Equation(4.2)
(4.2)
(4.2) .
5. Moments given high and its location
To calculate the expectation of B(t) given only its maximum and the first location of its maximum, we integrate the expressions in Equation(4.3)(4.3)
(4.3) and Equation(4.4)
(4.4)
(4.4) over the correct conditional probability density given by Equation(2.1)
(2.1)
(2.1) and Equation(2.3)
(2.3)
(2.3) :
(5.1)
(5.1)
Theorem 5.1.
The conditional density, satisfies
(5.2)
(5.2)
for
Here
For
the conditional density is
(5.3)
(5.3)
Proof.
We integrate Equation(4.5)(4.5)
(4.5) and Equation(4.6)
(4.6)
(4.6) with respect to the close, c and then divide by
as given by Equation(2.3)
(4.5)
(4.5) . We use
□
To calculate the expectation of B(t) given only its maximum and the first location of its maximum, we need only integrate the expressions in Equation(3.5)(3.5)
(3.5) –Equation(4.9)
(4.9)
(4.9) over the same conditional probability density:
(5.4)
(5.4)
where
is given by Equation(2.1)
(3.5)
(3.5) and
is given by Equation(2.3)
(2.3)
(2.3) . Thus
We change variables from c to
and apply (Citation9.Citation13)–(Citation9.Citation15) from Appendix A.
Theorem 5.2.
For , the expectation becomes
(5.5)
(5.5)
where
and
is defined as
(5.6)
(5.6)
Thus is independent of h for
. For
is independent of c and satisfies
as given by (Citation4.Citation7)–(Citation4.Citation8). For
, the variance is independent of the close and is given by (Citation4.Citation10):
(5.7)
(5.7)
For , the variance of
(5.8)
(5.8)
Proof.
The proof of (Citation5.Citation5) is in (Citation9.Citation13)–(Citation9.Citation15). The variance of is calculated by the ensemble average of
and subtracting
For
is also independent of c. This proves (Citation5.Citation7). For
(5.9)
(5.9)
(5.10)
(5.10)
To evaluate (Citation5.Citation10), we insert (Citation9.Citation16) and (Citation5.Citation5) into (Citation5.Citation10). □
By ignoring the c dependence in the variance increases by
One can think of this as an Analysis of Variance term. The increase occurs because the final value, c, is now a random variable.
Similar but more complicated moment calculations are possible for the case of the previous section where are given and one integrates over h. In Riedel[Citation17], analytic expressions for
and
are given. It may be possible to rederive these results by integrating
This integration appears to be untractable.
6. Mean and variance given only argmax
Now consider To compute the mean and variance of
we integrate (Citation5.Citation4)–(Citation5.Citation5) with respect to
where
is given by (Citation2.Citation4):
Theorem 6.1.
For
(6.1)
(6.1)
(6.2)
(6.2)
where
and G11 is given in (Citation5.Citation6). For
the expectation becomes
(6.3)
(6.3)
where
For the variance, we first evaluate and then subtract off
(6.4)
(6.4)
For , the variance simplifies:
(6.5)
(6.5)
where
Proof.
We use the integrals in (Citation9.Citation13)–(Citation9.Citation15) of the Appendix A and set To prove (Citation6.Citation4), note
(6.6)
(6.6)
and insert the expression in (Citation9.Citation17)–(Citation9.Citation18).
Our expression matches the zero dimensional results derived in the second section,
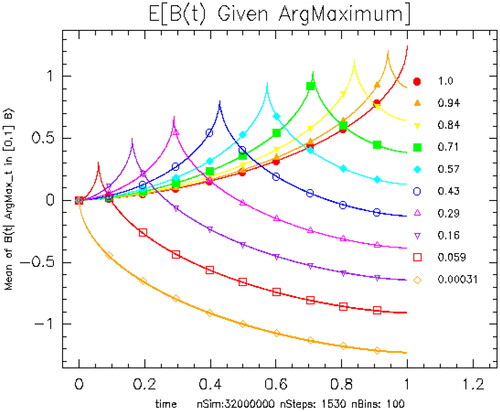
Let plots
for ten quantile values of the bins in θ ranging from the second smallest bin to the second largest bin. Unsurprisingly, the
is maximized at
for fixed θ. The curves look monotone for θ very near 0 or 1, but this is a graph and simulation resolution effect. Even at nbins = 160, there is still a small amount of artificial broadening of the peak due to averaging
over the bin. Using the density (Citation2.Citation6), we calculate
Figure 1. Expectation of B(t) given for various values of θ. Each color has two curves, a theoretical curve from Theorem 6.1 and the mean value of the simulation for the given parameter bin. To compute the simulation expectation, we use an ensemble of 32,000,000 realizations computed with 1500 steps and bin the results into 100 bins in θ space. The values of θ for each curve are given in the legend.
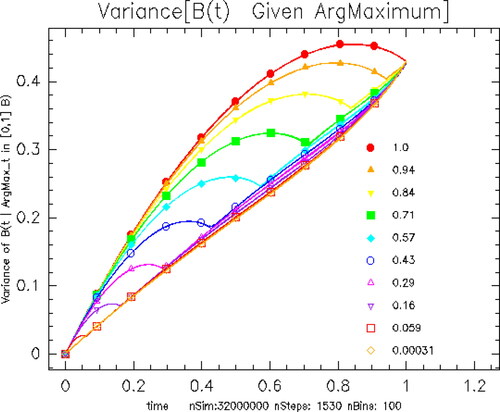
plots the variance, For small values of θ,
grows linearly for most time, then it accelerates as θ approaches 1. For larger values of θ, it appears that
is nearly a constant for t near zero. The growth rate decelerates in time and this deceleration occurs earlier for smaller θ. From (Citation2.Citation10),
Figure 2. Variance of B(t) given for various values of θ. When θ is small, the variance grows roughly linearly in time. For larger values of θ, the variance grows faster initially and then converges to the linear value.
7. Overview of simulation results
We generate a large number of Brownian paths, bin the paths in space and calculate the mean and variance for each time and bin. We order the coordinates of phase space,
so that
and
To see
and
we simulate 10 to 36 million Brownian motions. A detailed description of the simulation method may be found in Appendix B and Riedel[Citation17]. We display simulations using 1500-1850 time steps for each realization.
For each bin, we compute the expectation and variance using (Citation4.Citation7)–(Citation4.Citation11). In Riedel[Citation18], we present a number of figures displaying and explaining the behavior of and
as
vary. We omit these here for space reasons.
We evaluate the discrepancy/mean square error (MSE) between the theoretical formulae and our simulations. For each bin in parameter space, we compare the difference between (Citation4.Citation7) and the average of the curves in the bin. We then compute the mean squared error averaged over time:
(7.1)
(7.1)
where
is the j curve in the bin and Avgj is the average over all of the paths in the given bin in parameter space. We then sort the bins from worst to best MSE. Not surprisingly the worst fitting bins often occur where the bins are the largest and the bias error, from having curves with slightly different parameters, is the largest.
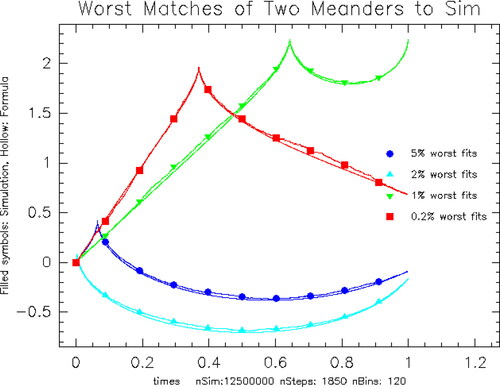
Overall, the concatenated meander expectation fits the simulation expectation very well. To further illustrate this, we overlay all four sets of curves on the same plot. plots the curves that correspond to the worst 5%, 2%, 1%, and 0.2% difference between the simulation conditional mean and (Citation4.Citation7)–(Citation4.Citation9). There are million bins to compare. The curves overstruck by symbols are the simulation curves. The analytic formula curves have the same color but no symbol.
Figure 3. Comparison of Formula and Simulation: Each color has two curves, a theoretical curve from Theorem 4.3 and the mean value of the simulation for the given parameter bin. The curves overstruck by symbols are the simulation curves. The analytic formula curves have the same color but no symbol. Blue: 5% worst MSE Mean: 0.00039 at close: −0.0891, high: 0.431, argmax: 0.065. Cyan: 2% worst MSE Mean: 0.000507 at close: −0.166, high: 0.101, argmax: 0.00374. Green: 1% worst MSE Mean: 0.000608 at close: 2.246, high: 2.27, argmax: 0.643. Red: 0.2% worst MSE Mean: 0.00091 at close: 0.682, high: 1.991, argmax: 0.37.
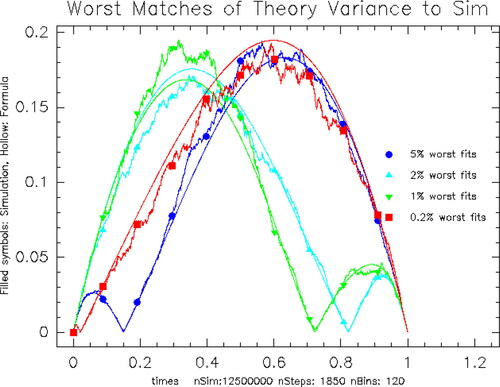
We conclude with a comparison of the variance of the simulation with the concatenated meander in (Citation4.Citation10)–(Citation4.Citation11). plots the curves that correspond to the worst 5%, 2%, 1%, and 0.2% difference between the simulation conditional variance and (Citation4.Citation10)–(Citation4.Citation11). In Riedel[Citation18], we display the analogous plots for As expected, averaging over values of c reduces the noise in the simulations and reduces the discrepancy.
Figure 4. Comparison of Meander Variance Formula and Simulation: Each color has two curves, a theoretical variance and the variance of the simulation for the given parameter bin. The symbols are on the curve from the simulation. Blue: 5% worst MSE Var: 0.000054 at close: −1.743, high: 0.55, argmax: 0.15. Cyan: 2% worst MSE Var: 0.0000775 at close: 1.246, high: 2.177, argmax: 0.822. Green: 1% worst MSE Var: 0.0000981 at close: 2.531, high: 3.164, argmax: 0.723. Red: 0.2% worst MSE Var: 0.000159 at close: −1.437, high: 0.461, argmax: 0.0208.
8. Summary
We have investigated the distribution, expectation and variance of Brownian motion conditional on the values of its maximum and its location as well as its final value. We give formulae for the mean and variance of a Brownian meander. Using the Williams construction, we evaluate the expectation and variance, and
To analyze
and
we integrate the distribution and moments with respect to the close, c, and then with respect to the maximum, h. Similar but more complex formulae can be calculated for
Our simulations show good agreements with the analytic expressions. Many interesting features are displayed in the figures of the mean and variance. displays the ensemble average of the variance of
For example,
(8.1)
(8.1)
Figure 5. Comparison of versus
versus
These curves are the ensemble average over all of the simulations.
![Figure 5. Comparison of Var[B(t|close)],Var[B(t|close)], versus Var[B(t|close,argmax)] versus Var[B(t|close,argmax,high)]. These curves are the ensemble average over all of the simulations.](/cms/asset/c080560d-0660-4f42-ae86-c8d783c4057f/lstm_a_1962724_f0005_c.jpg)
We compare the ensemble averages of with
and
In all case, we compute the variance for each value of the givens separately and then average over the distribution of the givens. From , we see that
is a much less valuable statistic than either the close or max. The statistics,
are more valuable than the pair of statistics
If the final value (close) is known, the variance is symmetric in time. Otherwise, the variance increases in time.
We conclude by merging our results with those in Riedel[Citation17]. To measure how accurately we can estimate we consider the time integral of the conditional variance averaged over the given variables:
If only the final value, c, is specified, the value of the integral is 1/6. presents the corresponding values for our simulations in this paper. This shows that the statistics triple (Close, High, Low) is more valuable than the triple (Close, High, ArgMax). In all cases, adding addition information such as the value of the high and/or its location significantly reduces the time averaged variance in comparison with that of the Brownian bridge (i.e. only using the final value of
).
Table 1. Expected time average variance reduction. We multiply the variance by 6 in the third column to compare with knowing only the final value, c.
In our sister article[Citation17], we show using the high, low and close substantially improves the estimation of the log return of the SP500 over using just the close. We can reproduce this calculation/application in this article, but it will be artificial. The reason is that the location of the maximum is seldom if ever used to parameterize a stochastic process. In contrast, chartist analysis in finance heavily uses the values of the high and low. Note that shows that using the value of the maximum is better than using the value of arg maximum.
Acknowledgments
The author thanks his referees for their helpful remarks.
References
- Alabert, A.; Caballero, R. On the minimum of a conditioned Brownian bridge. Stoch. Models 2018, 34, 269–291. DOI: https://doi.org/10.1080/15326349.2018.1465435.
- Belkin, B. An invariance principle for the conditioned random walk attracted to a stable law. Z Wahrscheinlichkeitstheorie Verw. Gebiete 1972, 21, 45–64. DOI: https://doi.org/10.1007/BF00535106.
- Biane, P.; Le Gall, J. F.; Yor, M. Un Processus Qui Ressemble au Pont Brownien. Sèminaire de Probabilitès de Strasbourg; Springer-Verlag, Berlin Heidelberg New York, 1987.
- Borodin, A. N.; Salminen, P. Handbook of Brownian Motion: Facts and Formulae. Birkhäuser, Basel, 2002, MR-1477407.
- Choi, B.; Roh, J. On the trivariate joint distribution of Brownian motion and its maximum and minimum. Stat. Probab. Lett. 2013, 83, 1046–1053. DOI: https://doi.org/10.1016/j.spl.2012.12.015.
- Denisov, I. V. A random walk and a Wiener process near a maximum. Theory Probab. Appl. 1984, 28, 821–824. Math. Review MR-85f:60117. DOI: https://doi.org/10.1137/1128082.
- Devroye, L. On exact simulation algorithms for some distributions related to Brownian motion and Brownian meanders. Recent Develop. Appl. Probab. Stat. 2010, 1–35. Physica-Verlag HD.
- Durrett, R. T.; Iglehart, D. L.; Miller, D. R. Weak convergence to Brownian meander and Brownian excursion. Ann. Probab. 1977, 5, 117–129. MR-55:9300.
- Durrett, R. T.; Iglehart, D. L. Functionals of Brownian meander and Brownian excursion. Ann. Probab. 1977, 5, 130–135.
- Imhof, J. P. Density factorizations for Brownian Motion, meander and the three-dimensional bessel process, and applications. J. Appl. Probab. 1984, 21, 500–510. DOI: https://doi.org/10.1017/S0021900200028709.
- Imhof, J. P. On Brownian bridge and excursion. Studia Sci. Math. Hungar 1985, 20, 1–10. Math. Review MR-88h:60159.
- Itô, K.; McKean, H. Diffusion Processes and Their Sample Paths. Springer-Verlag, New York. 1965.
- Karatzas, I.; Shreve, S. E. Brownian Motion and Stochastic Calculus. 2nd ed., Springer, New York, 1998, ‘MR1121940.
- Lèvy, P. Processus Stochastiques et Mouvement Brownien. Gauthier-Villars, Paris, 1948 MR-0190953.
- McLeish, D. L. Highs and lows: some properties of the extremes of a diffusion and applications in finance. Can. J. Statistics 2002, 30, 243–267. DOI: https://doi.org/10.2307/3315950.
- Pitman, J.; Yor, M. Decomposition at the maximum for excursions and bridges of one-dimensional diffusions. Ito’s Stochastic Calculus and Probability Theory, N. Ikeda, S. Watanabe, M. Fukushima, and H. Kunita, editors, 293–310, Springer. Lecture Notes in Math. 851. 1996 MR-98f:60153.
- Riedel, K. S. The value of the high, low and close in the estimation of Brownian motion. Stat. Inference Stoch. Process. 2021, 24, 179–210. https://arxiv.org/abs/1911.05280. DOI: https://doi.org/10.1007/s11203-020-09229-x.
- Riedel, K. S. Mean and variance of Brownian motion with given final value, maximum and argmax: Extended version. https://arxiv.org/pdf/1911.05272.pdf. 2020.
- Shepp, L. A. The joint density of the maximum and its location for a Wiener process with drift. J. Appl. Probab. 1979, 16, 423–427. DOI: https://doi.org/10.2307/3212910.
- Williams, D. Decomposing the Brownian Path. Bull. Amer. Math. Soc. 1970, 76, 871–873. Math. Review MR-41 2777. DOI: https://doi.org/10.1090/S0002-9904-1970-12591-5.
- Williams, D. Path decomposition and continuity of local time for one dimensional diffusions I. Proc. London Math. Soc. 1974, 28, 738–768.
- Yor, M. Some remarks about the joint law of Brownian motion and its supremum. Semin. Probabil. Strasbourg, 1997, 31, 306–314.
Appendix A:
Meander moments
We now compute the moments of a Brownian meander given the distribution in (Citation3.Citation4):
(9.1)
(9.1)
(9.2)
(9.2)
(9.3)
(9.3)
where
and
Note
(9.4)
(9.4)
Here we use and
to show that the exponential terms cancel. The first moment of the meander satisfies
(9.5)
(9.5)
(9.6)
(9.6)
Similarly, the second moment of the meander satisfies
(9.7)
(9.7)
(9.8)
(9.8)
(9.9)
(9.9)
The integrations follow from
(9.10)
(9.10)
(9.11)
(9.11)
(9.12)
(9.12)
For Section 5, we need the following integral:
(9.13)
(9.13)
(9.14)
(9.14)
(9.15)
(9.15)
where
and
We use the identities:
and
To evaluate the variance, we need
(9.16)
(9.16)
To evaluate in (Citation6.Citation4), note
(9.17)
(9.17)
(9.18)
(9.18)
We used the identities: and
Appendix B:
Details of Brownian simulations
In the simulation, we generate about 17 million Brownian paths. We then bin the paths in a “grid” of bins in space. We use quantile-like coordinates in the
parameterization. In the first phase space direction,
compute bin boundaries so that the number of curves are roughly equal in each bin. For each one dimensional bin, compute bin boundaries in the second coordinate direction, h, so that the number of bins is roughly equal. Finally, for each of the two dimensional bins, compute bins in the third direction, θ. Often, we choose a grid in c to correspond to quantiles of the normal distribution. (We center the c values to be the midpoints of the c grid.) The advantage of this approach is that the number of curves in each simulations is approximately the same. The disadvantage of this approach is that a convergence analysis is hard because the coordinates vary from simulation to simulation and halving the coordinate distance cannot be done in this adaptive gridding.
Given an ensemble of Brownian paths, we can create an equivalent ensemble of Brownian paths,
with right endpoint c, using the formula:
In our case, we transform the original 10 to 36 million Brownian paths for each value of c, calculate the maximum, h, and arg-maximum, θ, of
We then bin the paths into an nbins × nbins grid in
space based on the quantiles of the
Typical values of nbins are from 80 to 120. For each bin in the
grid, we calculate the mean and variance for each time and bin.
To describe these simulations, we call nSteps, the number of timesteps in the any one path simulation and nSim is the number of Brownian paths that we compute in the simulation before shifting the paths to have final value c.
The values of occur only on the time grid and this makes the quantile buckets discrete. To regularize the discreteness of
we use a quadratic interpolation of
that is, for a given realization of B(t) on a discrete path, we find the
on the grid,
We then use quadratic intepolation of B(t) on
and
to find a better approximation to the continuous time value of
A more accurate calculation is to use the exception of the
conditional on the three point values
where the discrete minimum occurs at
[Citation1].