
 ?Mathematical formulae have been encoded as MathML and are displayed in this HTML version using MathJax in order to improve their display. Uncheck the box to turn MathJax off. This feature requires Javascript. Click on a formula to zoom.
Abstract
Experimental values for the viscosity of the radioactive hydrogen isotope tritium (T2) are currently unavailable in literature. The value of this material property over a wide temperature range is of interest for applications in the fields of fusion and neutrino physics, as well as to test ab initio calculations. As a radioactive gas, tritium requires a careful experiment design to ensure safe and environmental contamination–free measurements. In this contribution, we present a spinning rotor gauge–based tritium-compatible design of a gas viscosity measurement apparatus, or ViMA, capable of covering the temperature range from 80 to 300 K.
I. INTRODUCTION
The viscosity is one of the fundamental material properties of gases needed for gas dynamic calculations. Therefore, the viscosity of many gases has been measured over a wide temperature range.[Citation1–6] For many simple systems, like noble gases[Citation7] or molecular hydrogen,[Citation8,Citation9] ab initio calculations have been performed. Simple molecules that have not been covered widely due to their radioactivity are the tritiated isotopologues of hydrogen. Ab initio calculations exist,[Citation10] but since they have been carried out using a classical approach and neglect quantum effects, they are only suitable for temperatures of 300 K and above. Other calculations are done by extrapolation from hydrogen and deuterium through their mass ratios with an estimated uncertainty of 5% to 10%.[Citation11,Citation12] To the best of the authors’ knowledge, no experimental values for the viscosity of tritiated hydrogen molecules exist in published literature.
The cryogenic region of viscosity covered by neither theoretical calculations nor experiment is of interest for several applications, such as the closed tritium cycle design, development and operation for nuclear fusion, and experimental neutrino physics. The Karlsruhe Tritium Neutrino Experiment (KATRIN) is one such experiment that aims to measure the electron antineutrino mass using the electron spectrum of the tritium β-decay. The KATRIN collaboration has published a new experimental upper limit on the neutrino mass of 0.8 eV (90% confidence level).[Citation13] In this experiment, tritium is circulated through a 10-m-long windowless gaseous tritium source (WGTS) at a temperature of 80 K. Viscosity is the central parameter to model the density profile of tritium inside the WGTS, and is therefore a systematic effect for the KATRIN experiment. In the fusion fuel cycle, the viscosity of tritium is needed, for example, to simulate the tokamak exhaust process, isotope separation systems based on gas chromatography, and others.
In order to measure the viscosity of tritium down to temperatures relevant to the KATRIN experiment, we have built a viscosity measurement apparatus (ViMA) based on a spinning rotor gauge (SRG). In this paper, we describe an apparatus design capable of measuring gas viscosities from 77 to 300 K in a manner that is compatible with the material requirements for later use with tritium, and we show first results of the viscosity of hydrogen measured with this apparatus over a range of 200 to 300 K with an improved uncertainty of 2%.
II. THEORY OF THE SRG
Whereas the SRG normally is used as a pressure gauge for ultra-high vacuum (UHV), where its measurements are independent of the viscosity of the surrounding gas, it can also be used at higher pressures, between 20 to 2000 Pa, to measure the viscosity of the gas if the pressure is measured separately. In both cases, the normalized deceleration rate of the rotor is measured in dependence of the pressure and the temperature. The underlying effect used here is the damping of the rotor caused by the collisions of the surrounding gas with the SRG rotor. The torque normalized to the frequency
of the rotor can be written as
where is the moment of inertia of a sphere. By inverting the normalized torque, the formula for measuring the viscosity with the SRG, which is derived in Refs. [Citation14–16], reads as follows:
where and
are constants for a given temperature
,
is the pressure,
is the viscosity, and
is a calibration factor (compare to).[Citation17] Experimentally, the viscosity is derived using EquationEq. (2)
(2)
(2) by fitting a linear function to the taken data and extracting
from the y-axis intersection. As for the measurement procedure, there are different methods to acquire the necessary data for the fit, which are currently under investigation in terms of reproducibility, systematic effects, and handling.
III. DESIGN CONSTRAINTS
Since the setup is planned to operate with tritium, there are some constraints. The whole system needs to be built according to the technical terms of delivery and acceptance and the best engineering practice.[Citation18] The technical design pressure range is limited to 90 kPa so that, in case of leakage, tritium release against atmospheric pressure is minimized. The whole primary system, which is in contact with tritium, needs to be fully built out of metal, including the sealing gaskets. In addition, the system needs to fit into a glove box, leaving enough space to handle it using the gloves.
Furthermore, there are specific needs to guarantee the most accurate measurements of the viscosity. The thermal stabilization has to be better than 1 Kh−1 to exclude any thermal drift inside the system during one measurement. The temperature gradient inside the measurement cell should not exceed 1 K. The pressure range inside the measurement cell needs to run from 100 to 2000 Pa at room temperature and from 20 to 500 Pa at liquid nitrogen temperature to stay in the Knudsen flow regime. The temperature is limited on the low end to 77 K by the use of liquid nitrogen as a coolant and on the high side to 330 K by the maximum operating temperature of the SRG. Lower temperatures, down to 10 to 20 K where the saturation vapor pressure becomes limiting, are desirable, but were not targeted in this setup due to the associated increase in system complexity of going below liquid nitrogen temperatures. Nevertheless, they might be achievable by better insulation and other adjustments, especially on the magnetization of the rotating sphere.
IV. DESIGN
After proof-of-principle setups demonstrated the feasibility of the approach, the new and refined Cryogenic viscosity measurement apparatus (Cryo-ViMA) will enable us to measure the viscosity of tritium while fulfilling all the constraints listed earlier. The apparatus for measuring viscosities consists, in principle, of three main components: a SRG (MKS SRG-3), a gas species–independent capacitance diaphragm gauge (MKS 626, 20 torr full scale), and a Dewar cooled or heated by gaseous nitrogen. The pressure sensor at room temperature is connected to the same sample volume as the SRG, which is situated inside of the Dewar. This sample volume can be evacuated using a turbomolecular pump and filled with different high purity gases (H2, D2, N2) and their mixtures. All wetted surfaces of the setup are fully metal, ensuring compatibility for operation with tritium at a later point in time.
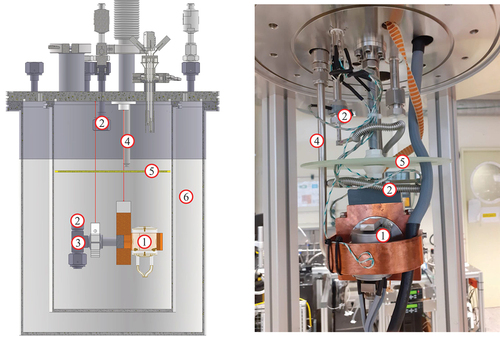
A flow pattern of the new setup can be seen in . An annotated computer-aided design (CAD) model and a photograph of the setup are shown in . To have a thermal insulation against the environment, the SRG, together with five temperature sensors (thermocouple type K), is built up inside a cryostat consisting of two stainless steel barrels with insulation vacuum in between. This cryostat is cooled inside with nitrogen gas by a dedicated cold gas system. The cold gas system can be controlled in the whole temperature range between 80 to 300 K and is stabilized to 2 Kh−1. At the time of writing this paper, the thermal stabilization of the cryostat was not sufficient enough for the planned measurement procedure, which is why the procedure has been changed, as described in Sec. V.
Fig. 1. Flow pattern of the Cryo-ViMA. The primary system, meaning all parts in contact with tritium, are colored in red. The cold gas is marked in blue, and the isolation vacuum is colored in green.
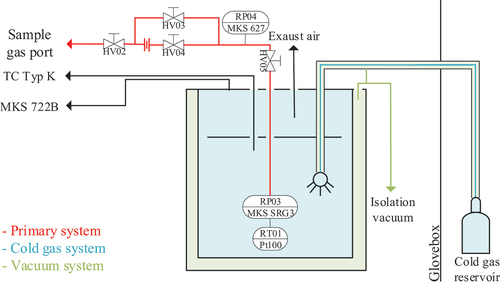
Fig. 2. CAD model and photograph of the Cryo-ViMA. Shown are the SRG head ① connected to that sample gas tube ② (bellow connection not shown in CAD), which also contains the sample gas temperature sensor ③. Cold nitrogen gas from the cold gas system is injected via a nozzle ④. A diffusion plate ⑤ improves temperature stability and cooling efficiency. Surrounding these components is a vacuum insulated Dewar ⑥.
Since the sample gas is stored at room temperature, a precooling is needed. This is realized with a long, thin-walled bellows tube, which is installed as a loop through the whole cryostat before it connects to the SRG thimble. The tritium compatibility is guaranteed by only using stainless steel in the primary system, which is proved to hold pressures up to 500 kPa. This qualification for high pressures is necessary to ensure that even if the system is filled with the maximum operating pressure of 90 kPa at 77 K, a warm-up to room temperature does not lead to leakage or structural damage of the system. In this fashion, even in the case of failure of the cooling system or operator mistakes, safe enclosure of tritium in the primary system can be guaranteed.
V. EXAMPLE COMMISSIONING MEASUREMENTS
The measurements described in Wydra et al.[Citation17] were conducted at constant temperature by changing the pressure inside the SRG. The temperature of the Cryo-ViMA can only be stabilized to 2 Kh−1, leading to an uncertainty of 1.7%, which is only caused by the instability of the temperature, so measurements with constant temperature are not feasible for high-precision results. With the Cryo-ViMA, the measurements were conducted by fixing the absolute particle number inside the relevant volume, by choosing a pressure set point between 10 to 2000 Pa, and closing the volume by closing valves HV03 and HV04 (compare to ). This way, the pressure inside the SRG was still monitored.
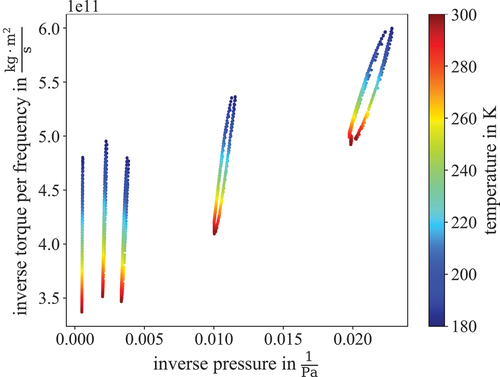
Afterward the temperature of the cold gas system was ramped from room temperature down to 77 K and up again. One such thermal cycle takes about 1 day and is repeated for different pressure set points. The result can be seen in , where every loop corresponds to one thermal cycle. The advantage of this procedure is that the temperature inside the Dewar does not need to be stable at a high level of 0.1 K min−1, as it would have needed to be for measurements at constant temperature, making the previously mentioned uncertainty obsolete. From here the viscosity can be calculated by picking the measured values for one temperature and fitting EquationEq. (2)(2)
(2) .
Fig. 3. Example commissioning measurement. Shown are the thermal cycle measurements at different pressure set points. The color indicates the temperature between 180 to 300 K. At low pressures (right side of the graph) a slight hysteresis can be seen, indicating that some adjustments still have to be made for the cycling speed.
VI. UNCERTAINTIES
Uncertainties on the viscosity measurement with the SRG are caused by the pressure, the normalized deceleration rate, and the temperature. The contribution of the uncertainty on the normalized deceleration rate to the value of the measured viscosity is far below 0.1%, and thus negligible. The contribution of the pressure and the temperature are explained in the following sections.
VI.A. Temperature Corrections
Previous measurements have shown that the temperature has the highest impact on the uncertainty of the results. There are two major corrections done to the measured temperature values. The first is a linear calibration correction to account for deviations of our PT100 sensor from the standard PT100 curve. The second effect is an intrinsic effect of the SRG and is not trivial to correct for.
The SRG is primarily a pressure gauge for UHV. Under these conditions, the largest thermal change of the system is caused by the initial acceleration of the rotating sphere. It is recommended to wait for at least 30 min to give the sphere the possibility to come into thermal equilibrium with the surroundings again.[Citation19] For the measurement of the viscosity in our setup, this was not possible since the deceleration rate was too high. During our measurements, the sphere was re-accelerated every ≈10 s from 420 to 440 Hz. With the deceleration rate and the thermal expansion of the sphere, the heat of the sphere can be calculated [see Eq. (16) in chapter 24.3 of Ref. [Citation20]], leading to EquationEq. (3)(3)
(3) :
With a basic finite elements method simulation, done with Ansys® Workbench 2020 R2, the temperature gradient of the gas surrounding the sphere can be calculated. Since this gradient is not only dependent on the sample gas but also on its density and the temperature, which both affect the deceleration rate, it has to be run for all possible combinations. First simulations showed a temperature gradient between 1 to 3 K over a distance of 3 mm for hydrogen and helium, which is still under investigation. Nevertheless our temperature sensor is not close enough to be able to measure this effect, so the measured temperature will likely be systematically lower than the true temperature around the sphere, which has to be corrected for in the analysis.
VI.B. Pressure Corrections
In this setup, the pressure is measured at room temperature while the gas temperature varies between 200 to 300 K, leading to a thermomolecular pressure difference. The influence of the temperature gradient on the accuracy of the pressure measurement can be found in Sharipov.[Citation21] In this setup, the uncertainty from not including this effect only becomes relevant at pressures lower than 100 Pa and temperatures of 150 K and lower.
VII. RESULTS AND DISCUSSION
In , the results of the first measurements with Cryo-ViMA are shown. The measured values agree with the literature values within an uncertainty of about 2%. The measured values show some slight tilt compared to the ab initio values by Mehl, Huber, and Harvey[Citation8] and the experimental values from May, Berg, and Moldover[Citation22] gathered with a capillary viscometer. This tilt might be caused by the temperature gradient inside the SRG. As mentioned in Sec. VI, the measured temperature is likely to be between 1 to 3 K lower than the true value around the rotating sphere. This effect would shift the curve slightly to the right. Since the temperature gradient is different at different temperatures, this will not only cause a shift, but also a tilt of the curve, which is currently under investigation.
Fig. 4. Viscosity of hydrogen in dependence of the temperature. The blue dots are the extracted data points, while the blue band shows the 2% uncertainty regarding the current uncertainty given by the thermal gradient inside the sample gas volume. (*) The literature values (red crosses) are taken from Mehl, Huber, and Harvey.[Citation8] (*
) The experimental values are taken from May, Berg, and Moldover,[Citation22] which used the capillary viskometer.
![Fig. 4. Viscosity of hydrogen in dependence of the temperature. The blue dots are the extracted data points, while the blue band shows the 2% uncertainty regarding the current uncertainty given by the thermal gradient inside the sample gas volume. (* 1) The literature values (red crosses) are taken from Mehl, Huber, and Harvey.[Citation8] (* 2) The experimental values are taken from May, Berg, and Moldover,[Citation22] which used the capillary viskometer.](/cms/asset/6aa9a193-32d6-42b4-9f3a-49a56e804e36/ufst_a_2238170_f0004_oc.jpg)
For further measurements, it is planned to investigate the influence of the temperature gradient inside the SRG on the accuracy of the results. Also under investigation is the influence of the pressure correction on the tilt of the curve, since this also shifts the results for the viscosity at different temperatures in different ranges. To be able to correct for this effect, simulations, as mentioned previously, have been conducted, enabling us to reduce the uncertainty down to 1%.
VIII. SUMMARY
The measurement of gas viscosity using rotating bodies is an established method in literature,[Citation16,Citation23] and SRGs have been used for this at room temperature in the past.[Citation14–16] Our efforts have been focused on extending these prior works with the goal of achieving measurements not only at 77 K and 300 K, which had not been done before our work in Wydra et al.,[Citation17] but in a wider temperature range and featuring tritium compatibility. In this contribution, we have presented a setup that enables the viscosity measurement of gases in the range from 77 to 300 K. We have taken care in our design and material selection to achieve the safe enclosure of the sample gas, allowing us to use the setup to measure the viscosity of the radioactive hydrogen isotope tritium.
In general, the setup we have presented in this contribution can be used to measure the viscosity of hazardous (radioactive, corrosive, toxic, and so on) gases, making it applicable outside of our particular field of research as well. In addition we have presented first measurement results with this setup on the viscosity of gaseous hydrogen in the temperature range between 200 to 300 K to show the current status of our data analysis. The results agree with the ab initio calculated literature values[Citation8] within an uncertainty of less than 2%.
Known thermal effects, which are suspected to be the main cause for the observed deviation, are currently under investigation and will be implemented in the final data analysis. Based on the presented measurements, we are confident that after investigation and improvement of the observed uncertainties, Cryo-ViMA will be able to measure the viscosity of tritium over a wide temperature range with an uncertainty of about 1%.
Knowing, that the tritium viscosity at 77 K is only known from extrapolations from hydrogen and deuterium with an uncertainty of up to 10%,[Citation11,Citation12] even without our temperature corrections these results mean an improvement of a factor of 5 in uncertainty. Including the temperature corrections, the uncertainty can be reduced by a factor of even 10. Since from Wydra et al.[Citation17] we know that the SRG is still working at 77 K, it might even be possible to go to lower temperatures by changing the cooling gas from nitrogen to, for example, helium, which can be tested in future.
Disclosure Statement
No potential conflict of interest was reported by the authors.
Additional information
Funding
References
- M. J. ASSAEL et al., “Reference Values and Reference Correlations for the Thermal Conductivity and Viscosity of Fluids,” J. Phys. Chem. Ref. Data, 47, 2, 021501 (2018); http://dx.doi.org/10.1063/1.5036625.
- A. RIETVELD and A. VAN ITTERBEEK, “Viscosity of Mixtures of H2 and HD Between 300 and 14 °K,” Physica, 23, 6–10, 838 (1957); http://dx.doi.org/10.1016/S0031-8914(57)94957-1.
- A. VAN ITTERBEEK and A. CLAES, “Measurements on the Viscosity of Hydrogen and Deuterium Gas Between 293 K and 14 K,” Physica, 5, 10, 938 (1938); http://dx.doi.org/10.1016/S0031-8914(38)80036-7.
- A. VAN ITTERBEEK and O. VAN PAEMEL, “Measurements on the Viscosity of Neon, Hydrogen, Deuterium and Helium as a Function of the Temperature, Between Room Temperature and Liquid Hydrogen Temperatures,” Physica, 7, 3, 265 (1940); http://dx.doi.org/10.1016/s0031-8914(40)90115-x.
- J. KESTIN and W. LEIDENFROST, “An Absolute Determination of the Viscosity of Eleven Gases Over a Range of Pressures,” Physica, 25, 7, 1033 (1959); http://dx.doi.org/10.1016/00318914(59)90024-2.
- J. KESTIN et al., “Absolute Determination of the Thermal Conductivity of the Noble Gases at Room Temperature Up to 35 MPa,” Physica A, 100, 2, 349 (1980); http://dx.doi.org/10.1016/0378-4371(80)901259.
- J. J. HURLY and M. R. MOLDOVER, “Ab Initio Values of the Thermophysical Properties of Helium as Standards,” J. Res. Nat. Inst. Stand. Technol., 2000, 105, 667 (2000); http://dx.doi.org/10.6028/jres.105.054.
- J. B. MEHL, M. L. HUBER, and A. H. HARVEY, “Ab Initio Transport Coefficients of Gaseous Hydrogen,” Int. J. Thermophys., 31, 4, 740 (2010); http://dx.doi.org/10.1007/s10765-0090697-9.
- J. SCHAEFER, “Transport Coefficients of Dilute Hydrogen Gas, Calculations and Comparisons with Experiments,” Chem. Phys., 368, 1–2, 38 (2010); http://dx.doi.org/10.1016/j.chemphys.2009.12.007.
- B. SONG et al., “Ab Initio Values of the Gas Transport Properties of Hydrogen Isotopologues and Helium–Hydrogen Mixtures at Low Density,” J. Chem. Eng. Data, 61, 5, 1910 (2016); http://dx.doi.org/10.1021/acs.jced.6b00076.
- L. KUCKERT et al., “Modelling of Gas Dynamical Properties of the Katrin Tritium Source and Implications for the Neutrino Mass Measurement,” Vacuum, 158, 195 (2018); http://dx.doi.org/10.1016/j.vacuum.2018.09.036.
- F. HEIZMANN, “Analysis Tools and Methods for Tritium Data Taking with the KATRIN Experiment,” PhD Thesis, Karlsruher Institut für Technologie (KIT) (2019); http://dx.doi.org/10.5445/IR/1000093536.
- M. AKER et al., “Direct Neutrino-Mass Measurement with Sub-Electronvolt Sensitivity,” Nat. Phys., 18, 2, 160 (2022); http://dx.doi.org/10.1038/s41567-021-01463-1.
- P. TEKASAKUL et al., “The Spinning Rotor Gauge: Measurements of Viscosity, Velocity Slip Coefficients, and Tangential Momentum Accommodation Coefficients,” J. Vac. Sci. Technol. A Vac. Surf. Films, 14, 5, 2946 (1996); http://dx.doi.org/10.1116/1.580249.
- J. BENTZ, R. TOMPSON, and S. LOYALKA, “The Spinning Rotor Gauge: Measurements of Viscosity, Velocity Slip Coefficients, and Tangential Momentum Accommodation Coefficients for N2 and CH4,” Vacuum, 48, 10, 817 (1997); http://dx.doi.org/10.1016/s0042-207x(97)00031-6.
- S. K. LOYALKA, “Theory of the Spinning Rotor Gauge in the Slip Regime,” J. Vac. Sci. Technol. A, 14, 5, 2940 (1996); http://dx.doi.org/10.1116/1.580248.
- J. WYDRA et al., “Towards the First Direct Measurement of the Dynamic Viscosity of Gaseous Tritium at Cryogenic Temperatures,” Vacuum, 203, 111237 (2022); http://dx.doi.org/10.1016/j.vacuum.2022.111237.
- S. WELTE et al., “Tritium Laboratory Karlsruhe: Administrative and Technical Framework for Isotope Laboratory Operation,” Fusion Sci. Technol., 67, 3, 635 (2015); http://dx.doi.org/10.13182/fst14-t98.
- Spinning Rotor Vacuum Gauge—Instruction Manual, MKS (2009).
- Handbuch Vakuumtechnik, K. JOUSTEN, Ed., Springer Reference Technik, Springer Vieweg (2018).
- F. SHARIPOV, “Rarefied Gas Flow Through a Long Tube at Any Temperature Ratio,” J. Vac. Sci. Technol. A Vac. Surf. Films, 14, 4, 2627 (1996); http://dx.doi.org/10.1116/1.579991.
- E. F. MAY, R. F. BERG, and M. R. MOLDOVER, “Reference Viscosities of H2, CH4, Ar, and Xe at Low Densities,” Int. J. Thermophys., 28, 1085 (2007); http://dx.doi.org/10.1007/s10765-007-0198-7.
- Y. SHIMOKAWA et al., “Gas Viscosity Measurement with Diamagnetic-Levitation Viscometer Based on Electromagnetically Spinning System,” Rev. Sci. Instrum., 87, 12, 125105 (2016); http://dx.doi.org/10.1063/1.4968026.