
 ?Mathematical formulae have been encoded as MathML and are displayed in this HTML version using MathJax in order to improve their display. Uncheck the box to turn MathJax off. This feature requires Javascript. Click on a formula to zoom.
ABSTRACT
This paper reports a validation study based on descriptive multidimensional item response theory (DMIRT), implemented in the R package D3mirt by using the ERS-C, an extended version of the Relevance subscale from the Moral Foundations Questionnaire including two new items for collectivism (17 items in total). Two latent models are created and investigated in two large samples (N = 1560 and N = 1380 US citizens). The internal investigation indicates a presence of two unidimensions, Compassion and Conformity, and a third within-multidimension of Collectivism in both samples. The external investigation show that Republicans are the highest on Conformity in the models, followed by Independents, and lastly Democrats. Democratic followers are the highest on compassion, followed by Independents and Republicans. No difference between groups on Collectivism were found. Lastly, the models succeeded in correctly identifying the Republican and Democratic voters but struggled to correctly classify the Independent.
Moral Foundations Theory (MFT) has, since it was first formulated in Haidt and Joseph (Citation2004), been recognized as a theoretical framework that can map the moral differences between the liberal and the conservative (Graham et al., Citation2009; Joseph et al., Citation2009). Studies using the Moral Foundations Questionnaire (MFQ), the measurement tool used to support the theory (Graham et al., Citation2011), showed that while liberals mostly preferred Care and Fairness, i.e., the Individualizing Foundations; values regarding compassion and equal rights, the conservative extended their moral palette to also include the foundations of Loyalty, Authority and Purity, i.e., the Binding Foundations; values related to group cohesion, disgust avoidance, religiosity, and conformity to a prevailing social order.
The focus of this study is, however, not theoretical nor on the MFQ but on one subscale in the MFQ, the Relevance subscale. The MFQ consists of two sub-scales, the just mentioned and the Judgement subscale, each holding 15 items. Both subscales measure the five moral foundations and the measurement model consists of a five-factor covarying factor model in turn motivating the introduction of the five labels just mentioned. That is, the five moral foundations are nothing less than the five covarying factors.
A recent study, however, showed that the two subscales have very different psychometric properties. More specifically, using non-parametric item response theory (non-parametric IRT), results indicated that the Relevance subscale was superior in psychometric performance, compared to the Judgment subscale, across samples and culture (Forsberg & Sjöberg, Citation2021). Perhaps, this outcome should not be surprising since the Relevance subscale consists of shorter, easier items that follow a very strict style format (examples are given in the materials section below), whereas the Judgement subscale consists of items that vary in length and semantic complexity. In other words, we can reasonably assume that the style format in the latter invites inconsistencies in responses, in turn making the subscale less likely to be psychometrically strong.
Moreover, another interesting finding was that the Loyalty Foundation seemed inconsistent with the Binding foundations and that the content of the Loyalty items seemed biased toward the Binding part of the model (Forsberg & Sjöberg, Citation2021). The Loyalty Foundation refers to our intuitive tendency to form cohesive coalitions and the moral violation felt when this cohesion is challenged (Haidt, Citation2012). According to theory, this is a distinctive feature of the conservative mind-set. However, in light of these new findings, our intuition was that this may not be correct. Moreover, it also seemed to be the case that the original construal of the foundation was one-sided. That is, it is the image of the group as an authoritarian, i.e., as a source of tribalism, obedience, pride, aggression, and punishment of traitors. In other words, what is lacking is the group as the authoritative, i.e., as a source of support, guidance, love, and care.
The current study
Consequently, we were, on the one hand, inspired by the performance of the Relevance subscale and, on the other hand, intrigued by the issues just mentioned. We, therefore, as part of a larger study on moral differences, set out to expand on the Relevance subscale by adding new items following the same style format. This became the Extended Relevance Scale, (ERS) that, over and above the items from the original Relevance subscale, involves the addition of new items with content on collectivism (two items; the expansion of ingroup/loyalty from MFT), individualism (six items), and religiosity (one item; expansion of the Purity foundation). Accordingly, to investigate the ERS-C, we will in this paper report a validation study, investigating the internal structure of the scale and testing the same against external criteria. However, because the results of the scale exapansion invite complexity, we will limit our study to reporting the results regarding the items from the original Relevance subscale and the two new collectivism items: the ERS-C, in which C stands for collectisvism.
The study will consist of two parts. Firstly, the internal properties of the ERS-C will be investigated. However, given the issues mentioned in the introduction, we will use descriptive multidimensional item response theory (DMIRT) (Reckase, Citation2009), explained below, and more specifically DMIRT restricted to three-dimensional analysis available in the D3mirt package for R (R Core Team, Citation2023). This was done because we wanted to assess the scale on item-level in a multidimensional latent environment, under the assumption that items can be unidimensional or within-multidimensional. However, because DMIRT is less explored on polytomous data, this approach comes with a need to empirically investigate the utility of the methodology and to contrast the results against more commonly used methods. In particular, because there is a statistical and conceptual association between the DMIRT discrimination indices and item factor loadings, exploratory factor analysis serves as one useful contrast. Moreover, because DMIRT is based on IRT, we also add non-parametric latent analysis as a second contrast. Briefly, non-parametric IRT relies on the most basic IRT assumptions (i.e., unidimensionality, monotonicity, and local independence) and can be used for exploring latent structures and psychometrically evaluating the same. The expectation was that we would find three latent dimensions, i.e., Compassion, Conformity, and Collectivism. Using DMIRT methodology would also show that while the former two are unidimensions, the latter will be within-multidimensional with the added collectivism items filling the conceptual gap mentioned above.
Second, to test the external performance of the measurement model identified in the first part of the study, we will focus on using respondents’ self-reported political affiliation (i.e., being affiliated with the Republican Party, the Democratic Party, or being registered as an independent). This allows us to investigate our model against relevant external criteria and to contrast our results against what is already known about the questionnaire and its external properties.
To achieve this, the first external analysis compares the mean trait-level between political ingroups on the three latent dimensions with the help of a one-way ANOVA. It was hypothesized that the Republicans and Democrats would mainly differ on their trait levels of Conformity, followed by Compassion; the Republicans being higher on Conformity and lower on Compassion and the latter being higher on Compassion and lower on Conformity. However, in contrast to theory, we hypothesized that no difference between the groups would be found regarding Collectivism.
The second external analysis investigated the identified models’ predictive utility. However, to offer something new, we used linear discriminant analysis (LDA) to predict political affiliation as the dependent categorical variable. It was expected that the models would be able to correctly label the Republican or the Democrat but the ability to correctly classify an independent voter was unknown.
Note, this paper aims to present the empirical results of our study and, in so doing, illustrate the utility of using DMIRT methodology for the analysis of items and tests. Thus, this is a psychometric paper first hand and we will, therefore, keep the theoretical discussion to a minimum. This also means that we will introduce our own labels based on results from the analysis so that the conclusions will be as close as possible to the observations reported.
Descriptive multidimensional item parameters
Within DMIRT, it is assumed that an item can be unidimensional, i.e., measure one dimension only, or within-multidimensional, i.e., measure more than one dimension, when situated in a multidimensional space (Reckase, Citation2009). To assess this charachteristic, the DMIRT analysis locates the singular point in the model space at which the item discrimination is at its highest, i.e., locates its global maxima. For this purpose, the multidimensional discrimination index (MDISC) has been proposed (Reckase, Citation2009; Reckase & McKinley, Citation1991):
Such that Ai represents the global maximum of discrimination for item i and a discrimination parameters on k dimensions (k = 1,2,3...m) in the multidimensional latent model (Reckase, Citation2009; Reckase & McKinley, Citation1991). Item discrimination and item factor loadings are mathematically associated (see de Ayala (Citation2009), for a comprehensive discussion). Therefore, just as an item’s loading on a factor can be said to describe the item’s relation to the factor, the MDISC can be said to describe the item’s relation to the underlying latent dimension. To quantify the latter, however, the point of maximum discrimination, or maximum slope, must be found in the multidimensional latent space. This is achieved assuming that the model axes are orthogonal and taking the arccos angle (Reckase, Citation1985, Citation2009):
Such that ail is the angle on l number of axes that shows in what direction the point of maximum discrimination is oriented (Reckase, Citation1985, Citation2009). Therefore, reading the angle orientation in the model indicates along which dimensions the item discriminates. Accordingly, assuming a 2-dimensional space, an item located at 0◦ from, for instance, the x-axis, and 90◦ from the y-axis, only measures the latent dimension located at the x-axis and is, therefore, unidimensional. Similarly, an item located at 90◦ from the x-axis, and 0◦ from the y-axis, only measures the latent dimension located at the y-axis and is, therefore, also unidimensional. An item located at 45◦ from both axis measures both dimensions equally well. Such an item is within-multidimensional.
To account for item difficulty, a single multidimensional difficulty index has been proposed (Reckase, Citation1985):
Where d is the intercept term and Bi represents the multidimensional distance from the origin and, therefore, indicates item difficulty assuming a multidimensional latent space (Reckase, Citation1985). The MDIFF is similar in interpretation to difficulty in the unidimensional IRT model.
It is important to note, however, that the MDIFF, just as the MDISC, only has meaning in the direction given by the point of maximum discrimination (Reckase, Citation2009; Reckase & McKinley, Citation1991). This implies that both these parameters cannot be directly compared between items, as would be the case in the unidimensional model. Thus, using the local maxima may therefore suggest a limitation to the DMIRT approach. However, to remedy this shortage, the direction discrimination index can be used (Reckase & McKinley, Citation1991):
Such that DDISC gives the local discrimination score for an item when the item is constrained to follow a given direction (Reckase & McKinley, Citation1991). In the D3mirt package, the DDISC is implemented by the use of construct vectors that calculate the average direction of a subset of items, from all items down to one, and then adjust the discrimination index for all items in the analysis.
Method
Sample 1
The first sample consisted of N = 1560 participants (Mage= 23.65, SD = 14.68, female = 50%) US citizens, recruited through Prolific in three waves screening for political spectrum (conservative, moderate, and liberal), sex, and participation in any previous studies. The study took about 10 minutes to complete and all respondents were rewarded £1.34 for their efforts.
Regarding cultural characteristics of the sample, almost all respondents reported being born in the US (N = 1484), and mainly of Christian faith (45%) followed by Atheism (30%). Most of the participants identified as monocultural (54%) while 30% identified as multicultural. On a Likert scale from 1 to 10 regarding self-reported socioeconomic status, the sample reached an average score of M = 6.18 (SD = 1.79). A majority, 68%, had an undergraduate degree or higher and at the time of the data collection, 50% were employed or were starting a new job within the next month, while 14% were part-time employed, and 13% had a non-paid occupation (such as homemaker, retired or disabled). The remaining participants were either unemployed or did not fall into any occupational category.
Sample 2
The second sample consisted of N = 1380 participants (Mage = 41.17, SD = 13.92, female = 50%) US citizens, recruited through Prolific in three waves screening for political spectrum (conservative, moderate, and liberal), sex, and participation in any previous studies. The study took about 8 minutes to complete and all respondents were rewarded £1.20 for their efforts.
The cultural characteristics are very similar to Sample 1. For instance, almost all respondents reported being born in the US (N = 1295), and mainly of Christian faith (53%) followed by Atheism (32%). Most of the participants identified as monocultural (51%) while 31% identified as multicultural. The sample reached an average score of M = 5.12 (SD = 1.72) on the self-reported socioeconomic Likert scale. A majority, 72%, had an undergraduate degree or higher and at the time of the data collection, 57% were employed or were starting a new job within the next month, while 13% were part-time employed, and 12% had a non-paid occupation (such as homemaker, retired or disabled). The remaining participants were either unemployed or did not fall into any occupational category.
Materials
The extended relevance scale
The ERS consists of a set of 24 items and holds 5 content themes: Compassion, Conformity, Collectivism, Individualism, and Religiosity. The former two themes are the major themes in the scale while the other are subthemes. In this study, however, we limited the analysis to focus on the ERS-C (Compassion, Conformity, and Collectivism; Cite appendix: Item key in appendix). Of the total 17 items analyzed in this study, 15 items came from the Relevance subscale (see Graham, Nosek et al. (Citation2011), for psychometric properties) and 2 new items, following the same style format as the original scale, were added.
The questionnaire consists of sentence completion tasks with the following instruction: “When you decide whether something is right or wrong, to what extent are the following considerations relevant to your thinking?” All items begin with the antecedent “Whether or not...” followed by the sentence completion statement. Examples of the latter from the original Relevance subscale are: “…someone suffered emotionally.” or “…someone’s action showed love for his or her country.” The two new items had content related to collectivism and read: ”…someone abandoned his or her team.” and ”…someone hurt his or her group.” Answers were given on a Likert scale ranging from 1 (not at all relevant) to 6 (extremely relevant).
The ERS items were used in both the samples mentioned above, collected roughly 1 year apart. In between data collection, no changes or additions to the ERS were made and results were expected to replicate.
Statistical procedure
Exploratory factor analysis
All statistical analysis in this paper was performed with R (R Core Team, Citation2023) in RStudio (RStudio Team, Citation2023) The investigation begins with an exploratory factor analysis (EFA), on the two samples separately using multidimensional IRT methods implemented in the mirt function from the mirt package (Chalmers, Citation2012). The graded response model was used as the item model and the estimation algorithm was set to use quasi-Monte Carlo expectation maximization. The number of factors was changed from one to six so that the potential theoretically coherent five factors were included in the set. Fit indices reported are the collapsed M2* statistic (Cai & Hansen, Citation2013) and the corresponding C2 statistic (for the case when the models do not have sufficient degrees of freedom; see Cai and Monro (Citation2014)).
Factor loadings, sum of squares of rotated factor loadings, and factor correlation loadings are reported. To assess goodness-of-fit, the root mean square error of approximation (RMSEA) and the standardized root mean square residual (SRMSR) are used. To interpret the RMSEA, many suggestions have been made. A common practice is that an RMSEA< 0.06 implies adequate fit (Hu & Bentler, Citation1999). However, because the RMSEA is an unstandardized fit estimate that assesses model fit weighted by the number of degrees of freedom for the model, it is mostly useful for model comparisons that take model complexity into account (such that poor fit indicates issues related to the latter). In contrast, the SRMSR is a population statistic that calculates goodness-of-fit as the average standardized residual covariance that indicates the effect size of the misfit for the model (Maydeu-Olivares, Citation2017). Hence, if the SRMSR is poor, then the model is mis-specified in terms of the average residuals that are not being explained by the model. Adequate fit has been suggested to be the case when the SRMSR is ≤ 0.05. Accordingly, in this study, the SRMSR will serve as the main criteria such that the number of factors will be selected at the level when the EFA reports an SRMSR equal to or less than the upper bound.
In addition, the Tucker-Lewis fit index (TLI) and the comparative fit index (CFI) for null-model comparisons are reported. In brief, the TLI is a non-normed index that assesses the relative reduction in misfit per degree of freedom compared to a baseline, while the CFI is a normed index that indicates if the postulated model is an improvement in fit compared to a baseline model. Following Hu & Bentler (Citation1999), acceptable fit is often set at ≥ 0.95 regarding both indices.
Mokken scale analysis
Accompanying the EFA, Mokken scale analysis (MSA; Mokken, Citation1971), implemented in the package mokken (Van der Ark, Citation2007, Citation2012), will be used to assess item fit to the monotone homogeneity model (HMH)Footnote1 in the two samples separately. The MHM assumes that items meet the assumptions of unidimensionality, monotonicity, and local independence. In contrast to other models in IRT, the MHM makes no assumption of the specific shape of the functional form mapping the relation between the level of trait and item scores, over and above being monotonically non-decreasing. The MHM is, therefore, seen as nonrestrictive in comparison to most IRT models and is often referred to as type of non-parametric IRT.
The MSA procedure consists of, on the one hand, identification of latent scales in the data, and, on the other hand, the assessment of scalability using the coefficient H, denoted coefficient Hi for items, coefficient Hij for item pairs, and H for scales (Mokken, Citation1971; Sijtsma & van der Ark, Citation2017). Regarding both items and scales, higher H indicates a higher level of agreement with the assumptions of the MHM, i.e., the level of extent to which the items or scales are reliable for ordering respondents on the level of trait. In general, fit varies between 0 ≤ H ≤ 1 and negative values indicate model violations. By convention, adequate fit for items and scales is the case when H ≥ 0.3. Regarding scales, the following heuristics have been suggested 0.3 ≤ H < 0.4 is a weak Mokken scale, 0.4 ≤ H < 0.5 is a moderate Mokken scale, and H ≥ 0.5 is a strong Mokken scale. An H < 0.3 is considered to indicate that the scale is unreliable for ordering respondents on the level of trait. In addition, the standard error should be considered in light of the former such that scale strength should be reduced if the SE indicate high uncertainty (Kuijpers et al., Citation2013).
Data exploration is performed with the automatic item selection procedure (AISP) that uses the assumptions of the MHM to extract Mokken scales (Mokken, Citation1971; Sijtsma & van der Ark, Citation2017). In brief, the AISP sorts items into scales using dummy coding variables to indicate scale-belonging for the items. For instance, for item i, a 1 in the AISP table indicates that i belongs to scale 1, a 2 indicates that item i belongs to scale 2, a 3 that i belongs to scale 3, and so on. The scale exploration is performed by order of a lower bound c that extract scales of maximal length in which (a) the covariance is non-negative for all item pairs i and j and (b) the Hi is ≥ c > 0 for all items i in the scale (Mokken, Citation1971). Items that fulfill these criteria are seen as contributing to the reliable ordering of respondents on level of trait under the assumption that the items measure the same latent construct. Items whose Hi is < c are seen as unscalable. Following Hemker et al. (Citation1995), the AISP was repeated while varying the lower bound c incrementally, in this case from 0 to 0.7.
Item and scale properties from the MSA are reported, and with the the help of the psych package (Revelle, Citation2023), the coefficient alpha (α), and McDonald’s (Citation1999) Omega hierarchical (ωh); the proportion of variance accredited to a single common factor and Omega total (ωt); the proportion of variance accredited to all common factors, are also included.
Note, the coefficients H and Hi are used in this study to assess the performance of potential latent scales, consisting of combinations of factors from the EFA, using the extracted scales from the AISP as the baseline scales. This allows for scale comparisons that can expose within-multidimensional latent structures in the data. More specifically, if the addition of items not selected by the AISP into a Mokken scale reduces the H and Hi, and more items fall below Hi < 0.3 compared to the baseline, then the items in the particular set do not seem to measure the same trait. If, on the other hand, the addition of items not selected by the AISP into a Mokken scale shows similar H scores, and all Hi ≥ 0.3, then these items seem to measure the same trait and this indicates the extra items are within-multidimensional.
Latent measurement models
For the three-dimensional DMIRT analysis, the package D3mirt (Forsberg, Citation2023) for dichotomous and polytomous data was used to create two latent measurement models, one for each sample. The model identification was performed using the dedicated function included in D3mirt and model fitting of the DMIRT model was done using the mirt function from the mirt package (Chalmers, Citation2012). Both of the former used quasi-Monte Carlo expectation maximization as the estimation algorithm and the graded response model as the item model. The model identification items for Model 1, from Sample 1, were CR1 (ABS = 0.091) and PR1 (ABS= 0.018), and for Model 2, from Sample 2, CR2 (ABS = 0.092) and AR1 (ABS = 0.028). For more on model identification see package vignette in Forsberg (Citation2023).
Indices reported include the MDISC, MDIFF for items, and DDISC for the discrimination score constrained to follow the orientation set by the construct vectors. Item and construct vector location are reported with θ, for the ± 180◦ clockwise rotation in the xz-plane, and φ, for the 0 ≤ φ ≤ 180° angle away from the y-axis. The results of the item analysis are graphed in three-dimensional figures with vector arrows illustrating item response functions.
Group comparisons
For the second part of the study, the sample was partitioned according to respondents’ self-reported political affiliation, creating three categorical variables, or classes: Republican, Independent, and Democrat. The respondents’ trait scores from each class are graphed as spheres surrounded by a 95% confidence interval in the three-dimensional latent space using the plot function from the D3mirt package (Forsberg, Citation2023). To test for group-level differences in trait scores for the political groups in the samples, a one-way ANOVA was performed. Post-hoc tests of significant results from the ANOVA used Tukey honest significant difference (Tukey HSD).
Predicting categorical variables
An LDA analysis was conducted using the MASS package (Venables & Ripley, Citation2002) by constructing the two models and using the three categorical variables for the prediction of class membership. More specifically, LDA is a data reduction technique that looks for the linear combinations of variables that best model the differences between classes. The LDA does so under the assumption that observations come from a multivariate normal distribution sharing the same covariance. The analysis can be said to consist of two steps: the first step is to train the model and the second step is to use the model to predict class membership. Predictors consist of continuous independent variables and the dependent variable is a categorical or class variable. In this study, respondents’ trait scores from one DMIRT model, e.g., sample 1 and Model 1, were used as training data to predict respondents’ political affiliation in the other sample belonging to the other model, that is, Sample 2 and Model 2, and vice versa. This resulted in two LDA models: LDA 1 and LDA 2.
Factor loadings on the linear discrimination functions and proportion of trace are reported, along with the two models’ level of accuracy, Cohen’s κ coefficient, and the no information rate (NIR). The latter tests the assumption that a model can contribute significantly to the classification accuracy when removing the impact of the known distribution of the predictor variables. Cohen’s κ gives an estimation of the level of agreement of classification to the true class on the models. The following criteria have been suggested: a κ of < 0 is less than chance agreement, 0.01–0.20 is slight agreement, 0.21–0.40 is fair agreement, 0.41–0.60 is a moderate agreement, 0.61–0.80 is a substantial agreement, 0.81–0.99 is an almost perfect agreement. In addition, sensitivity, i.e., the probability of true positives, specificity, and the probability of true negatives are reported as well as the confusion matrix for both models.
Results
Part I
Exploratory factor analysis
In , we see that the limit for acceptable fit, following the criteria for SRMSR, is reached when assuming that three factors exist in the data. However, a notable drop in the RMSEA and the SRMSR can be observed moving from three to four factors in both samples, and the latter also seems to reach a plateau at four factors or more. Studying item loadings, however, indicates that four or more factors only add nuisance factor loadings (not reported) that, on the one hand, improve fit but, on the other hand, make the factor structure ambiguous. Assuming that the data hold three factors ( and ), however, did not indicate such issues. Thus, with the aforementioned in mind, also considering that EFA does not account for within-multidimensionality in the items that may cause a misfit to the factor projection, three factors were decided to be the most optimal case.
Table 1. EFA fit indices for the ERS-C.
Table 2. EFAa factor loadings for the ERS-C.
Table 3. EFA factor correlations for the ERS-C.
Item factor loadings and descriptives are reported in . Overall, the distribution of factor loadings does not indicate serious cross-loading tendencies, with the possible exception found in item AR4, loading on F1 and F2 in both samples.
Studying the factor loadings and the content of the strongest loading items motivated labeling factor F1 Compassion, factor F2 Conformity, and factor F3 Collectivism. It might also be mentioned that the former two factors seem to dominate the model having very similar rotated sum of squares factor loadings and are on average almost uncorrelated to each other (). The Collectivism factor, on the other hand, correlates with both dominating factors, but more so with the Conformity factor in particular.
Scale identification
Studying the scale identification table for the AISP ( and ), we can see a clear tendency for the items to split into two scales. This is evident already at c = 0 up to about c = 0.4. On higher levels of c, we see substructures appearing and an increasing number of items being reported as unscalable. Studying the item content, however, suggests that these substructures may be the result of strong item content similarity and not necessarily differences in latent variables.
Table 4. AISP for the ERS-C in sample 1.
Table 5. AISP for the ERS-C in sample 2.
Comparing the factor structure in the EFA () with the scale identification in the AISP ( and ), we find interesting similarities that should be mentioned. For instance, we see the same items separating into the two dominating structures of Compassion and Conformity in both types of analyses. In the AISP, however, Collectivism seems nested in the Conformity scale up to about c = 0.45. From that point on, however, the Collectivism substructure becomes discernible and two of the Collectivism items survive up to c = 0.7 in both samples.
Thus, the AISP replicates the same overarching latent structure in the data but also motivates a need to investigate the ambiguity in the Collectivism items further. To do this, item and test scalability was assessed on four different combinations of items ( and ): Scale 1 contained all items from the Compassion factor, Scale 2 contained all items from the Conformity factor, Scale 3 combined all items excluding the items from the Collectivism factor, and lastly, Scale 4 combined the items from the Compassion factor and the Collectivism factor.
Table 6. Coefficient Hi on four latent scales.
Table 7. Scale properties.
As can be seen, Scale 1 and Scale 2 perform well on all estimates ( and ). All consistency estimates are high and the Omega hierarchical indicates a clear presence of a common factor in both scales. The two scales are also medium in scalability, thus reliable for ordering respondents on the level of trait and all items have a scalability of ≥ 0.3.
Regarding Scale 3, however, less surprising, there is a notable drop in the Omega hierarchical (), which is somewhat observable in the alpha and the Omega total coefficient as well. Moreover, following convention, the coefficient H indicates that the scale is unreliable for ordering respondents on the level of trait and only two items in the scale achieve a scalability of ≥ 0.3 ().
In contrast, Scale 4 has alpha and Omega total scores on par with Scale 1 and Scale 2, and the common factor is approaching similar levels of strength as the just mentioned scales (). All items in the scale have an Hi ≥ 0.3 and the scale is medium in scalability, even if the H score is slightly reduced in comparison to Scale 1 and Scale 2 (). Thus, the results imply that the Collectivism items can order respondents on level of trait reliably when combined with the Conformity items or combined with the Compassion items, respectively. The difference in statistical fit is marginal.
D3mirt models
In and and and we can see the results of the model estimation (interactive models are available in the supplementary section). In the analysis, construct vector arrows were added following the loading structure observable in the EFA () and item vector locations in ( and ). That is, items loading on Compassion, Conformity, and Collectivism were grouped to orient the respective construct vectors. Regarding the Conformity construct, however, all items loading on the factor were used except item AR4. This was because of the items’ strong within-multidimensionality tendencies, foremost observable in ( and ) in which it can be seen that the item approaches a 45◦ orientation between the x and y-axes. In other words, the item is not exclusive to Conformity, nor is it exclusive to Compassion. Note that the same item also had the highest cross-loaded tendencies of all items in the EFA analysis (). Consequently, the item is not informative to the content of the constructs in the model.
Figure 1. The ERS-C Model for sample 1 in four perspectives.
Figure 2. The ERS-C Model for sample 2 in four perspectives.
Table 8. DMIRT indices for sample 1.
Table 9. DMIRT indices for sample 2.
Studying and and and , we see no serious signs of misfit in the items to the assumptions of the DMIRT model. All MDISC estimates follow a similar range in both samples, also observable when comparing item vector arrow length. That is, we find no item vector arrows being obviously shorter in comparison. We also see no overly stretched MDIFF range, neither numerically nor graphically, that often accompanies low discrimination scores and high amounts of model violations. In and it is also observable that the item locations are very similar in both samples.
Regarding the dimensionality, we find interesting patterns. Firstly, the two dominating factors from the EFA ( and ) are observable as clusters of item vector arrows approaching an orthogonal separation ( and ). More specifically, when averaging the orientation of the items, we find Compassion at θ = 2.407◦ and φ = 93.997◦ in Model 1, and θ = 2.368◦ and φ = 97.212◦ in Model 2. It can also be seen that the Compassion items display a consistent orientation and discrimination in the model ( and ; and ).
In the opposite direction, we find Conformity on average located at θ = 24.704◦ and φ = 9.269◦ in Model 1, and θ = 23.000◦ and φ = 16.241◦ in Model 2. Looking at the Conformity items themself, however, we see more location inconsistencies in comparison to Compassion ( and , and ). This seems mostly to be due to some of the items having the high capacity to discriminate along the spaces spanned by both the Conformity items and the Collectivism items. This is a probable source of the less optimal fit reported in the EFA () since the presence of within-multidimensionality in the items is likely to disrupt the variance decomposition in the factor analysis.
We should also mention item AR4, which was not included in the Conformity construct because of the items within-multidimensional tendencies. The latter can be corroborated by looking at the DDISC estimates, which are very similar regardless of construct ( and ). We should note, however, that neither the maximized nor constrained discrimination scores for the item are weak in comparison, therefore not implying model misfit.
Lastly, and in contrast to all of the just mentioned, we find the Collectivism items on average located at θ = 62.011◦ and φ = 54.892◦ in Model 1, and θ = 58.759◦ and φ = 56.436◦ in Model 2, occupying the area over the z-axis. However, no item clearly aligned with any axis exclusively in the model space. This is also reflected in the discrimination scores ( and ), i.e., all items show at least some capacity to order respondents on level of trait in all directions set by all constructs. The latter effect, however, seems stronger along the Conformity vector orientation.
Looking at the graphs we also see, in and , that the characteristic of these four items is clearly within-multidimensional with respect to both the z and y-axes ( and ), and the x and z axes ( and ), in both models, respectively. Even more interestingly, however, , and present a semantic spectrum, relevant for our study, ordering these four items. That is, starting from the y-axis and moving toward the x-axis, we see the items falling in the order LR2 and LR3, followed by LR1 and LR4. Translating this into semantic content, we find a shift in ingroup authority construed as showing a lack of loyalty or betraying the group for the conformative, to abandoning the group and hurting the group for the compassionate.
Taken together, the results of the internal analysis in the two samples indicate a slightly complex internal structure on item-level that nevertheless seems reducible to three dimensions. In general, all items perform well but the orientation in the models shows that foremost the Collectivism items, just as with some of the items from Conformity, can order respondents on multiple traits ( and ). This is a likely source of misfit in the EFA (). Indeed, an EFA assuming two factors with the Collectivism items removed improved the generalizable fit in both Sample 1 (SRMSR = 0.060) and Sample 2 (SRMSR = 0.061).
Part II
ANOVA
For the next part of the study, the respondents were separated on political affiliation, resulting in three groups: respondents affiliated with the Republican Party (henceforth Republican; Sample 1: N = 420, Sample 2: N = 413), the Democratic Party (henceforth Democrat; Sample 1: N = 518, Sample 2: N = 499) or registered as an independent (henceforth Independent; Sample 1: N = 426, Sample 2: N = 399). Respondents affiliated with some other political organization, or not politically affiliated, or that had not provided any such information, were removed from this part of the analysis.
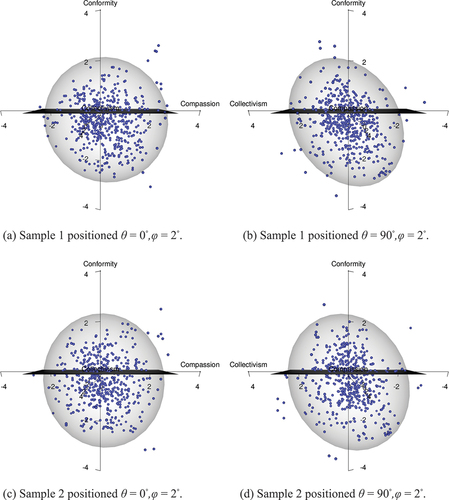
The mean values and spread for the trait levels in all groups are reported in and the respondent’s scores are also visualized as spheres in to , oriented in the model space with the help of respondents’ trait scores used as coordinates (interactive models are available in the supplementary section). In the figures, the upper two plots graph respondent trait scores from Sample 1, and the lower two plots graph respondent trait scores from Sample 2, in which upper and lower plots are displayed rotated θ = 0◦ and θ = 90◦.
Figure 3. Republican respondents in the ERS-C Model.
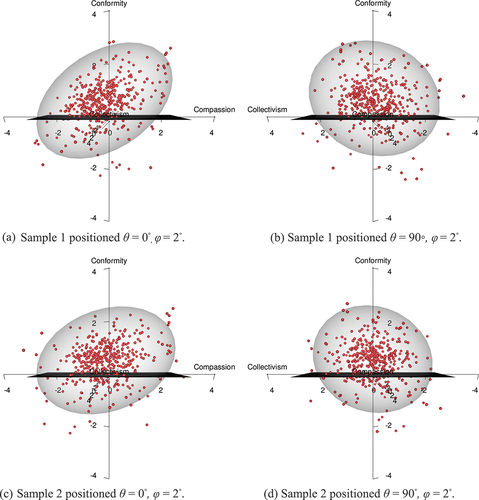
Table 10. Descriptives for respondent ERS-C trait scores.
The spheres in to indicate a large spread within each political group. The shift in the respondent’s location on Conformity, when moving from Republicans () to Independents (), and lastly to Democrats (), is clearly discernible. The higher levels of Compassion for the Democrats () can also be seen when comparing plots to the Independent () and the Republican (), even if the differences are not as clear as in the previous case. Studying Collectivism, however, when rotating the models 90°, shows no difference in the distribution of trait scores in the latent space.
Figure 4. Independent respondents in the ERS-C model.
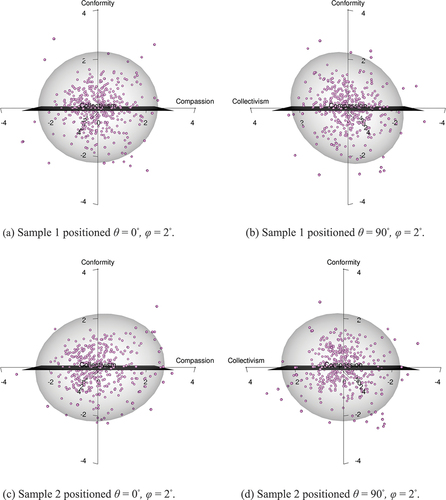
Figure 5. Democratic respondents in the ERS-C Model.
The results of the ANOVA models are reported in . Foremost, we find significant group differences in both samples on Compassion and Conformity. Post hoc tests using Tukey HSD show that Republicans are significantly lower on Compassion compared to Democrats (Sample 1: t = 7.035, p < .001, 95% CI [0.274, 0.549], Sample 2: t = 4.286, p < .001, 95% CI [0.118, 0.402]) followed by Independents (Sample 1: t = 3.091, p = .006, 95% CI [0.046, 0.333], Sample 2: t = 2.592, p = .026, 95% CI [0.016, 0.316]). Independents are, in turn, significantly lower than Democrats (t = −3.812, p < .001, 95% CI [−0.359, −0.085]) on the same trait, but only in Sample 1. Regarding Conformity, Republican affiliates are significantly higher compared to Democrats (Sample 1: t = −18.121, p < .001, 95% CI [−1.129 − 0.870], Sample 2: t = −16.001, p < .001, 95% CI [−1.027, −0.765 ]) followed by Independents (Sample 1: t = −9.904, p < .001, 95% CI [−0.708 − 0.437], Sample 2: t = −8.699, p < .001, 95% CI [−0.653, −0.375 ]). Independents are also higher compared to Democrats on the same trait in both samples (Sample 1: t = 7.779, p < .001, 95% CI [0.299, 0.556], Sample 2: t = 6.757, p < .001, 95% CI [0.249, 0.515]).
Table 11. ANOVA models on three types of moral styles.
Linear discriminant analysis
The overall accuracy for both LDA models is within a fair margin, with Model 2 (Accuracy = 0.540, 95% CI [0.513, 0.567], κ = 0.299) performing slightly better than Model 1 (Accuracy = 0.491, 95% CI [0.463, 0.518], κ = 0.222). The NIR was significant and very similar in both models (Model 1: NIR = 0.381, p < .001; Model 2: NIR = 0.380, p < .001). Thus, the models add to our predictive ability over and above the known distribution of classes.
Studying the Linear discriminant functions (), it can be observed that the first proportional trace accounts for almost all of the predictive strength in the models. In turn, the predictive strength seems mostly to be related to the strong negative loading from the Conformity variable on the discriminant functions LD1 and LD2, clearly dominating the models followed by Compassion and lastly Collectivism.
Table 12. Discriminant loadings.
Regarding response rates, the sensitivity, specificity, and confusion matrix scores were similar in both models ( to ). Foremost, the capacity to discriminate between true positives or true negatives, i.e., on specificity and sensitivity, is adequate regarding the Republicans and the Democrats (). In the confusion matrices ( and ) the fairly low rate of false positives, i.e., the rate at which the models falsely predicted a Republican or Democrat to be affiliated with some other party in the model, can be seen. For the Republicans, this was the case in 36.32% (LDA 1) and 22.62% (LDA 2) out of all possible cases in each sample, respectively. For the Democrat, this was the case in 34.87% (LDA 1) and 24.52% (LDA 2) out of all possible cases in each sample, respectively.
Table 13. Response rates for the LDA models.
Table 14. Confusion matrix for LDA 1.
Table 15. Confusion matrix for LDA 2.
However, it can also be observed that the rate of false negatives for both groups was higher. More specifically, out of 521 (LDA 1) and 601 (LDA 2) predictions that a respondent was a Republican, 49.52% (LDA 1) and 45.92% (LDA 2) cases were incorrect. Likewise, out of 623 (LDA 1) and 693 (LDA 2) predictions that a respondent was a Democrat, 47.83% (LDA 1) and 43.58% (LDA 2) cases were incorrect.
Predicting Independents, however, showed very different results. The sensitivity was low, but the specificity was high in both models (). The former can be observed in Confusion matrices ( and ) in which the score for true positives is low and very similar to the rate of false negatives. Regarding the latter, the LDA models made fewer predictions compared to the previously mentioned. parties that a respondent was an Independent: the LDA 1 made 167 predictions and the LDA 2 model made 70 predictions. Out of these, we find 67.07% and 70.00% incorrect predictions, respectively. The rate of false positives was 86.22% (LDA 1) and 95.07% (LDA 2), respectively, out of all possible cases. Thus, we see high error rates regarding the mislabeling of Independents.
It should also be mentioned that the confusion matrices in and highlight that the reduced sensitivity seems connected to the confounding of the Independent and the Democrat, more than a confounding between the Independent and the Republican, if we study the misclassification rate following the opposite direction of the prediction path. That is, the error rate for mislabeling an Independent as a Democrat is higher than for mislabeling an Independent to be a Republican.
Discussion
This study set out to investigate the properties of the ERS-C in dual samples using DMIRT analysis, implemented in the D3mirt package (Forsberg, Citation2023) for R (R Core Team, Citation2023). Overall, the results show that DMIRT methods offer a unique insight into the structure of the item data, that the results replicate, and that the method can be used to provide a psychometric answer to empirical questions.
Looking internally, it could, for instance, be observed that neither the EFA () nor the non-parametric IRT ( and ) could fully account for the complex nature of the questionnaire: the EFA reported three or more factors () and the AISP indicated two ( and ). Turning to DMIRT, however, qualified the results and corroborated our expectation by showing that the data should be reduced to holding the two unidimensions of Compassion and Conformity and the within-multidimension of Collectivism ( and ). It could, however, be said that all methods just mentioned are complementary. We think this especially applies to the combination of MSA and DMIRT because while the former identifies latent scales the latter visualizes them, and they both utilize the assumptions of unidimensionality, monotonicity, and local independence.
Next, the psychometric analysis found support for our hypothesis that the original Loyalty foundation from the Relevance subscale could be expanded. The addition of the new collectivism items not only filled an empty space, quite literally observable in and , but it even helped form a semantic spectrum, much in line with our expectations. Namely, the content of the Collectivism items could be seen to order themself following authoritarian to authoritative-styled ingroup thinking. It should be noted that this structure replicated and would, we assume, go undiscovered using other methods.
Looking externally, we find more results that match our expectations and the literature on MFT at large. For instance, when observing group-level differences on level of trait, the strongest effects are found on Conformity followed by Compassion (). The Republicans are the highest on Conformity and the lowest on Compassion, while the opposite holds true for the Democrats and the Independents occupy a middle ground (). This resembles empirical results previously reported in Graham et al. (Citation2011), Graham et al., (Citation2009), and Haidt (Citation2012), even if the analytical approach used in this paper is new. However, in contrast to the just mentioned sources, and just as we hypothesized, we find no significant difference in Collectivism between the political groups. The explanation for this outcome is, we suggest, related to the one-sided construction of the Collectivism variable that can make it seem as if the latter is more preferred by the conformative when using more common linear psychometric models.
Moreover, on the topic of group differences, we should also mention the spread of respondents’ location in the model space, visualized in (). That is, even if group-level trends could be seen, both visually and statistically, the figures also illustrate that political labels may not always be informative in the individual case. In extension, this raises suspicion to the postulate that the conservative has a wider moral scope embracing all moral foundations, while the liberal has a more narrow scope foremost embracing values of compassion and fairness exclusively, as suggested by Haidt (Citation2012). In contrast, our result indicates that political labels hide much complexity and should not be assumed to form a homogenous union.
Next, the results from the LDA show that the models can be used, at least to some extent, to correctly predict political affiliation regarding the two major American parties (). This is less surprising, considering that both theory and questionnaire were originally developed for this purpose (Graham et al., Citation2009). However, the effect in the LDA is, just as in the ANOVA, mostly related to the Conformity variable () in our analysis. Accordingly, the conclusion must be that what separates the Democrats and the Republicans most efficiently, from the perspective of these measurement models, is the presence of conservative values, and not values of empathy and ingroup thinking.
Regarding the independent voter, however, the models seem much more confused and the results indicate that the independent voter is barely detectable (). A speculative answer to this outcome could take two routes: on the one hand, we could argue that this is the nature of the Independent, i.e., to occupy a middle moral ground and is therefore hard to discern regardless of model. On the other hand, we could also argue that the models may be insufficient for mapping the moral profile of American voters. We choose the latter.
We should also mention the observation that the independent voter seems more aligned with the moral profile of the Democrat in the LDA ( and ). Thus, the results indicate that the Republican tend to be more exclusive in preferring conformative values compared to the other two groups. This, however, needs more investigation and we suggest, also considering what has been said in the previous paragraph, to elaborate on the more moral content of the models.
On a last note, studying our results, it is essential to keep in mind that DMIRT assumes that within-multidimensionality is a characteristic of items and not in itself a sign of measurement errors. Thus, the within-multidimensionality reported in, for instance, item AR4 and the Collectivism items is not an indication that the items are bad. Instead, given that no other indications of model misfits can be observed (such as noticeably low discrimination scores or extreme stretch of the MDIFF range), the conclusion is that these items are good items that happen to have a within-multidimensional characteristic.
In addition, we also argue that the within-multidimensionality can even enlighten us on the psychometric characteristics of the items, not easily seen from a single analytical perspective. For example, we suggest the following. The item AR4, “…an action caused chaos or disorder”, is within-multidimensional because it is a neutral statement in terms of the dominating dimensions. That is, the content of the item can be construed from the perspective of Compassion (chaos as harm) and Conformity (chaos as a violation of order). Next, Collectivism is within-multidimensional because ingroup thinking follows with respondents’ tendency to be compassionate (collectivism as care) or confirmative (collectivism as obedience). The results, therefore, indicate that this dimension most likely functions differently because it is not fully independent, at least not when Compassion and Conformity are introduced in the model.
In extension, the notion that a trait dimension can be within-multidimensional may have implications even outside the context of this study, simply because these results hint that we should not assume ‒ nor require ‒ that all latent dimensions have similar characteristics a priori. This proposition, however, needs more investigation and Nevertheless, the general point is that it is up to the researcher to decide, in light of theory and statistical results, whether the within-multidimensionality in question is an issue or not.
We should also mention that our study was limited to an American cultural context. We, therefore, encourage cross-cultural replication following a similar design. Our method of choice for constructing our models, is also largely unexplored on data of this type. It is therefore essential to do more studies using this method, and corroborating and contrasting outcomes, not only on moral differences but also on personality differences in general.
Ethics approval
The design of this study has been reviewed by the Swedish Ethical Review Authority (Dnr 2021–01395). However, according to Swedish law, ethics approval is not required because the data collection does not imply an intervention or collection of personal data in the sense that the §§ 3–4 in the Swedish Ethics Review Act (2003:460) refers to.
Supplemental Material
Download HTML (3.7 MB)Acknowledgments
We would like to express our deepest gratitude to Professor Torun Lindholm Öjmyr and Professor Mats Nilsson, Stockholm University, for their support and professional advice.
Disclosure statement
No potential conflict of interest was reported by the author(s).
Data availability statement
The datasets analyzed during the current study are available in the OSF repository, at https://osf.io/52ra8/?view_only=7bb2c86bad77427cad9b853412c6a029.
Supplementary material
Supplemental data for this article can be accessed online at https://doi.org/10.1080/15366367.2023.2282418.
Additional information
Funding
Notes
1. MSA also includes the doubly monotonicity model that assumes non-intersecting response functions for the trace lines that allow for testing of invariant item ordering. The latter implies that the items in a scale follow a hierarchical order based on item difficulty. However, since invariant item ordering is not an assumption of the ERS-C, the DMM doubly monotonicity model will not be used.
References
- Cai, L., & Hansen, M. (2013). Limited-information goodness-of-fit testing of hierarchical item factor models. The British Journal of Mathematical and Statistical Psychology, 66(2), 245–276. https://doi.org/10.1111/j.2044-8317.2012.02050.x
- Cai, L., & Monroe, S. (2014). A new statistic for evaluating item response theory models for ordinal data. Technical report, National Center for Research on Evaluation, Standards, and Student Testing.
- Chalmers, R. P. (2012). Mirt: A multidimensional item response theory package for the R environment. Journal of Statistical Software, 48(6), 1–29. https://doi.org/10.18637/jss.v048.i06
- de Ayala, R. J. (2009). The theory and practice of item response theory. Guilford Press.
- Forsberg, E. (2023). D3mirt: Descriptive 3D multidimensional item response theory Modeling (R package version 1.1.0) [Computer software]. Department of Psychology, Stockholm University. https://CRAN.R-project.org/package=D3mirt
- Forsberg, E., & Sjöberg, A. (2021). Tracing morals: Reconstructing the moral foundations questionnaire in New Zealand and Sweden using mokken scale analysis and optimal scaling procedure. Journal of Applied Measurement, 22(1/2), 60–82.
- Graham, J., Haidt, J., & Nosek, B. A. (2009). Liberals and conservatives rely on different sets of moral foundations. Journal of Personality & Social Psychology, 96(5), 1029–1046. https://doi.org/10.1037/a0015141
- Graham, J., Nosek, B. A., Haidt, J., Iyer, R., Koleva, S., & Ditto, P. H. (2011). Mapping the moral domain. Journal of Personality & Social Psychology, 101(2), 366–385. https://doi.org/10.1037/a0021847
- Haidt, J. (2012). The righteous mind: Why good people are divided by politics and religion. Pantheon/Random House.
- Haidt, J., & Joseph, C. (2004). Intuitive ethics: How innately prepared intuitions generate culturally variable virtues. Daedalus, 133(4), 55–66. http://www.jstor.org/stable/20027945
- Hemker, B. T., Sijtsma, K., & Molenaar, I. W. (1995). Selection of unidimensional scales from a multidimensional item bank in the polytomous mokken irt model. Applied Psychological Measurement, 19(4), 337–352. https://doi.org/10.1177/014662169501900404
- Hu, L., & Bentler, P. M. (1999). Cutoff criteria for fit indexes in covariance structure analysis: Conventional criteria versus new alternatives. Structural Equation Modeling, 6(1), 1–55. https://doi.org/10.1080/10705519909540118
- Joseph, C. M., Graham, J., & Haidt, J. (2009). The end of equipotentiality: A moral foundations approach to ideology-attitude links and cognitive complexity. Psychological Inquiry, 20(3), 172–176. https://doi.org/10.1080/10478400903088882
- Kuijpers, R. E., van der Ark, L. A., & Croon, M. A. (2013). Standard errors and confidence intervals for scalability coefficients in mokken scale analysis using marginal models. Sociological Methodology, 43(12), 42–69. https://doi.org/10.1177/0081175013481958
- Maydeu-Olivares, A. (2017). Assessing the size of model misfit in structural equation models. Psychometrika, 82(3), 533–558. https://doi.org/10.1007/s11336-016-9552-7
- McDonald, R. P. (1999). Test theory: A unified treatment. Lawrence Erlbaum Associates Publishers. https://doi.org/10.4324/9781410601087
- Mokken, R. J. (1971). A theory and procedure of scale analysis. De Gruyter Mouton.
- R Core Team. (2023). R: A language and environment for statistical computing. R Foundation for Statistical Computing. https://www.R-project.org/
- Reckase, M. D. (1985). The difficulty of test items that measure more than one ability. Applied Psychological Measurement, 4(9), 401–412. https://doi.org/10.1177/014662168500900409
- Reckase, M. D. (2009). Multidimensional item response theory. Springer-Verlag. https://doi.org/10.1007/978-0-387-89976-3
- Reckase, M. D., & McKinley, R. L. (1991). The discriminating power of items that measure more than one dimension. Applied Psychological Measurement, 4(15), 361–373. https://doi.org/10.1177/014662169101500407
- Revelle, W. (2023). Psych: Procedures for psychological, psychometric, and personality research ( R package version 2.3.6) [Computer software]. Northwestern University. https://CRAN.R-project.org/package=psych
- RStudio Team. (2023). RStudio: Integrated development environment for R. RStudio, PBC. http://www.rstudio.com/
- Sijtsma, K., & van der Ark, L. A. (2017). A tutorial on how to do a Mokken scale analysis on your test and questionnaire data. The British Journal of Mathematical and Statistical Psychology, 70(1), 137–158. https://doi.org/10.1111/bmsp.12078
- Van der Ark, L. A. (2007). Mokken scale analysis in R. Journal of Statistical Software, 20(11), 1–19. https://doi.org/10.18637/jss.v020.i11
- Van der Ark, L. A. (2012). New developments in Mokken scale analysis in R. Journal of Statistical Software, 48(5), 1–27. https://doi.org/10.18637/jss.v048.i05
- Venables, W. N., & Ripley, B. D. (2002). Modern applied statistics with S (4th ed.). Springer. https://www.stats.ox.ac.uk/pub/MASS4/