
 ?Mathematical formulae have been encoded as MathML and are displayed in this HTML version using MathJax in order to improve their display. Uncheck the box to turn MathJax off. This feature requires Javascript. Click on a formula to zoom.
Abstract
Incorporating lightweight aggregate (LWA) in concrete decreases its density. The high porosity of LWA contributes to low density but also high absorption characteristics. LWA absorbs water even in a freshly mixed concrete mixture when their pore is not fully filled with water. On the contrary, an excessive saturation of LWA causes release of bleed water. Both situations make the concrete mixture unstable. Equilibrium in Laplace pressures between LWA and the surrounding cement binder determines the water absorption or desorption inside a fresh mix of lightweight aggregate concrete. A physical model derived from the pressure balance is proposed, and well predicts the water transport of LWA.
1. Introduction
Lightweight aggregate concrete (LWAC) has the merit of low density, which results in decreasing the self-weight of structural concrete by more than 20% [Citation1]. It is advantageous for high-rise buildings and long-span bridges. In addition, internal curing using water-filled lightweight aggregate (LWA) is effective to mitigate autogenous shrinkage and early-age cracking of concrete. The high porosity of LWA, compared to that of normal-weight aggregate, provides these benefits.
The high porosity is, however, detrimental with regard to the mixing and workability of LWAC. When the pore of LWA is not fully filled with water beforehand, it can absorb some water in a fresh mix of LWAC. The water transport to LWA inside makes the LWAC vulnerable to slump loss as well as inhomogeneous mixing. Sound mixing and placement of LWAC are hardly expected without the prewetting of LWA. Controlling the initial water content of LWA is more important for producing self-consolidating LWAC [Citation2–5]. A lack of prewetting obviously decreases its fluidity. Furthermore, a shortage of the water content in the LWA greatly decreases the workability of LWAC and reduces the effect of internal curing [Citation6–8].
The unstable state of saturated LWA makes it difficult to obtain precise control unfortunately. LWA at a saturated-surface-dry (SSD) condition may release water even in atmospheric pressure. The resultant bleeding of the saturated LWA makes LWAC unstable and even segregated when it is incorporated. Field engineers have adapted the undesirable phenomena associated with LWA. They define the apparent saturation for a given LWA sample, which is slightly less than the “ideal” water absorption value. The partially saturated LWA is expected to absorb mixing water in a concrete mixture. The amount of mixing water for the concrete production is, therefore, increased considering the additional water absorption of LWA in a fresh concrete mixture.
The absorption and desorption of LWA “in concrete” are significant not only for the mixture quality control but for the efficiency of internal curing. A previous study investigated the water transport inside early-age concrete, and the moisture content of LWA and relative humidity of the surrounding paste matrix were found to determine the absorption and desorption in the early-age concrete, where the concrete was set [Citation6]. Water transport in a fresh concrete mixture, before its set, is naturally different. The present article proposes a physical model to quantitatively evaluate the water absorption of partially saturated LWA in the environment of a fresh concrete mixture. Equilibrium of the pore water pressure between LWA and the surrounding cement paste determines the amount of the water absorption or desorption. The model prediction requires the porosity of the LWA, and, therefore, a procedure for calculating it together with the oven-dried (OD) density is also proposed.
2. Modeling approach
2.1. Equilibrium of the pore water pressure
In this section, we initially define the pore water pressures of LWA and cement paste based on the theory of poroelasticity [Citation9, Citation10]. The capillary rise of LWA considers its moisture content, which is less than the “ideal” water absorption level (full capacity). Full water saturation in an LWA particle having a volume of serves to define its water absorption of
(1)
(1)
where
and
are the density of water and the solid-phase density of the LWA particles, respectively. The porosity
a microstructural property, is the volume fraction of void in the LWA particles. Partial saturation in LWA is described by the degree of capillarity. Describing the mean meniscus radius of
in an LWA particle allows us to evaluate the capillary pore volume by
where
and
are the capillary rise and contact angle of water, respectively. The moisture content of LWA then specifies the partial saturation by
(2)
(2)
and its value is limited by the water absorption: M ≤ Q. The notional capillary rise is then given by
(3)
(3)
where
is the capillary constant of water. A lower moisture content (M) of LWA results in a higher level of capillary suction (
).
On the other hand, freshly mixed cement paste is subjected to matric and osmotic suction. Negative pressure consequently originates from immature capillaries among the cement grains (matric suction) and dissolved ions in pore solution (osmotic suction). Mixing water beyond the negative pressure becomes bleed water; so, the matric and osmotic suction contributes to the water retention of cement paste. Given that pore in cement paste is fully filled with mixing water, the water-filled pore volume of the cement paste becomes with a critical porosity of
and a paste volume of
Like the capillary pores in LWA, describing an apparent meniscus radius of rp for cement paste allows us to evaluate the pore volume by
where
and
are the notional capillary rise and contact angle of water in the cement paste, respectively. Finally, the notional capillary rise in the critical state of cement paste is given by
(4)
(4)
A lower critical porosity (), equivalent to the water-to-cement ratio (w/cm), of cement paste brings a higher pore suction point (
). The pore water pressure is generally negative for a stable cement paste [Citation11].
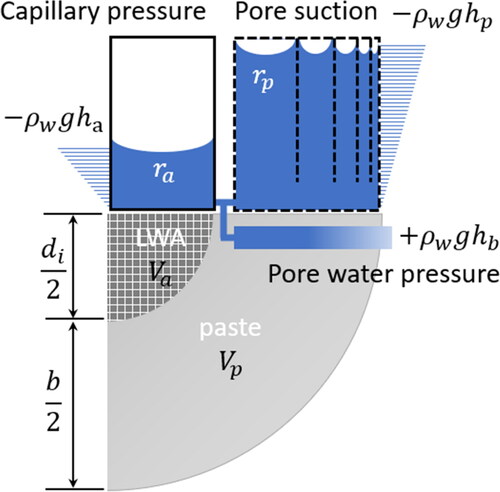
Water transport between LWA and cement paste originates from equilibrium in the pore water pressure. shows the conceptual distribution of the pore water pressure in LWAC, and the water transport from cement paste to LWA is expected with The pore pressure difference is opposite:
for internal bleeding [Citation6–8]. The absorbed water in LWA has been transported to the surrounding cement binder after the mixing water was partially consumed by cement hydration (setting of concrete). The Equilibrium between the suction pressures of LWA and the cement paste imposes
in EquationEqs. (3)
(3)
(3) and Equation(4)
(4)
(4) , which results in
(5)
(5)
Figure 1. Conceptual illustration of porosity in LWAC.
Here, two relative variables are introduced: is the ratio of the contact angle of water and
is the effective volume ratio of the cement paste and LWA. The critical porosity of paste (
) is consequently dependent on the LWA moisture content (
) at an equilibrium state.
In addition, keeping the total pore water in LWA and cement paste constant in a mixture, the mass conservation of water enforces
(6)
(6)
where
is the initial moisture content of LWA and
is the initial porosity of the cement paste. The latter is related to the proportioned w/cm,
(7)
(7)
where
is the density of cement grains, assuming that water fully fills the pore volume of paste and no bleeding occurs. Solving EquationEqs. (5)
(5)
(5) and Equation(6)
(6)
(6) simultaneously gives
(8)
(8)
and
(9)
(9)
for the moisture content of LWA and the porosity of the cement paste, respectively. Excess pore water (positive pressure of
) reserved in the bleed-water channel [Citation11–14], if developed, is firstly consumed for the additional water absorption of dry LWA in a mix. For the calculation, the initial moisture content of LWA is summed corresponding to the pore water head of
Take
by applying
instead of
into EquationEq. (2)
(2)
(2) . The remaining pressure in the bleed-water channel contributes to formwork pressure exerted by fresh concrete [Citation15, Citation16].
2.2. Determination of the state variables
The porosity () and solid-phase density (
) in EquationEq. (8)
(8)
(8) are the material properties of LWA. Among these two properties, the latter can be measured with the ground powder of LWA. The porosity of LWA is then calculated by
(10)
(10)
where
is the OD density of LWA. The conventional method for the OD density measures the volume of an aggregate sample at its SSD condition. However, it is not reliable for LWA because its SSD condition is not stable. In this study, the OD density is alternatively determined by
(11)
(11)
where
and
are the unit weight (or called bulk density) and the packing density, respectively, of LWA at an OD condition. The unit weight of LWA can be measured following ASTM C29 [Citation17], while its packing density is evaluated by the compressible packing model [Citation18, Citation19].
The aforementioned model [Citation18, Citation19] calculates the packing density based on the grading curve of LWA. From the results of a sieve analysis [Citation20], LWA grains are classified by their size. The nominal diameter () for i-class grains can take the average of two sequential sieves’ openings, and residue on each sieve confirms their mutual volume fractions (
). The ideal packing density refers the maximum volume fraction (theoretical-full packing) with each class of grains, and it can be predicted by a percolation theory. The compaction index releases the ideal packing density according to
(12)
(12)
where
is the ideal packing density for i-class grains. The compaction index of
is a variable used to control the packing state. Finally, the packing density is determined by the minimum value among the potential packing states in which i-class grains (
) are dominant:
(13)
(13)
Here, is the packing density when i-class grains are dominant for the packing. The interaction between i-class and j-class grains is described by the wall-effect and loosening-effect coefficients,
and
respectively. These coefficients were experimentally evaluated using dry aggregates [Citation21], which resulted in
(14)
(14)
(15)
(15)
The packing of ISO standard sand [Citation22] is evaluated here as an example. Its OD density and unit weight are 2,610 and 1,722 kg/m3, respectively, which results in = 0.66 from EquationEq. (11)
(11)
(11) . The grading of the standard sand is regulated; the passing percentages through a 0.08, 0.16, 0.50, 1.60, and 2.00 mm sieve are 1%, 13%, 33%, 97%, and 100%, respectively. Given that i-class grains are assumed to be spherical and monodisperse, the ideal packing density of each class is constant regardless of their diameters (
):
on random close packing [Citation23]. Note that either the prolaticity or dispersity for i-class grains can increase the ideal packing density, but here these factors are neglected for simplicity. As a result, EquationEq. (13)
(13)
(13) calculates the packing density of 0.85 with respect to infinite compaction (
). Matching the packing density with its measurement (
= 0.66) finally determines
using EquationEq. (12)
(12)
(12) . In other words, the dry-packing process on the measurement of the unit weight is evaluated by a compaction index of
It is smaller than that for rodding and vibrational compacting on freshly mixed concrete,
[Citation21].
In addition, the relative variables for the contact angle () and effective volume (
) must be specified. The wettability values of two inorganic materials, Portland cement and LWA, are presumably identical, which results in
The effective volumes, with which the pore suction of cement paste and the capillary pressure of LWA are associated, considers a paste layer on LWA particles. Given that a single shell-core sphere is assumed, as shown in , the effective volume ratio is calculated by
(16)
(16)
where
is the thickness of the paste-layer shell and
is the diameter of a core grain. The mean effective volume ratio can then be expressed by
(17)
(17)
using the mutual volume fraction
for i-class grains. The paste layer is equivalent to the interfacial transition zone (ITZ) around normal aggregates. The paste-layer thickness is dependent on the mix proportion, but for simplicity it is assumed to have a representative value, which is
in this study.
3. Experiments
3.1. Properties of lightweight aggregates
Two LWA samples labeled by A and B were investigated. Sample A was fine LWA originating from coal-combustion bottom ash. Its grading was controlled by crushing and sieving raw bottom ash. Sample B was coarse artificial LWA produced by sintering coal-combustion bottom ash and dredged soil, and its maximum size was 20 mm. reports the results of sieve analysis. The packing density and the mean effective volume ratio of each LWA sample could then be calculated from the grading curve () using EquationEqs. (13)
(13)
(13) and Equation(17)
(17)
(17) , respectively.
Table 1. Grading and packing density of LWA.
also reports the results of measurements of the unit weight () and solid-phase densities (
) of the LWA samples. The unit weight was measured following ASTM C29 [Citation17], and the solid-phase density was obtained from the powder sample. Each LWA sample was ground using a ball mill, after which the density of the powder sample that passed through a 75 μm sieve (#200) was measured in accordance with ASTM C188 [Citation24]. Finally, the porosity and OD density of each LWA could be calculated by EquationEqs. (10)
(10)
(10) and Equation(11)
(11)
(11) , respectively.
Table 2. Material properties of LWA.
3.2. Water absorption in cement paste
reports the mix proportion of the LWA-cement paste samples. The LWA-to-cement ratios by volume were set in the comparable range with that for a general LWAC mix. Oven-dried LWA was used to produce each mix, and each was mixed for 5 min using a planetary mixer. Type I Portland cement was used, and its density was 3,140 kg/m3.
Table 3. Mix proportion and test results of LWA-cement paste samples.
The water absorption of fine LWA (Sample A) in cement paste was measured by comparing the mortar flow with control mortar samples. The mortar flows were measured in accordance with ASTM C1437 [Citation25]. Control mortar samples were also produced with the same volume fraction (52%) of fine aggregates, but LWA was replaced with ISO standard sand [Citation22]. Three mortar samples were produced for which w/cm = 0.35, 0.40, and 0.45; their sand-to-cement ratios a/cm = 1.87, 2.01, and 2.15 by mass, respectively. Therefore, the corresponding water-to-sand ratios became w/a = 0.187, 0.199, and 0.209 by mass. Their mortar flows were measured by 175, 200, and 223 mm, respectively. shows the regression between w/a and the mortar flow, where the square filled points are the measurements of the control mortar samples. The regression curve allowed us to evaluate the corresponding (w/a)eq values of 0.173, 0.194, and 0.210 for the mortar flows of Sample A (square hollow points in ). On the other hand, the initial water-to-sand ratios were (w/a)0 = 0.381, 0.417, and 0.444, respectively, based on the mix proportions in . The water absorption measurements were consequently determined by M = (w/a)eq − (w/a)0; these values are reported in the column of measurements in .
Figure 2. Mortar flow and moisture content to evaluate the water absorption of LWA.
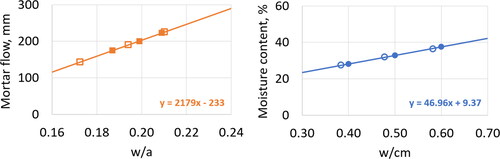
The water absorption of coarse LWA (Sample B) was evaluated using a method previously proposed in earlier work [Citation26, Citation27]. An LWA-cement paste sample in an equilibrium state was wet-sieved to remove coarse LWA. The moisture content of the wet-sieved paste could be measured using a moisture analyzer in accordance with ASTM D6980 [Citation28]. Here, the temperature was set to 170 °C. The moisture contents of the wet-sieved pastes are reported in . These measurements were compared to those of the control cement paste samples. Neat cement pastes were produced with w/cm = 0.4, 0.5, and 0.6 and the corresponding moisture contents were measured in the same way. shows the regression between w/cm and the paste moisture value, where the filled circular points represent the measurements of the neat cement pastes. The regression curve was applied to the measurements of Sample B (hollow circular points in ), and (w/cm)eq values of 0.384, 0.478, and 0.582 were then obtained corresponding to the proportions of (w/cm)0 = 0.4, 0.5, and 0.6, respectively. The water absorption of LWA was finally calculated using the equation of ((w/cm)0− (w/cm)eq)/(a/cm)0, which provides the measurements of the water absorption in .
The water absorption predictions required an evaluation of the initial porosity () of each mix. These values could be calculated by EquationEq. (7)
(7)
(7) , and the water absorption of LWA in each mix was finally predicted by EquationEq. (8)
(8)
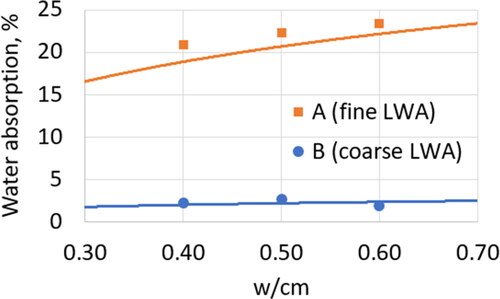
(8) . shows the prediction results for which w/cm ranges from 0.4 to 0.6. The measurements reported in are also plotted in the figure. The prediction error for fine LWA (Sample A) was less than 2%, while that for coarse LWA (Sample B) was less than 0.5%.
Figure 3. Water absorption of LWA in a freshly mixed paste.
4. Discussion
Conventional test methods following ASTM C127 [Citation29] or ASTM C128 [Citation30] are valid for normal-weight aggregates for which the water absorption should be less than 3.0%. These methods have been applied even for LWA samples showing a higher water absorption rates. However, the results are erroneous in that pre-wetted LWA up to its water absorption level (in an SSD condition) releases substantial bleed water into a mix. In other words, conventional test methods are inappropriate if used to measure the water absorption of LWA in a mix.
The erroneous measurement for LWA stems from the instability of its SSD condition. Equilibrium in an SSD condition imposes negative capillary pressure on LWA even in air, leaving it susceptible to the vapor pressure in the air. We can compare the balance of the Laplace pressure in terms of the capillary tension, from the Kelvin equation, which is dependent on the relative humidity (
). Here,
is the gas constant,
is the temperature, and
is the molar volume of vapor. High capillary tension at room humidity (RH < 95%) leads to the extraction of water from LWA, and so we can easily see bleeding of LWA supposedly at an SSD condition. The SSD condition assumed with LWA samples submerged for 24 h indicates a high capillary rise in LWA, but this dramatically decreases at typical room humidity levels.
The unstable SSD condition of LWA also results in scattered measurements. We measured the water absorption of the LWA samples using the conventional test method (by submerging them for more than 24 h). The variation of coarse LWA (Sample B) obtained by three experienced technicians was ±12% (16.3%, 18.6%, and 20.6%) of the mean value of 18.5% reported in a previous study [Citation27]. The variation of fine LWA (Sample A) was much greater at ±19% (22%, 27%, and 31%) of the mean value of 27%. The low reliability of water absorption measurements of LWA makes it vulnerable to retaining an SSD condition during the mixing process, which results in bleeding or additional water absorption in a mix.
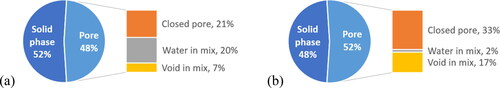
On the other hand, the total void volume, related to open and closed pores, of LWA is evaluated as the porosity according to EquationEq. (10)(10)
(10) . compares the total porosity and water absorption in a mix, where the mean of the measurements is reported. Conventional measurements of the water absorption, despite their low reliability, provide a smaller value than the total porosity. We can consider this value as indicative of the fraction of open pores. The proposed model indicated that the water absorption of LWA in a concrete mixture is less than that in air, which was also reported by [Citation26, Citation27]. The water absorption of the same LWA in a mix finally confirms that the open pores of LWA are not fully filled with water in the LWAC. As a result, both fine and coarse LWA had total porosity levels in a comparable range, but their water absorption amounts in a mix showed a considerable difference: 20% vs. 2%. According to EquationEq. (8)
(8)
(8) , the high water absorption of fine LWA is mainly due to its high effective volume ratio (
). A suitable distribution of small-sized grains, giving a higher effective volume ratio, increases the water absorption of fine LWA. The result can be related to the effectiveness of internal curing [Citation7, Citation31].
Figure 4. Porosity and water absorption of (a) fine LWA and (b) coarse LWA.
5. Conclusions
LWAC is beneficial because it decreases dead loads of a structure and provides internal curing to mitigate early-age cracking. However, mix proportioning and handling freshly mixed LWAC are not as straightforward as that for normal-weight concrete. Porous LWA in a mix causes water transport from the cement binder to the dry LWA or from wet LWA to the cement binder. The model proposed in this study compares the capillary pressures of LWA and the paste suction of binder to evaluate the moisture content (water absorption) of LWA. Additional water absorption of LWA in a freshly mixed concrete proceeds up to the moisture content at equilibrium on the pore pressures. This amount is less than the amount of water assumedly accounting for total porosity of LWA. In addition, it is even smaller than the value measured in conventional test methods for normal aggregates. Therefore, in order to obtain a stable mix of LWAC, it is necessary to consider the water absorption of LWA in a mix. The proposed model provides a theoretical background supporting the practice and reliable control for the water absorption of LWA.
Additional information
Funding
References
- American Concrete Institute, Guide for Structural Lightweight-Aggregate Concrete, ACI 213R-14, 2014.
- C. Shi and Y. Wu, Mixture proportioning and properties of self-consolidating lightweight concrete containing glass powder, ACI Mater. J., vol. 102, 2005, pp. 355–363.
- Y.J. Kim, Y.W. Choi, and M. Lachemi, Characteristics of self-consolidating concrete using two types of lightweight coarse aggregates, Constr. Build. Mater., vol. 24, no. 1, 2010, pp. 11–16. DOI: 10.1016/j.conbuildmat.2009.08.004.
- A. Lotfy, K.M.A. Hossain, and M. Lachemi, Statistical models for the development of optimized furnace slag lightweight aggregate self-consolidating concrete, Cem. Concr. Compos., vol. 55, 2015, pp. 169–185. DOI: 10.1016/j.cemconcomp.2014.09.009.
- H. Toutanji, C. Goff, K. Pierce, and H. Fares, Using aggregate flowability testing to predict lightweight self-consolidating concrete plastic properties, Cem. Concr. Compos., vol. 62, 2015, pp. 59–66. DOI: 10.1016/j.cemconcomp.2015.05.003.
- J. Castro, L. Keiser, M. Golias, and J. Weiss, Absorption and desorption properties of fine lightweight aggregate for application to internally cured concrete mixtures, Cem. Concr. Compos., vol. 33, no. 10, 2011, pp. 1001–1008. DOI: 10.1016/j.cemconcomp.2011.07.006.
- R. Henkensiefken, J. Castro, D. Bentz, T. Nantung, and J. Weiss, Water absorption in internally cured mortar made with water-filled lightweight aggregate, Cem. Concr. Res., vol. 39, no. 10, 2009, pp. 883–892. DOI: 10.1016/j.cemconres.2009.06.009.
- Á. Paul and M. Lopez, Assessing lightweight aggregate efficiency for maximizing internal curing performance, ACI Mater. J., vol. 108, 2011, pp. 385–393.
- M.A. Biot, General theory of three-dimensional consolidation, J. Appl. Phys., vol. 12, no. 2, 1941, pp. 155–164. DOI: 10.1063/1.1712886.
- O. Coussy, Mechanics and Physics of Porous Solids, John Wiley & Sons, Ltd, pp. 281, 2010.
- S. Amziane and N. Andriamanantsilavo, Prediction of cement paste pore water pressure variations during setting period, Adv. Cem. Res., vol. 16, no. 1, 2004, pp. 23–28. DOI: 10.1680/adcr.2004.16.1.23.
- J.H. Kim, H.J. Yim, and S.H. Kwon, Quantitative measurement of the external and internal bleeding of conventional concrete and SCC, Cem. Concr. Compos., vol. 54, 2014, pp. 34–39. DOI: 10.1016/j.cemconcomp.2014.05.006.
- H.J. Yim, J.H. Kim, and H.-G. Kwak, Experimental simulation of bleeding under a high concrete column, Cem. Concr. Res., vol. 57, 2014, pp. 61–69. DOI: 10.1016/j.cemconres.2013.12.011.
- H.J. Yim, J.H.J.K. Kim, H.-G.G. Kwak, and J.H.J.K. Kim, Evaluation of internal bleeding in concrete using a self-weight bleeding test, Cem. Concr. Res., vol. 53, 2013, pp. 18–24. DOI: 10.1016/j.cemconres.2013.05.015.
- C. Park, J.H. Kim, and S.H. Han, A pore water pressure diffusion model to predict formwork pressure exerted by freshly mixed concrete, Cem. Concr. Compos., vol. 75, 2017, pp. 1–9. DOI: 10.1016/j.cemconcomp.2016.09.009.
- J. Assaad and K.H. Khayat, Variations of lateral and pore water pressure of self-consolidating concrete at early age, ACI Mater. J., vol. 101, 2004, pp. 310–317.
- ASTM C29, Standard Test Method for Bulk Density (“Unit Weight”) and Voids in Aggregate, 2009.
- T. Stovall, F. de Larrard, and M. Buil, Linear packing density model of grain mixtures, Powder Technol., vol. 48, no. 1, 1986, pp. 1–12. DOI: 10.1016/0032-5910(86)80058-4.
- F. de Larrard and T. Sedran, Optimization of ultra-high-performance concrete by the use of a packing model, Cem. Concr. Res., vol. 24, no. 6, 1994, pp. 997–1009. DOI: 10.1016/0008-8846(94)90022-1.
- ASTM C136, Standard Test Method for Sieve Analysis of Fine and Coarse Aggregates, 2007.
- F. de Larrard, Concrete Mixture Proportioning: A Scientific Approach, E & FN Spon, London, 1999.
- ISO 679, Cement - Test Methods - Determination of Strength, 2009.
- C. Song, P. Wang, and H.a. Makse, A phase diagram for jammed matter, Nature, vol. 453, no. 7195, 2008, pp. 629–632. DOI: 10.1038/nature06981.
- ASTM C188, Standard Test Method for Density of Hydraulic Cement, 2014.
- ASTM C1437, Standard Test Method for Flow of Hydraulic Cement Mortar, 2013.
- L. Bello, E. Garcia-Diaz, and P. Rougeau, An original test method to assess water absorption/desorption of lightweight aggregates in presence of cement paste, Constr. Build. Mater., vol. 154, 2017, pp. 752–762. DOI: 10.1016/j.conbuildmat.2017.07.236.
- Y.H. Kim, C.B. Park, B. Il Choi, T.Y. Shin, Y. Jun, and J.H. Kim, Quantitative Measurement of Water Absorption of Coarse Lightweight Aggregates in Freshly-Mixed Concrete, Int. J. Concr. Struct. Mater. 14, 34, 2020. DOI: 10.1186/s40069-020-00408-x.
- ASTM D6980, Standard Test Method for Determination of Moisture in Plastics by Loss in Weight, 2017.
- ASTM C127, Standard Test Method for Relative Density (Specific Gravity) and Absorption of Coarse Aggregate, 2015.
- ASTM C128, Standard Test Method for Density, Relative Density (Specific Gravity), and Absorption, 2001.
- D.P. Bentz and K.A. Snyder, Protected paste volume in concrete: Extension to internal curing using saturated lightweight fine aggregate, Cem. Concr. Res., vol. 29, no. 11, 1999, pp. 1863–1867. DOI: 10.1016/S0008-8846(99)00178-7.