
Abstract
Humans accumulate large numbers of inorganic particles in their lungs over a lifetime. Whether this causes or contributes to debilitating disease over a normal lifespan depends on the type and concentration of the particles. We developed and tested a protocol for in situ characterization of the types and distribution of inorganic particles in biopsied lung tissue from three human groups using field emission scanning electron microscopy (FE-SEM) combined with energy dispersive spectroscopy (EDS). Many distinct particle types were recognized among the 13 000 particles analyzed. Silica, feldspars, clays, titanium dioxides, iron oxides and phosphates were the most common constituents in all samples. Particles were classified into three general groups: endogenous, which form naturally in the body; exogenic particles, natural earth materials; and anthropogenic particles, attributed to industrial sources. These in situ results were compared with those using conventional sodium hypochlorite tissue digestion and particle filtration. With the exception of clays and phosphates, the relative abundances of most common particle types were similar in both approaches. Nonetheless, the digestion/filtration method was determined to alter the texture and relative abundances of some particle types. SEM/EDS analysis of digestion filters could be automated in contrast to the more time intensive in situ analyses.
Introduction
Inhalation of inorganic particulate matter (PM) of both geogenic and anthropogenic origin is known to cause a range of lung diseases such as asbestosis, mesothelioma, silicosis and coal worker’s pneumoconiosis (Mossman and Be´gin Citation1988; Valavanidis et al. Citation2008; Petsonk et al. Citation2013). Determining the abundance and composition of inorganic particles in lung tissue is critical for investigating links between exposure and lung disease (Stettler et al. Citation1991; Abraham et al. Citation2016; Cohen Citation2016).
Common methods to examine inorganic PM in lung tissue utilize digestion of sizeable lung tissue samples, followed by counting of particles using scanning electron microscopy. Abraham et al. (Citation1991) used this approach to evaluate 20 000 particles from over 400 human lungs and classified observed particles primarily as silica, alumino-silicates, miscellaneous other silicates, talc and metals. Similarly, Stettler et al. (Citation1991) classified PM in whole lung homogenates from urban dwellers in Cincinnati, Ohio into aluminum silicates, silica, rutile-like, iron oxide-like, iron rich, aluminum rich, miscellaneous, titanium rich, silicon rich, magnesium silicates, other alumina silicates and alumina-like categories. The substantial lung tissue sample size required for this approach limits its utility as a clinical tool. Moreover, tissue digestion techniques do not allow examination of the sites of particle deposition or their anatomic location in relation to surrounding lung injury (McDonald et al. Citation1999).
In situ particle characterization in lung tissue using scanning electron microscopy (SEM) has been used (Abraham and Burnett Citation1983; McDonald et al. Citation1999; Hunt et al. Citation2003), but has not gained widespread applicability in characterizing human lung PM content. Limited use of the SEM is partly due to historic limitations of spatial and elemental resolution of individual particles within cells and time required to reliably characterize particles in a tissue sample, which can take hours to days. Using a modern field emission scanning electron microscope (FE-SEM) with energy dispersive spectroscopy (EDS), we developed a protocol for in situ characterization of inorganic PM in lung tissue that allows imaging and identification of the chemical makeup of particles with a spatial discrimination as small as approximately 0.1 µm. This improved resolution allows the examination of nano-particles, the primary cause of respiratory and cardiovascular disease due to air pollution (Donaldson et al. Citation2013). Furthermore, in this study using FE-SEM we improved the resolution of analyzable inorganic particles in lung tissue to identify specific mineral phases as defined by composition including feldspars, clays, oxides, phosphates and sulfates that may be important in lung injury. We compared findings of in situ particle characterization using FE-SEM instrumentation with the conventional bulk characterization approach following lung tissue digestion with bleach (sodium hypochlorite).
Methods
Study subjects and tissue samples
A total of 33 lung tissue samples were evaluated from three groups of study subjects (n = 11 for each group). The main group of interest included U.S. military personnel who had undergone a surgical lung biopsy to evaluate respiratory symptoms following deployment to Iraq and Afghanistan (‘deployers’). Members of this group had been variably exposed to desert dusts, smoke from burn pits and other sources of inhaled PM. The positive control group had autoimmune bronchiolitis based on lung tissue obtained by surgical biopsy (Lung Tissue Research Consortium, National Jewish Health, Denver, CO). Negative control whole-lung pre-morbid tissue samples were obtained from deceased subjects without known lung disease (International Institute for the Advancement of Medicine, Edison, NJ). Lung tissue samples were selected so that similar numbers of smokers and nonsmokers and upper, middle and lower lobes were represented in all three groups. Most samples were from the right lung.
Tissue preparation for in situ analysis
Lung tissue samples were prepared at National Jewish Health (NJH) and Vanderbilt University on formalin fixed, paraffin embedded tissue blocks following standard laboratory protocols. A microtome cut two serial sections, 5 μm and 20 μm thick, from these blocks. The sections typically exposed about 100 mm2 of tissue. A hematoxylin and eosin (H&E) glass-mounted slide was prepared using the 5 μm section, whereas the 20 μm section was mounted on high purity carbon vitreous plates (SPI catalog no. 4375GCP-AB) for FE-SEM analysis. Initial attempts to prepare sample sections for FE-SEM analysis on either plastic substrates or polished carbon plates using routine preparation techniques were not successful, as tissue sections lifted off the substrate during paraffin removal or during preparation for FE-SEM analysis. We avoided using conventional glass slide mounts for lung tissue to eliminate contribution of the slide glass to the EDS particulate analysis. Prior to FE-SEM/EDS analysis, samples were coated with approximately 200–400 Å of carbon in a high vacuum carbon evaporator to reduce sample charging.
Histopathological analysis
Histological analyses of the H&E slides on all three groups were performed by a pulmonary pathologist using bright field and polarizing light microscopy. The pathologist was blinded to the subjects’ group status (deployer, positive control or negative control). For each tissue sample, the pathologist selected 2–9 areas (median of 6) on the lung tissue section for particle analysis using the FE-SEM. Selected areas included normal tissue with no observable opaque or birefringent particles, areas containing moderate amounts of particles, areas with high contents of particles and areas within granulomas ().
Figure 1. Example images of lung tissue examined in this study. (A) H&E image of biopsied lung tissue with pathologist-selected study areas outlined by yellow (low to moderate PM observed) and green boxes (high PM observed). (B) BSE image of the area marked with a black box in image A. The white box represents one of eleven frames that were analyzed to cover the area marked by the pathologist. (C) BSE image of the frame marked by the white box in image B shows inorganic PM (bright) in the lung tissue (dark). (D) Secondary electron image of the same frame shows the texture of the tissue.
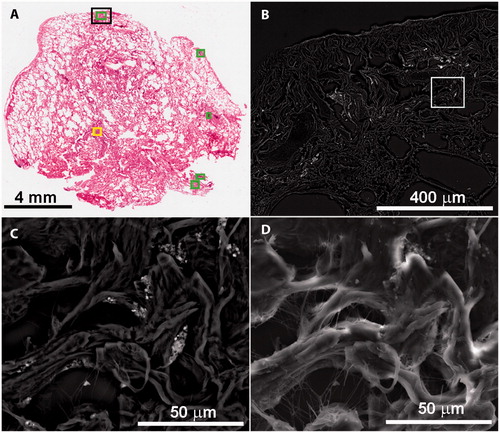
Each area was marked on a transmitted light image of the H&E slide using histological analysis software (Imagio).1 These defined areas were used to guide FE-SEM analyses and subsequent statistical evaluation (). As a result of using serial sections, some features on the H&E slide were occasionally absent on the FE-SEM examined slides. In these circumstances alternate, similar areas were selected for FE-SEM examination.
In situ mineral particle analysis
The areas selected by the pulmonary pathologist ranged from 0.006 mm2 to 0.821 mm2. Each of these areas was subdivided into 3 to 10 frames as imaged by the FE-SEM; total frames per tissue sample ranged from 5 to 62 (median 25). To optimize analysis time on the FE-SEM, 10 frames were selected as the maximum for each area. The frames were examined at 1100 to 1400× magnification, resulting in a field of view of ∼0.01 mm2 (). This magnification allowed clear resolution of particles as small as 0.5 μm and minimized the number of frames and time needed to cover the selected area. Backscattered electron (BSE) and secondary electron images were acquired at 15 kilovolts accelerating voltage and approximately 0.5 nanoamperes beam current. The intensity of BSE signal increases with increasing average atomic number of a particle. However, the BSE signal may be subdued because particles are embedded at varying depths below the tissue surface and many of the particles are thinner than necessary to generate a resolvable BSE signal. To easily identify particles, the contrast of the BSE images was tuned to highlight particles with atomic numbers greater than carbon, the principal component of lung tissue. Consequently, particles of soot, coal and other carbonaceous matter were not resolved or analyzed. Using the BSE image, as many as 50 inorganic particles were randomly selected to represent the entire field of view for each frame and were chemically analyzed by EDS (). Energy dispersive spectra were collected for 30 seconds on each particle. In addition to particles, EDS analyses were conducted on tissue free of PM to determine the contribution of elements from the tissue to the particle spectra. More detailed analyses of a few areas were done at greater magnifications to resolve particles less than 0.5 μm. These areas were selected because of unusual elemental compositions obtained during the routine EDS analysis of selected particles. Some of the frames had no visible particles in BSE mode but were still documented. At the time of analysis, the SEM operator was blinded to the group status of the subject’s tissue.
Figure 2. Examples of EDS spectra interpreted by specific mineral phases. (A) Secondary electron image shows tissue surrounding a particle cluster. (B) BSE image of same area with numbers marking locations of particles yielding the displayed spectra. Number designations touch the analyzed particles except 1, which refers to the bright circular grain. A total of 7 spectra were collected in this area.
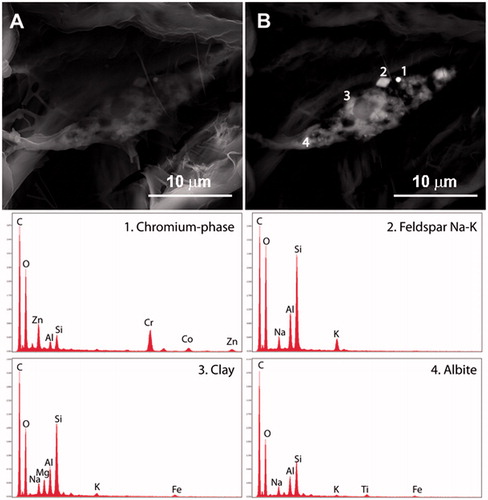
The EDS spectra generated during the in situ FE-SEM analyses provide the relative abundance of elements present at concentrations greater than 0.1 wt%. This information was manually compared to known phase compositions (e.g. minerals, alloys, metals) to classify the particle as a specific phase. Most chemical compositions detected during this study were indicative of specific phases. Some compositions are shared by multiple phases with different crystal structures, for those particles, a generic identifier was used. For example, silica (SiO2) was used to identify particles that could be quartz, cristobalite, tridymite, amorphous silica, etc. A total of 51 distinct phases were recognized. A library of spectra of the identified phases and blank tissue is provided in Lowers et al. (Citation2016).
Many of the identified areas contained clusters of particles. At the operating accelerating voltage (15 kv), CASINO Monte Carlo simulation of the analysis depth from which the measured photons are generated is approximately 2 μm for silicate particles and 1 μm or less for metal-rich particles (Drouin et al. Citation2007). In addition, the particles were embedded at varying depths in the lung tissue. The distribution of particles in this three dimensional tissue matrix and their proximity within the analysis volume commonly resulted in spectra that were the result of two or more phases. For multiphase spectra, the dominant phase defined by EDS element intensities was recorded. However, for those few mixed spectra that included minor components of trace elements (antimony, barium, chromium, cobalt, copper, nickel, tin, vanadium, zinc, etc.) with another dominant phase, the trace element phase was recorded as a separate entry along with the major component. The enhanced emphasis on trace elements reflects their potential health effects (Mitchell et al. Citation1961; Redline et al. Citation1986; Bartter et al. Citation1991; Muir et al. Citation1993; Werfel et al. Citation1998; Nemery et al. Citation2001; Balmes et al. Citation2014).
Bulk tissue analysis
We sought to determine if the in situ analysis of selected areas of lung tissue yielded similar relative abundances of the major mineral species as determined by using the digestion method. A subset of 11 of the 33 total samples analyzed using the in situ method was chosen for particle analysis following tissue digestion and filtration of a serial tissue section.
The digested serial slices varied from 60 to 100 μm thick. The slices were weighed and combined with 25 mL of reagent xylene to remove the paraffin. After 1 hour, the resultant solids were separated using a 0.2 μm nylon or polypropylene filter. The residue was dried overnight at 45 °C, and the dried tissue weighed. A bleach solution of 7 wt% NaOCl and 0.05 N NaOH was prepared and filtered through a 0.2 μm filter. The dried tissue samples were transferred into 20 mL of bleach solution in a glass beaker and reacted for 1 hour to dissolve the tissue. The suspension was filtered through a 13 mm diameter, 0.2 μm polycarbonate filter and rinsed with 20 mL of filtered deionized water. The small tissue weights, <0.2 to 1.5 mg, and the very small mass of particulates in the tissue prevented determination of the particulate weight. The dissolution and filtration procedures were performed in a laminar flow hood equipped with a HEPA filter. The hood was meticulously cleaned prior to analysis to minimize presence of PM contaminants, because dissolutions done early in the methods development process and procedure blanks showed evidence of substantial contamination by particles. Procedural blanks and paraffin blanks were prepared in the same manner.
The filtrate from the tissue digestion step was collected in acid-washed polycarbonate bottles for multi-elemental analysis by inductively coupled plasma mass spectrometry (ICP-MS) to estimate the relative importance of particle dissolution, particularly for trace elements. Calibration blanks and standards were prepared at 1, 10 and 20 µg/L (micrograms per liter) in a 1:10 dilution of the blank sodium hypochlorite (bleach) digestion fluid in order to matrix match the digestion matrix of the samples. 18 M-Ohm deionized water was used to prepare all standard and sample dilutions. All samples were diluted 1:10 with de-ionized water prior to analysis to reduce deposition of NaCl on the ICP-MS interface and to reduce instrument signal drift over time. An internal standard was not used because the commonly used internal standard elements were also analytes of interest. The estimated error on the reported results is ±20% based on recoveries of standards.
For each sample, the filter containing remaining particles, after the bleach digestion, was analyzed by FE-SEM using an automated particle counting routine, similar to that described in Keulen et al. (Citation2008). The brightness and contrast of the BSE images taken at 3000 times magnification were set so that the polycarbonate filter was black and the inorganic PM was white. The threshold values were set to exclude the filter and most carbonaceous particles and to detect all inorganic particles. Particles less than 4 pixels (0.02 μm2) were excluded from the count as they could represent signal noise in the SEM. EDS spectra were collected for 5 seconds on each particle and manually classified by the operator using the same phase library applied during the in situ analysis. The first set of filters analyzed a minimum of 200 fields of view or 1000 particles, which ever limit was met first. A selected group of samples was reanalyzed using a minimum of 900 fields of view or 1000 particles as the limits to test the adequacy of using 200 fields of view.
Statistical analysis
We evaluated differences in the abundance of phases identified as follows: (a) between in situ and digestion results; (b) among subjects; (c) among pathologist-classified areas; and (d) among frames. The large range in the number of particles resolved among the fields of view (0 to 73; median 9) and totals for a subject (8 to 1348; median 307) necessitated normalized abundances (percentiles) for statistical comparison. Hierarchical linear mixed models were fitted for relative abundance of each major phase to determine relative variances of subjects, sampling areas and frames, by including random intercept terms for subject and sampling area within subject. Frame variability was accounted for by error variance. Sampling areas were nested within subject, and frames within sampling areas. Two analyses were performed, one using all frames and another using only frames in which more than 5 particles were identified. Similar hierarchical models were used for the digestion filter data to determine relative variances for subjects and replicates within subjects. Paired t-tests were used to compare relative abundances for each phase, between digestion and in situ methods, and among subjects that had data for both methods.
Results
Particle attributes based on in situ analysis
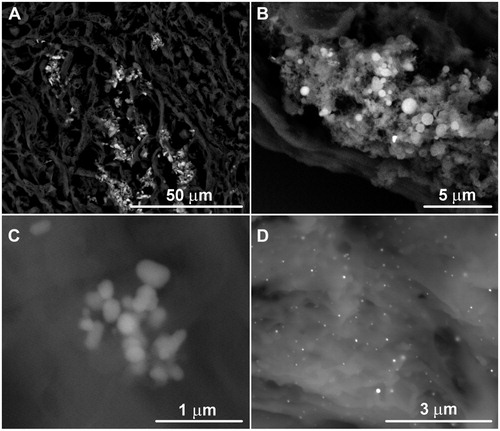
In total, nearly 13 000 particles were analyzed and classified (Lowers et al. Citation2016). The in situ tissue analyzed particles ranged in size from <0.5 μm up to 10 μm, with most in the 1–2 μm range. The particle dimensions varied from equidimensional to elongate, and overall shape varied from rounded to angular (). More commonly, aggregates of particles were present in elongate clusters that ranged from 5 to 15 µm in their greatest dimension. The clusters were either polyphase or monophase. Polyphase clusters were composed of a variety of phases in varying sizes and shapes (). Most were mixtures of aluminosilicate particles. Monophase clusters are most commonly composed of titanium dioxide, iron oxide or apatite (), but clusters of tin, antimony, copper–zinc phase and mercury were observed. Some clusters were encircled by a halo with intermediate BSE brightness between the particles and tissue. The halos were carbon-rich and contained diffuse enrichments of elements such as silicon, aluminum, calcium, sodium and potassium relative to the ‘normal’ tissue. These element components may indicate partial dissolution of aluminosilicate particles and local migration of dissolved components into the lung tissue (McDonald et al. Citation1999). Limited data on the halos around metal particle clusters show they too were enriched in silicon, aluminum and other elements. These results demonstrate the ability of the in situ method to resolve and identify particulates and provide indications of possible particulate–lung interactions.
Figure 3. Example BSE images of in-situ aggregates of particles. (A) Polymineralic particle clusters. (B) Monomineralic cluster of calcium phosphate granules. (C) Monomineralic cluster of titanium dioxide. (D) Loose aggregate of mercury spheres.
Phase composition and abundances of particles
The compositions of the nearly 13 000 particles examined by the in situ analysis were used to manually categorize each particle into one of 51 defined phases. The identified phases varied in abundance from one or two occurrences to those present in nearly all subjects. Raw data including particle count results by subject group status (deployer, positive, negative), age, gender and smoking status are compiled in the data release document by Lowers et al. (Citation2016). To facilitate evaluation of the data, the 51 phases were grouped into classes by chemical composition and inferred mineralogy. The particle classes with the most abundant counts included silica (most likely quartz), feldspars (albite + feldspar Na–K + kspar + plagioclase), clays (biotite + muscovite + kaolinite + illite + smectite), titanium dioxide, iron oxide and apatite. The minor classes included particles attributed to steel (as described below) and those having detected contents of trace elements (antimony, bismuth, chromium, cobalt, copper, lead, nickel, niobium, osmium, tin and zinc) ().
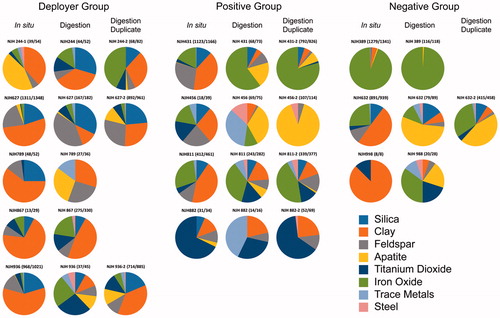
Figure 4. Pie diagrams summarizing the relative abundance of the eight major phase classes (silica, clay, feldspar, apatite, titanium dioxide, iron oxide, trace element-rich particles and steel) in samples for which in situ and digested tissue particles were identified and counted. For some samples, a duplicate of the filtered digested material was counted. The duplicate for sample 244 is an analysis of a second tissue slice. The numbers in parenthesis (#/#) display the ratio of the sum of all particles in the 8 major phase classes (silica, clay, feldspar, apatite, titanium dioxide, iron oxide, trace metals and steel) over the sum of all particles identified in that sample. The remainder of particles occurred at minor to trace amounts and did not fall into one of these 8 major phase classes. Data are compiled in Lowers et al. (Citation2016).
Clays, silica, feldspars, at least some of the titanium dioxide particles and many of the iron oxide particles are likely exogenous and of geogenic origin. Other exogenous phases that may be attributed to industrial processes include barium sulfate, various steel alloys (Fe–Cr, Fe–Cr–Ni, Fe–Ni etc.), and phases containing tin, copper, zinc, mercury, nickel, lead, osmium, cobalt, zirconium, cerium and gold – most likely of anthropogenic origin. The separation of geogenic and anthropogenic is subjective as many earth materials are incorporated in anthropogenic materials (e.g. silica used in sandblasting, titanium dioxide used in paints and produced by coal combustion or kaolinite used in ceramics and paper). Endogenous phases include calcium phosphate granules (considered to be apatite) and some iron-rich particles (). The endogenous iron-rich particles have a spongy texture and commonly contain greater contents of phosphorus, whereas exogenous iron oxides are angular and some contain detectable Ti, Mn or Cr. Presence of those minor elements is expected for geogenic phases such as ilmenite and magnetite (Dare et al. Citation2014). The endogenous apatite typically is present as spherical particles that are 500 nm to 2 μm in diameter and found in normal tissue areas and particulate-rich areas of tissue (). The calcium phosphate in some samples appeared to be largely a product of endogenous calcification though we cannot rule out some contribution to sample preparation.
Sources of variance in study findings
summarizes the grouped phases from the raw data provided in Lowers et al. (Citation2016) for the subjects in which both the in situ and digestion methods were performed. Findings show substantial heterogeneity of relative abundance of phases among the study subjects’ lung tissue. To evaluate this heterogeneity, we considered three levels of variance of relative abundances as part of our methods evaluation: among subjects, among pathologist-selected areas and among frames. For pathologist-selected areas, geometric means of total particle counts for all frames of the high, intermediate and low particle areas were 7.5, 5.4 and 1.5, respectively. When all evaluated frames were considered, the greatest variance (63–80%) of the relative abundance of silica, feldspars, clays, titanium dioxide, trace metals and steel by the in situ method is at the frame level (). Iron oxide had only 47% of its variance at the frame level (). In contrast, apatite had most of its greatest variance (55%) among the pathologist-selected areas with few particles. These areas contained an appreciably greater proportion of apatite than areas with high to moderate numbers of particles ().
Table 1. Relative variance of the common phases at the frame (field of view), area (pathologist selected to focus analytical study), and subject levels calculated using linear mixed models on the relative abundances of the phases.
We repeated the variance analysis considering only those frames having 5 or more particles. This approach was designed to reduce the effect of frames in which low numbers of particles would result in high relative abundances for the few phases detected, particularly those having large monomineralic clusters such as samples 389, 431, 632, 811, which had high iron oxide contents; samples 435, 613, 882, which had large numbers of titanium dioxide particles; and samples 746, 745, 907, which had abundant apatite. Using this approach, the maximum variance for apatite (41.2%), titanium dioxide (73.2%) and iron oxide (56.0%) was at the subject level (). The improved resolution of differences among subjects for apatite, iron oxide and titanium dioxide supports this data censoring approach. Limiting data analysis to frames with more than 5 particles improved interpretation of differences among subjects.
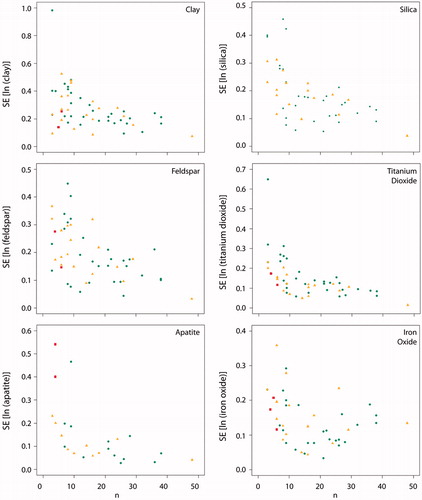
As part of methods optimization, we considered the variation in the standard error (SE) of the mean relative to the number of frames. This analysis was intended to identify the minimum number of frames necessary to reliably characterize particulate composition. We found that approximately 15–20 frames were sufficient to minimize the SE for silica, clay, feldspars, titanium dioxide and apatite (). Iron oxide, however, did not converge to a minimum value and may require a larger number of frames for accurate characterization.
Digested tissue analysis
The abundance, type and relative proportion of inorganic particles identified in the procedure blank and paraffin blank samples for the digested tissue indicate that contamination was a significant problem during tissue dissolution. Analysis of unused, clean filters that were carbon coated lacked contaminant particles. Despite conducting all sample digestion and filtration in a cleaned, well maintained HEPA-filter-equipped, laminar flow hood, phases identified in the blanks included various chromium-rich particles, amphiboles, some feldspars, calcite and silica with high contents of sodium and aluminum (silica-NaAl) (Lowers et al. Citation2016). The relative abundances and compositions of these particles were distinct from those found by the in situ tissue analyses. These findings reinforce the importance of blank characterization during analysis of particles following tissue digestion that was recommended by McDonald et al. (Citation1999).
To address contaminant contribution to the digested tissue samples, we applied a correction to the digested particle counting data based on results of the procedural and paraffin blanks as recommended by McDonald et al. (Citation1999). Specifically, particles of silica-NaAl, which is a major component in the digested samples and very minor in the in situ samples, were considered to be contaminants. The ratio of the abundance of major phases (silica, feldspars, clays, iron oxides, etc.) to silica-NaAl was determined for each of the procedural blank filters, and those values were averaged to determine correction factors for each major phase. Those factors were applied to estimate the abundance of major phase contaminants in the digested tissue samples based on the abundance of silica-NaAl in those samples. The contaminant amount was then subtracted from the total count. Phases such as amphibole and calcite were identified in higher proportion in the digestion samples than for the in situ method, but were effectively removed with the application of the Silica-NaAl based blank correction (Lowers et al. Citation2016). However, Cr–Ni alloy, and Cr-rich and Ni-rich oxide particles, likely contaminants, remained higher in the digestion counts, leading to an overall enrichment of steel and trace element-rich particles in the blank-corrected digestion results relative to the in situ method. The median content of particles attributed to contamination was 27% of the total particles counted on the filters.
After blank correction, replicate analyses of the relative abundance of particles on the filter were evaluated. The amount of variance among the digested samples accounted for the largest difference of relative abundances as it was substantially greater than within subjects (replicate) (). Evaluation of replicate particle counts using 200 and 1000 frames, respectively, determined that analysis of 200 fields of view per sample is adequate to resolve differences among subjects.
Table 2. Evaluation of the distribution of variance in tissue digestion results.
Following the blank correction, the major phases identified in the digested tissue set of particle classes included clay, silica, feldspars, titanium dioxide, iron oxide, steel and trace elements, similar to findings using the in situ method. Dissolution of lung tissue by bleach digestion improved the EDS analyses of particles. This was attributed to removal of significant background contributions of Na, K, P and S from the prepared tissue surrounding the particles in situ.
A paired t-test comparison of the relative abundances of particle classes determined by the digestion and in situ methods is shown in . Clay was significantly more abundant in the in situ results. Apatite trended toward higher abundances in the digestion results (). Although trace metals and steel appear to be slightly higher in the digestion method, this was not statistically significant (p > 0.01) and may be due to contaminants added during the digestion process.
Table 3. Mean percentages of phases by method, with comparisons between methods using paired t-tests, based on n = 11 subjects.
Most elements measured by ICP-MS analysis were below detection limits (Tb, Dy, Ho, Er, Tm, Y, La, Ce, Pr, Nd, Sm, Eu, Gd, Yb, Cs, Hf, Ga, As, Rb, Lu, Tl, Zr, Bi, Th, Ni, Ti, V, Cu, Ag, W, Nb, Mo, Sb, Li, Co, Fe) or detected but not present at levels greater than the blank concentrations (Be, Mg, Al, Mn, Zn, Ge. Sr, Pb). Only Cd, Ba, Hg and U in some samples were considered sufficiently above detection and blank concentrations (Lowers et al. Citation2016).
Discussion
In developing the in situ method to analyze small samples of available lung tissue, several notable findings became apparent. In classifying particles, we detected a wide range of phase types that likely have diverse origins. The exogenic phases include those from geogenic and anthropogenic sources. Despite these variable sources and the diverse groups from which lung tissue samples were available, the physical appearance (size and shape), anatomical locations (in the interstitium and lymphatic channels) and phases present are generally similar among the 33 subjects. Most phases found in these lung tissue samples are typical of those found in atmospheric dusts and their source soils. Some particles are typical of workplace and environmental exposures to airborne inorganic PM such as grinding compounds or welding particulates (Schenker et al. Citation2009).
Particle clusters occurring in or adjacent to lymphatic channels, identified by the pathologist, may represent groups of particles collected by a single macrophage or sequentially by many macrophages. The clustering of particles may have developed via other biological processes as particles moved through airway, lymphatic, vascular and other lung compartments. The halos of organic material enriched with inorganic elements, surrounding particle clusters, suggest that some dissolution and redistribution of particle constituents occurred, possibly as a result of macrophage ingestion. However, we cannot exclude the possibility that particles entered the airways already clustered. This interpretation is consistent with Sokolik and Toon (Citation1999) who noted that optical properties of dusts are consistent with the multiphase particles observed in dust generating soils. The composition and characteristics of airborne aggregates have also been shown to vary with source (Kiefert et al. Citation1996).
The large number of phases and wide range of abundances rendered the resulting data more suited to analysis after combining into phase groups and relative abundances. The reduction of most of the 51 recognized phases into 8 groups was necessary to evaluate the method statistically. Even with phase groupings there remained substantial heterogeneity in the distribution of particles of different composition at small scales within an analyzed tissue sample. Nonetheless, we recommend that compositionally distinct phases should be identified separately to preserve the granularity of the original observations for future data evaluation.
The major phase groups, including clay, silica, feldspar, titanium dioxide and iron oxide, were prominent in all 33 samples. Although present in most frames of all samples, the relative abundances at which the phase groups occur are highly variable, as indicated by the hierarchical analysis results (). For silica, feldspars and clays, the greatest variance was found at the frame level within tissue sections. Plausible conditions or mechanisms responsible for this heterogeneity may be temporal variations in the compositions and amounts of exposed airborne particles, differential particle deposition and retention patterns among lung compartments, and biochemical alteration of particles by lung fluids.
There were a number of limitations to our in situ method. Notably, the tissue areas (0.006–0.821 mm2) and masses (<0.1–0.8 mg) analyzed in all subjects are small compared to the total amount of lung tissue, and therefore may not be an accurate representation of the composition and abundance of particles in the whole lung. Based on the calculated variances of the relative abundances/total numbers, it is estimated that 20 frames at 1100–1400 times magnification are necessary for each subject to adequately report the composition of the tissue sample (). Future studies should include a sampling scheme that tests heterogeneity within the lung.
The contrast in particle appearance and particle class abundances between in situ and digestion results indicate fundamental differences between the two methods (). Particle clusters were sparse in the digested aliquots relative to their common presence during in situ analyses, likely due to dissolution of the tissue binding the clusters. Particle dissolution, along with agitation and multiple rinses that dispersed aggregated particles during processing might account for the lower clay content of digested samples compared to the in situ results (). The very small size and thin sheet-like habit of the clay particles may prevent their detection during automated counting because they may be dispersed on the filter and are x-ray transparent. Other possibilities are that some of the clay minerals passed through the filter or were dissolved in the bleach solution. Given the high content of contaminants and elevated concentrations of clay-forming elements (Al, Mg) in the measured bleach solutions, these hypotheses are is unresolved.
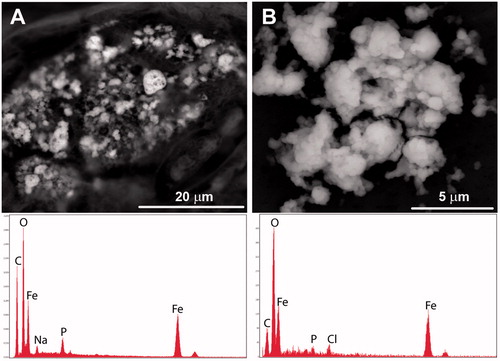
Dissolution in the bleach digestate may also have affected some trace particles that were detected during the in situ analyses, but absent on the digestion filters. For example, abundant 50-nanometer mercury spheres observed via FE-SEM to be dispersed within the tissue of sample 789 were not seen in the filtered material from the same subject (). Elevated mercury concentrations were measured in the digestate, indicating that these spheres may have either passed through the filter following the digestion, or were dissolved in the alkaline bleach; our preferred interpretation is that the mercury likely was dissolved due to its enhanced solubility in highly oxidizing alkaline solutions. Endogenous iron oxides also displayed evidence of reaction with the bleach. In situ analysis showed that these grains had a spongy texture and a significant phosphorous content in the tissue slices. However, after tissue digestion, the spongy texture was absent and there was considerably less phosphorous (). These chemical transformations along with wetting and drying during processing may have promoted transformation of the iron oxide particles.
Figure 5. Comparison of endogenic iron oxide aggregates. (A) Porous iron oxide observed during the in situ analysis commonly contained sodium (Na), phosphorus (P) and small amounts of sulfur (S) which may be part of the tissue or from tissue preparation. (B) Iron oxides observed after tissue digestion were less porous, contained less phosphorus, and had detectable chlorine (likely introduced from the bleach).
Another consideration when using the digestion method is the likelihood for introduction of foreign particles. After recognizing the abundance of Cr–Ni particles in the digested tissue, we discovered signs of corrosion on the Cr-plated fixtures in our laboratory. Despite precautions applied in this study such as wearing gloves and working in a laminar flow hood, contamination by particulates during tissue digestion and filtration is a significant concern. This finding suggests that results of traditional bleach digestion studies may be affected by contamination from external airborne particles, unless the studies can demonstrate appropriate use of blanks and other methods to mitigate contamination. Future investigations should conduct digestions in clean laboratory facilities with minimal ambient dust, and include blank analyses to support the veracity of results.
Apatite relative abundances were greater in the digested tissue results than in the in situ results (). In situ analysis showed that individual apatite spheres and small clusters of spheres were dispersed throughout the tissue, so digestion would reflect apatite particles that occurred outside the pathologist identified areas examined by FE-SEM. Support for apatite being dispersed in the tissue is provided by the proportionally greater amount of apatite in the areas considered by the pathologist as normal tissue or tissue containing very little birefringent material (), possibly because the sizes of the apatite spheres were smaller than the resolving power of the optical microscope. Although beyond the scope of this study, several possibilities for apatite formation are suggested including that apatite is formed within the lung tissue itself; that it may represent ectopic ossification, metal detoxification, an inflammatory response to injury; or an artifact of tissue fixation during preparation (Simkiss and Taylor Citation1994; Khan et al. Citation2012) ().
Figure 6. The bar charts summarize the mean relative abundance of the major phase classes for each of the pathologist defined tissue types containing high (green), moderate (yellow) and low (red) PM. The top chart includes all frames while the bottom chart is restricted to the frames that contained more than 5 particles.
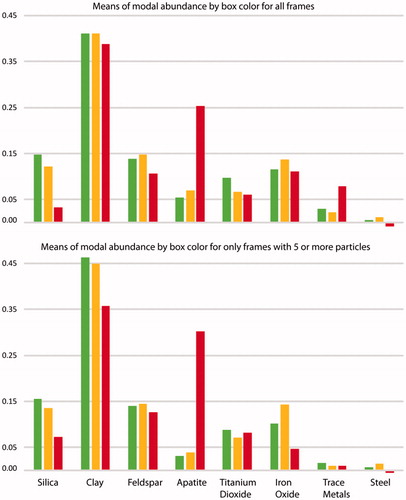
Figure 7. Plot of standard error (SE) versus the number of frames analyzed. Between 15–20 frames for silica, clay, feldspars, titanium dioxide and apatite was sufficient to achieve the minimal standard error. Iron oxide requires more frames to be counted to reduce the standard error. Colors of the data points indicate the pathologist area designation.
This exploratory study supports the potential importance of FE-SEM examination of lung tissue samples to explore the pathological implications of inhaled inorganic particles. Results suggest areas worthy of future study including determination of appropriate particle size thresholds, specific descriptions of tissue conditions relative to composition of spatially associated particles, documentation of chemical changes to particles attributable to processes within the lung, and refinement of number of particles needed to produce reliable results. Further definition of the anatomic location and active physiological processes affecting particles could inform future in situ studies. Further FE-SEM analyses could focus on examining lung injury in tissues directly contacting these particles. The FE-SEM is capable of finer resolution than used for this study. Closer examination may reveal additional attributes of particle reactivity and tracking particles of specific compositions.
Conclusions
Our findings suggest that improved image resolution, element detection and analytical sensitivity of FE-SEM-EDS instrumentation may be an important tool for in situ analysis of lung tissue in studies of inhaled particulates and lung injury. We found 51 compositionally distinct phases in the analysis of 13 000 particles in tissue samples from 33 subjects. A number of these phases have implications for lung health including kaolinite, silica, talc, lanthanide elements, titanium dioxide and several other known trace elements of concern (Ba, Cd, Hg, Zr) (McDonald et al. Citation1999). The most commonly observed particles during this study were silica, feldspars, apatite, titanium oxides and iron oxides.
In situ analysis of particles has both advantages and limitations compared to the digestion of lung tissue and collection of particles on a filter. Direct examination of lung tissue enables evaluation of the morphology, type and composition of particles as well as alteration of the particles by processes active in the lung. Such processes may explain the ‘halo’ of tissue surrounding particles that are enriched in inorganic elements; such halos cannot be observed after the tissue is dissolved. In addition, alteration of particle characteristics and dissolution of some particles during tissue digestion was noted. Accordingly, in situ analyses provide a more reliable characterization of particle characteristics and abundance.
A field of view of 0.01 mm2 was determined to be adequate to select and analyze in situ particles >0.5 µm. Increased magnification was capable of resolving particles as small as 0.05 µm. Statistical analysis showed that most variance in an area was among different fields of view (FOV), but analysis of as few as 20 FOV were sufficient to reliably characterize abundances of most common particles in an area of study. However, lung tissue sample sizes were small, and our findings may not reflect whole lung particulate profiles.
In situ analysis does require manual selection of particles, which is time intensive. Manual selection is required because of the subtle appearance of particles partially embedded within tissue and for discrimination of clumped particles. Complete analysis of tissue samples with abundant particles required up to 20 hours, although that time would be reduced by applying findings of this study regarding the number of particles and FOV required for reliable results. In contrast, particles deposited on filters following tissue digestion tend to be discrete and free of binding tissue which enables automated particle selection and analysis. In addition, larger amounts of tissue can be digested that may be more representative of the whole lung particle content (McDonald et al. Citation1999). However, our findings suggest that the digestate method may be more subject to contamination, emphasizing the importance of analyzing blank samples.
Disclosure statement
The authors acknowledge no financial interest or benefit has arisen from the application of this research.
Note
Additional information
Funding
Notes
1 Any use of trade, firm, or product names is for descriptive purposes only and does not imply endorsement by the U.S. Government.
References
- Abraham JL, Burnett BR. 1983 Quantitative analysis of inorganic particulate burden in situ in tissue sections. Scanning Electron Microscopy. V(2):681–696.
- Abraham JJ, Burnett BR, Hunt A. 1991. Development and use of a pneumoconiosis database of human pulmonary inorganic particulate burden in over 400 lungs. Scanning Microsc. 5:95–108.
- Abraham JL, Crawford JA, Scalzetti E, Kramer LG. 2016. Analysis of lung particle burden in a 28 year old man with rapidly progressive coal worker’s pneumoconiosis (accelerated silicosis). Am J Respir Crit Care Med. 193:A7074.
- Balmes JR, Abraham JL, Dweik RA, Fireman E, Fontenot AP, Maier LA, Muller-Quernheim J, Ostiguy G, Pepper LD, Saltini C, et al. 2014. An official American Thoracic Society statement: Diagnosis and management of beryllium sensitivity and chronic beryllium disease. Am J Respir Crit Care Med. 190:e34–e59.
- Bartter T, Irwin RS, Abraham JL, Dascal A, Nash G, Himmelstein JS, Jederlinic PJ. 1991. Zirconium compound-induced pulmonary fibrosis. Arch Intern Med. 151:1197–1201.
- Cohen RA, Petsonk EL, Rose C, Young B, Regier M, Najmuddin A, Abraham JL, Churg A, Green FHY. 2016. Lung pathology in U.S. coal workers with rapidly progressive pneumoconiosis implicates silica and silicates. Am J Respir Crit Care Med. 193:673–680.
- Dare SAS, Barnes S-J, Beaudoin G, Méric J, Boutroy E, Potvin-Doucet C. 2014. Trace elements in magnetite as petrogenetic indicators. Miner Deposita. 49:785–796.
- Donaldson K, Duffin R, Langrish JP, Miller MR, Mills NL, Poland CA, Raftis J, Shah A, Shaw CA, Newby DE. 2013. Nanoparticles and the cardiovascular system: a critical review. Nanomedicine. 8:403–423.
- Drouin D, Couture AR, Joly D, Tastet X, Aimez V, Gauvin R. 2007. CASINO V2.42: a fast and easy-to-use modeling tool for scanning electron microscopy and microanalysis users. Scanning. 29:92–101.
- Hunt A, Abraham JL, Judson B, Berry CL. 2003. Toxicologic and epidemiologic clues from the characterization of the 1952 London smog fine particulate matter in archival autopsy lung tissues. Environ Health Perspect. 111:1209–1214.
- Keulen N, Frei D, Bernstein S, Hutchinson M, Knudsen C, Jensen L. 2008. Fully automated analysis of grain chemistry, size, and morphology by CCSEM: examples from cement production and diamond exploration. Geological Survey of Denmark and Greenland Bulletin. 15:93–96.
- Khan FR, Bury NR, Hogstrand C. 2012. Copper and zinc detoxification in Gammarus pulex (L.). J Exp Biol. 215:822–832.
- Kiefert L, McTainsh GH, Nickling WG. 1996. Sedimentological characteristics of Saharan and Australian dusts. In: Guerzoni S, Chesterm R, editors. The impact of desert dust across the Mediterranean. Norwell (MA): Kluwer; p. 183–190.
- Lowers HA, Breit GN, Pillers RM, Meeker GP. 2016. Particulate matter identification in lung tissue from deployers, positive, and negative controls using scanning electron microscopy and energy dispersive spectroscopy 2013–2016. U.S. Geological Survey Data Release http://dx.doi.org/10.5066/F7VX0DN5
- McDonald JW, Churg A, Roggli VL, Shelburne JD. 1999. Microprobe analysis in pulmonary pathology. In: Ingram P, Shelbourne J, Roggli V, LeFurgey A, editors. Biomedical applications of microprobe analysis. New York (NY): Academic Press; p. 201–256.
- Mitchell J, Manning GB, Molyneux M, Lane RE. 1961. Pulmonary fibrosis in workers exposed to finely powdered aluminium. Br J Ind Med. 18:10–23.
- Mossman, BT, Begin, RO, editors. 1988. Effects of mineral dusts on cells. New York (NY): Springer-Verlag; p. 470.
- Muir DC, Julian J, Jadon N, Roberts R, Roos J, Chan J, Maehle W, Morgan WK. 1993. Prevalence of small opacities in chest radiographs of nickel sinter plant workers. Br J Ind Med. 50:428–431.
- Nemery B, Verbeken EK, Demedts M. 2001. Giant cell interstitial pneumonia (hard metal lung disease, cobalt lung). Semin Respir Crit Care Med. 22:435–438.
- Petsonk EK, Rose C, Cohen R. 2013. Coal mine dust lung disease: new lessons from an old exposure. Am J Respir Crit Care Med. 187:1178–1185.
- Redline S, Barna BP, Tomashefski J, Abraham J. 1986. Granulomatous disease associated with pulmonary deposition of titanium. Br J Ind Med. 43:652–656.
- Schenker MB, Pinkerton KE, Mitchell D, Vallyathan V, Elvine-Kreis B, Green FHY. 2009. Pneumoconiosis from agricultural dust exposure among young California farmworkers. Environ Health Perspect. 117:988–994.
- Simkiss K, Taylor MG. 1994. Calcium magnesium phosphate granules: atomistic simulations explaining cell death. J Exp Biol. 190:131–139.
- Sokolik IN, Toon OB. 1999. Incorporation of mineralogical composition into models of the radiative properties of mineral aerosol from UV and IR wavelengths. J Geophys Res. 104:9423–9444.
- Stettler LE, Platek SF, Riley RD, Mastin JP, Simon SD. 1991. Lung particulate burdens of subjects from the Cincinnati, Ohio urban area. Scanning Microsc. 5:85–94.
- Valavanidis A, Fiotakis K, Vlachogianni T. 2008. Airborne particulate matter and human health: toxicological assessment and importance of size and composition of particles for oxidative damage and carcinogenic mechanisms. J Environ Sci Health Part C Environ Carcinog Ecotoxicol Rev. 26:339–362.
- Werfel U, Schneider J, Rodelsperger K, Kotter J, Popp W, Woitowitz H, Zieger G. 1998. Sarcoid granulomatosis after zirconium exposure with multiple organ involvement. Eur Respir J. 12:750.