
Abstract
Objective
In this study, differentially expressed genes (DEGs) and signaling pathways involved in diquat (DQ) and paraquat (PQ) poisoning were identified via bioinformatics analysis, in order to inform the development of novel clinical treatments.
Methods
Raw data from GSE153959 were downloaded from the Gene Expression Omnibus database. DEGs of the DQ vs. control (CON) and PQ vs. CON comparison groups were identified using R, and DEGs shared by the two groups were identified using TBtools. Subsequently, the shared DEGs were searched in the Gene Ontology and Kyoto Encyclopedia of Genes and Genomes (KEGG) databases, using the Database for Annotation, Visualization, and Integrated Discovery. A protein–protein interaction (PPI) network was constructed, and hub genes were identified using the cytoHubba plug-in in Cytoscape software. Finally, circos and contrast plots showing the DEGs shared between mouse and human chromosomes were constructed using TBtools.
Results
Thirty-one DEGs shared by the DQ and PQ groups were identified. Enriched biological process terms included positive regulation of cell proliferation and translation. Enriched cellular component terms included extracellular region, intracellular membrane-bounded organelle and mitochondrion. Enriched molecular function terms included transcription factor activity and sequence-specific double-stranded DNA binding. Enriched KEGG pathways included the interleukin-17 signaling pathway, tumor necrosis factor signaling pathway, and human T-cell leukemia virus 1 infection. The top 10 hub genes in the PPI network were prostaglandin-endoperoxide synthase 2 (Ptgs2), chemokine (C-X-C motif) ligand 2 (Cxcl2), colony-stimulating factor 2 (granulocyte-macrophage) (Csf2), matrix metallopeptidase 13 (Mmp13), amphiregulin (Areg), plasminogen activator, urokinase receptor (Plaur), fos-like antigen 1 (Fosl1), epiregulin (Ereg), activating transcription factor 3 (Atf3), and transferrin receptor (Tfrc). Cxcl2, Csf2, and Atf3 played important roles in the mitogen-activated protein kinase (MAPK) signaling pathway.
Conclusions
These pathways and DEGs may serve as targets for gene therapy.
1. Introduction
Diquat (DQ) (Magalhães et al. Citation2018) and paraquat (PQ) (Mitra et al. Citation2011) are nonselective and widely used herbicides. DQ (1,1′-ethylene-2,2′-bipyridinium ion) (Magalhães et al. Citation2018; Jones and Vale Citation2000) is an analog of PQ (1,1′-Dimethyl-4,4′-bipyridinium dichloride) (Mitra et al. Citation2011). The 50% of lethal dose (LD50) of PQ in humans is 20–40 mg ion/kg of body weight (Vale et al. Citation1987); In rats, the LD50 of oral PQ is 150 mg/kg (World Health and International Programme on Chemical Citation2004), whereas, that of oral DQ is 215-235 mg/kg (Magalhães et al. Citation2018). Therefore, DQ is considered less toxic than PQ (Fortenberry et al. Citation2016). PQ and DQ poisoning remain fairly common in developing countries (Xing et al. Citation2020; Lu et al. Citation2021).
Inhalation, dermal contact, ingestion, and eye contact with PQ can cause organ failure, pulmonary fibrosis, liver injury, kidney injury, and even death. In survivors, PQ poisoning can lead to Parkinson’s disease (PD) or Alzheimer’s disease (AD) (Singh et al. Citation2018). PQ poisoning most severely affects the lungs, and most deaths are attributed to pulmonary fibrosis and respiratory failure. DQ is mainly metabolized by the kidneys. Therefore, DQ poisoning can induce renal failure (Jones and Vale Citation2000). DQ can also damage the liver, heart, gastrointestinal tract, skin, and central nervous system (Magalhães et al. Citation2018; Jones and Vale Citation2000), and lead to death (Xing et al. Citation2020). In contrast to PQ poisoning, pulmonary fibrosis has not been reported for DQ poisoning (McCarthy and Speth Citation1983; Magalhães et al. Citation2018; Jones and Vale Citation2000). Both of them mostly adopt comprehensive treatment, and no specific antidote exists for either type of poisoning (Jones and Vale Citation2000; Sun and He Citation2017). In this study, based on the similar structures of PQ and DQ, shared differentially expressed genes (DEGs) and signaling pathways were explored using GSE153959 data, to identify potential treatment targets.
The effects of DQ and PQ on transforming growth factor-alpha (TGF-alpha) transgenic mouse hepatocytes (TAMHs) (Davis and Stamper Citation2016) in vitro were evaluated, and mitogen-activated protein kinase (MAPK) pathway microarray data (Stamper et al. Citation2010) were analyzed to identify shared DEGs and signaling pathways to provide a basis for gene therapy.
2. Materials and methods
2.1. Affymetrix microarray data
Raw data from GSE153959, contributed by Stamper BD and Nguyen NU, were downloaded from the Gene Expression Omnibus (GEO) database (https://www.ncbi.nlm.nih.gov/geo/), using the GPL17400, [MoGene-2_1-st] Affymetrix Mouse Gene 2.1 ST Array [transcript (gene)] version. RNA was isolated from TAMHs cultured with 18 µM DQ, 126 µM PQ, or control culture media at the 9-hour timepoints. Three groups (three samples per group) were established: control 9_h (CON), diquat (18 µM) 9_h (DQ), and paraquat (126 µM) 9_h (PQ).
2.2. Identification of DEGs
Transcriptome Analysis Console (TAC) 4.0.2 (Affymetrix, Santa Clara, CA, USA) was used to construct a list of DEGs. Three comparisons were established: DQ vs. CON, PQ vs. CON, and DQ vs. PQ. A fold change (FC) ≤ −2 or ≥ 2 and a p. value ≤ 0.05 were selected as the threshold for identifying DEGs. The DEGs of the three groups were identified and visualized using R (version 4.1.2, ggplot2 package, Windows environment) after deleting the incomplete genes.
2.3. Analysis of DEGs in the intersection between DQ vs. CON and PQ vs. CON
The DEGs in the intersection between the DQ vs. CON and PQ vs. CON comparison groups and their expression were shown in the venn diagram and the heat map created with TBtools (Chen et al. Citation2020) (version 1.0986; https://github.com/CJ-Chen/TBtools/releases).
2.4. Gene ontology (GO) and Kyoto encyclopedia of genes and genomes (KEGG) pathway enrichment analysis of DEGs in the intersection between groups
The Database for Annotation, Visualization, and Integrated Discovery (DAVID; version 6.8; https://david.abcc.ncifcrf.gov) was used to analyze the DEGs for GO terms and KEGG pathway enrichment. The thresholds for enriched terms were established as ≥ 2 genes and a p. value ≤ 0.1.
2.5. Protein-protein interaction (PPI) network and module analysis
The interactions of the DEGs were predicted by the Search Tool for the Retrieval of Interacting Genes with a link confidence ≥ 0.04 (STRING, version 11.5; https://string-db.org). The PPI network was constructed using Cytoscape (version 3.8.2, Java 11.0.6), and the cytoHubba plug-in (version 0.1) was used to identify hub genes.
2.6. Circos plot of mouse chromosomes and contrast plot of mouse and human chromosomes
A circos plot was constructed to show the chromosomal location of the mouse genes in the PPI. A contrast plot was drawn to reveal the distribution of these genes on human chromosomes. The circos plot was drawn using TBtools (Chen et al. Citation2020) (version 1.0986; https://github.com/CJ-Chen/TBtools/releases) and MCScanX (Wang et al. Citation2012). The annotation files and genome sequence files for mice (GRCm39) and humans (GRCh38.p13) were downloaded from https://www.gencodegenes.org.
3. Results
3.1. DEGs of the DQ vs. CON and PQ vs. CON comparison groups
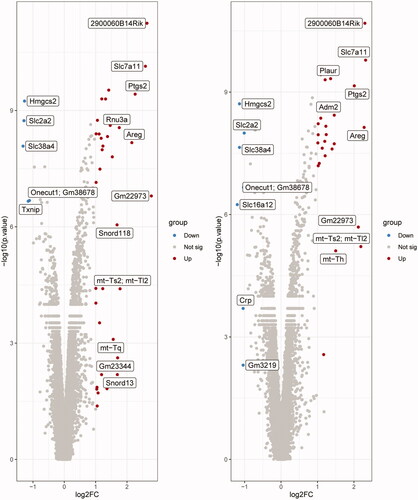
In the DQ vs. CON comparison, 52 DEGs were identified, including 47 upregulated and five downregulated genes, and the volcano plot was shown in . A total of 43 DEGs were identified in the PQ vs. CON comparison, including 36 upregulated and seven downregulated genes, and the volcano plot was shown in . No DEGs were identified in the DQ vs. PQ comparison.
Figure 1. Volcano plots of differentially expressed genes (DEGs). (A) DQ vs. CON and (B) PQ vs. CON. Gray, non-differentially expressed genes; red, significantly upregulated genes; blue, significantly downregulated genes (based on a fold change ≤ -2 or ≥ 2 and a p. value ≤ 0.05). FC, fold change.
3.2. Intersection of DEGs between DQ vs. CON and PQ vs. CON
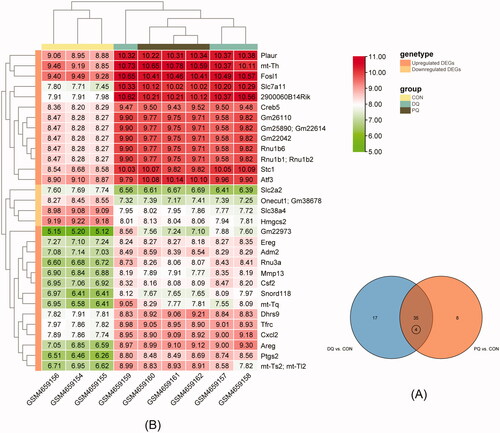
A total of 35 DEGs were shared between the two comparison groups, out of which, four duplicate genes were eliminated. The remaining 31 DEGs included 27 upregulated and four downregulated genes. The Venn diagram was presented in , and the expression of the 31 DEGs was illustrated in .
Figure 2. (A) Venn diagram of intersecting DEGs. (B) Heat map of intersecting DEGs.
3.3. Go and KEGG pathway enrichment analysis of intersecting DEGs
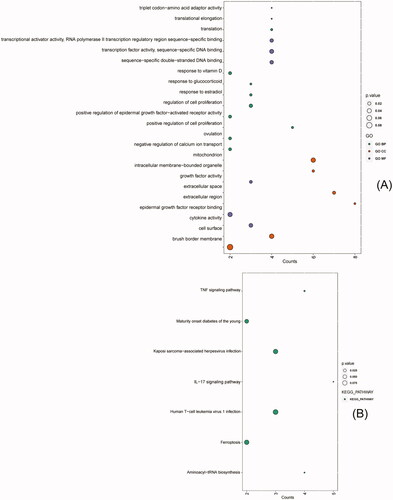
28 biological process (BP) terms, six cellular components (CC) terms, and seven molecular function (MF) terms, and, seven KEGG-pathways were enriched. The enriched BP terms included translational elongation, response to glucocorticoid, translation, positive regulation of cell proliferation, response to estradiol, ovulation, negative regulation of calcium ion transport, positive regulation of epidermal growth factor- activated receptor activity, response to vitamin D, and regulation of cell proliferation. The enriched CC terms included extracellular region, intracellular membrane-bounded organelle, extracellular space, mitochondrion, cell surface and brush border membrane. The enriched MF terms included triplet codon-amino acid adaptor activity, growth factor activity, transcriptional activator activity, RNA polymerase II transcription regulatory region sequence-specific binding, sequence-specific double-stranded DNA binding, cytokine activity, transcription factor activity, sequence-specific DNA binding, and epidermal growth factor receptor binding (). The enriched KEGG pathways included interleukin (IL)-17 signaling pathway, aminoacyl-tRNA biosynthesis, tumor necrosis factor (TNF) signaling pathway, maturity onset diabetes of the young, Kaposi sarcoma-associated herpesvirus infection, ferroptosis and human T-cell leukemia virus 1 infection ().
Figure 3. GO and KEGG enrichment analysis of intersecting DEGs (top 10 hub genes, enriched terms ≥ 2 genes and a p. value ≤ 0.1). (A) GO analysis: Biological Process (BP) (green points), Cellular Component (CC) (red points), and Molecular Function (MF) (purple points). (B) KEGG pathways (green points). Point size indicates the p. value of each point.
3.4. PPI network analysis of intersecting DEGs
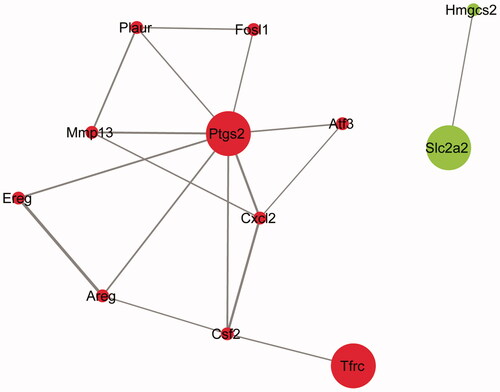
A PPI network of 12 nodes and 17 edges was constructed using Cytoscape software with link confidence ≥ 0.04 (). The cytoHubba plug-in was used to construct an MCC algorithm for identifying hub genes. The top ten hub genes were prostaglandin-endoperoxide synthase 2 (Ptgs2), chemokine (C-X-C motif) ligand 2 (Cxcl2), colony-stimulating factor 2 (granulocyte-macrophage) (Csf2), matrix metallopeptidase 13 (Mmp13), amphiregulin (Areg), plasminogen activator, urokinase receptor (Plaur), fos-like antigen 1 (Fosl1), epiregulin (Ereg), activating transcription factor 3 (Atf3), and transferrin receptor protein (Tfrc). All of these genes were upregulated.
Figure 4. PPI network of the intersecting of DEGs. Red, upregulated genes; green, downregulated genes. Node size was positively related to the source node attribute, edge color and width were positively related to the combined score.
3.5. Circos and contrast plots of mouse and human chromosomes
The Circos plot revealed that Ptgs2 and Atf3 were located on chromosome (chr) 1; Cxcl2, Ereg and Areg on chr5; Csf2 on chr11; Mmp13 on chr9; Plaur on chr7; Fosl1 on chr19; Tfrc on chr16; and Slc2a2 and Hmgcs2 on chr3 (). The contrast diagram illustrated the sequence alignment between the mouse and human genomes, with 11 genes exhibiting collinearity. The aligned sequences were marked in red in , and the details of the sequence alignment were presented in .
Figure 5. Distribution of genes on chromosomes. (A) Circos plot: distribution of genes on mouse chromosomes. Gene symbol-number corresponds to different transcripts. Gray lines, collinearity of all mouse chromosomes; colored lines, collinearity of chromosomes of the 12 mouse genes. (B) Contrast plot of mouse and human genes: comparative distribution of the genes on the mouse and human chromosomes. Gray lines, collinearity of all mouse and human genes; red lines, collinearity of 11 mouse and human genes; orange bars, mouse chromosomes; green bars, human chromosomes.
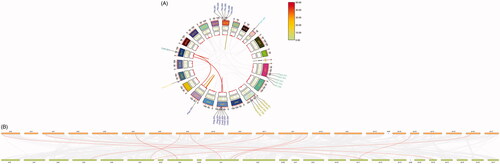
Table 1. Comparative distribution of genes on mouse and human chromosomes.
4. Discussion
In this study, we analyzed intersecting DEGs between the DQ vs. CON and PQ vs. CON comparison groups in TAMHs in vitro. Based on |FC| ≥ 2 and a p. value ≤ 0.05, 52 DEGs in the DQ vs. CON group (47 upregulated and five downregulated) and 43 DEGs in the PQ vs. CON group (36 upregulated and seven downregulated) were identified. Finally, 31 common DEGs were screened (27 upregulated and four downregulated).
The enriched BP terms were mainly cell proliferation and translation; the enriched CC terms were the integrity of the plasma, organelle membranes, and mitochondrion; and the enriched MF terms were mainly transcription factor activity, sequence-specific DNA binding, cytokine and growth factor activity. These GO terms were not specific to any particular organ, indicating that the toxicity of DQ and PQ can affect cells of all organs. A previous study (Huang et al. Citation2019) showed that PQ could reduce the level of DNA methylation, inhibiting the proliferation of human neural stem cells. The enriched KEGG pathways included the IL-17 signaling pathway, TNF signaling pathway, and human T-cell leukemia virus 1 infection (Cao et al. Citation2015; Zhu et al. Citation2018).
Ptgs2 participates in multiple biological processes, including inflammation (Jaén et al. Citation2018), colorectal cancer (Benelli et al. Citation2018), and cardiovascular disease (Mitchell and Kirkby Citation2019). Ptgs1 and Ptgs2 are iso forms of the cyclooxygenase enzyme. Ptgs1 is expressed at a low level in vivo and mainly plays a homeostatic role, whereas Ptgs2 is expressed in response to various challenges and stress conditions. Meloxicam, a Ptgs2 inhibitor, can block apoptosis and cause mitochondrial dysfunction in cells treated with DQ (Choi et al. Citation2018). PQ may be toxic to dopaminergic neurons through Ptgs2 (Yang et al. Citation2010), and Ptgs2 deletion attenuates PQ-induced motor impairment and dopamine utilization in mice (Litteljohn et al. Citation2008). PQ poisoning causes lung edema and hemorrhage, liver congestion, glycogen degeneration, and proximal tubular degeneration in the kidneys of rats, and Ptgs2 expression is upregulated in affected organs (Malekinejad et al. Citation2013).
Cxcl2 plays a crucial role in neutrophil recruitment (Kobayashi Citation2008), and maintains neutrophil homeostasis (Day and Link Citation2012; Lou et al. Citation2017). Csf2 is produced by the oviduct and endometrium (Tríbulo et al. Citation2018) and regulates embryonic development during the preimplantation phase (Hansen et al. Citation2014; Shyam et al. Citation2020). Atf3 is a member of the ATF family, representing a large group of basic-region leucine zipper (bZIP) transcription factors (Thompson et al. Citation2009). Atf3 is an adaptive-response gene involved in cellular processes that adapts to changes in the body (Hai et al. Citation2011), and can regulate inflammation, cancer, and myocardial ischemia (Thompson et al. Citation2009; Yang et al. Citation2016). Cxcl2, Csf2, and Atf3 are target genes of the MAPK8 (JNK1), MPK14 (p38-alpha) and MAP3K1 (MEKK1) reactions in TAMHs in an in vitro hepatocellular model treated with 3′-hydroxyacetanilide (AMAP) and acetaminophen (APAP) for 2 h (Stamper et al. Citation2010). Mitogen-activated protein kinases (MAPKs) are members of a three-kinase phosphorylation system expressed in all cells, composed of MAPK, MAPK kinase (MKK), and MAPK kinase kinase (MKKK). MKKKs phosphorylate and activate MKKs, and MKKs phosphorylate and activate MAPKs. The MAPK family mainly contains ERK, JNK, and p38. MAPK pathways monitor cell growth, toxicant metabolism, and the oxidative stress response (Johnson et al. Citation2005). PQ induces significant phosphorylation of ERK, JNK, and p38 in murine BV2 microglia cells, producing neuroinflammation and neurotoxicity (Wang et al. Citation2020). PQ can also cause neuronal cell apoptosis through the JNK pathway in SH-SY5Y cells (Ju et al. Citation2019) and can damage the lungs through the p38-MAPK pathway (Cui et al. Citation2019; SreeHarsha Citation2020). However, few studies on DQ-induced cell death via the MAPK pathway have been conducted. MAPK14 positively regulates Csf2, and while MAPK14 and MAPK13 are known to regulate Cxcl2 and Atf3, respectively, the direction of regulation is unknown. The circos plot illustrated the distribution of DEGs on different transcripts of mouse chromosomes. Based on our comparison of the DEGs on mouse chromosomes with the corresponding genes on human chromosomes, we hypothesize that these intersection DEGs play an important role in DQ or PQ poisoning in humans. Future studies of these DEGs in humans are needed to assess potential therapeutic target genes and pathways. A limitation of this study was the lack of a basic test for DQ or PQ toxicity; tests for toxicity in human- derived liver cells treated with DQ or PQ should be developed, and blood samples from patients with DQ or PQ poisoning should be collected for further studies.
Author contributions
Changqing Miao arranged the datasets and collected the relevant literature; Dandan Fan designed the research, drew the diagrams, and wrote and revised the manuscript. All authors have read and approved the final manuscript.
Ethics approval and consent to participate
Ethical approval was obtained from the Biomedical Ethics Committee of the Medical department of Xi’an Jiaotong University (2016-135).
Acknowledgment
The authors acknowledge the institutional support from the First Affiliated Hospital of Xi’an JiaoTong University and the hospital library. We thank everyone who participated in the study, those involved in the study design, and those who provided guidance during the study. We appreciate the public data provided by GEO database.
Disclosure statement
The authors declare no conflict of interest.
Additional information
Funding
References
- Benelli R, Venè R, Ferrari N. 2018. Prostaglandin-endoperoxide synthase 2 (cyclooxygenase-2), a complex target for colorectal cancer prevention and therapy. Transl Res. 196:42–61.
- Cao Y, Li J, Ou Z, Yin Z, Chen X, Han Y, Song W. 2015. Inhibition of pulmonary nuclear factor -ΚB and tumor necrosis factor -α expression by diallyl sulfide in rats with paraquat poisoning. Zhonghua Wei Zhong Bing ji Jiu yi Xue. 27(4):274–279.
- Chen C, Chen H, Zhang Y, Thomas HR, Frank MH, He Y, Xia R. 2020. TBtools: an integrative toolkit developed for interactive analyses of big biological data. Mol Plant. 13(8):1194–1202.
- Choi SE, Park YS, Koh HC. 2018. NF-κB/p53-activated inflammatory response involves in diquat-induced mitochondrial dysfunction and apoptosis. Environ Toxicol. 33(10):1005–1018.
- Cui D, Xiao J, Zhou Y, Zhou X, Liu Y, Peng Y, Yu Y, Li H, Zhou X, Yuan Q, et al. 2019. Epiregulin enhances odontoblastic differentiation of dental pulp stem cells via activating MAPK signalling pathway. Cell Prolif. 52(6):e12680.
- Cui S, Nian Q, Chen G, Wang X, Zhang J, Qiu J, Zhang Z. 2019. Ghrelin ameliorates A549 cell apoptosis caused by paraquat via p38-MAPK regulated mitochondrial apoptotic pathway. Toxicology. 426:152267.
- Davis M, Stamper BD. 2016. TAMH: a useful in vitro model for assessing hepatotoxic mechanisms. Biomed Res Int. 2016:4780872.
- Day RB, Link DC. 2012. Regulation of neutrophil trafficking from the bone marrow. Cell Mol Life Sci. 69(9):1415–1423. eng.
- Fortenberry GZ, Beckman J, Schwartz A, Prado JB, Graham LS, Higgins S, Lackovic M, Mulay P, Bojes H, Waltz J, et al. 2016. Magnitude and characteristics of acute paraquat- and diquat-related illnesses in the US: 1998-2013. Environ Res. 146:191–199.
- Hai T, Jalgaonkar S, Wolford CC, Yin X. 2011. Immunohistochemical detection of activating transcription factor 3, a hub of the cellular adaptive-response network. Methods Enzymol. 490:175–194.
- Hansen PJ, Dobbs KB, Denicol AC. 2014. Programming of the preimplantation embryo by the embryokine colony stimulating factor 2. Anim Reprod Sci. 149(1-2):59–66.
- Huang M, Huang NN, Li YY, Wu KX, Guo MZ, Zhu CD. 2019. [Effects of paraquat on the proliferation of human neural stem cells via DNA methylation]. Zhonghua Lao Dong Wei Sheng Zhi ye Bing za Zhi = Zhonghua Laodong Weisheng Zhiyebing Zazhi = Chinese J Indust Hygiene Occup Dis. 37(3):161–168.
- Jaén RI, Prieto P, Casado M, Martín-Sanz P, Boscá L. 2018. Post-translational modifications of prostaglandin-endoperoxide synthase 2 in colorectal cancer: an update. World J Gastroenterol. 24(48):5454–5461.
- Johnson GL, Dohlman HG, Graves LM. 2005. MAPK kinase kinases (MKKKs) as a target class for small-molecule inhibition to modulate signaling networks and gene expression. Curr Opin Chem Biol. 9(3):325–331.
- Jones GM, Vale JA. 2000. Mechanisms of toxicity, clinical features, and management of diquat poisoning: a review. J Toxicol Clin Toxicol. 38(2):123–128.
- Ju DT, Sivalingam K, Kuo WW, Ho TJ, Chang RL, Chung LC, Day CH, Viswanadha VP, Liao PH, Huang CY. 2019. Effect of vasicinone against paraquat-induced MAPK/p53-mediated apoptosis via the IGF-1R/PI3K/AKT pathway in a Parkinson's disease-associated SH-SY5Y cell model. Nutrients. 11(7):1655.
- Kobayashi Y. 2008. The role of chemokines in neutrophil biology. Front Biosci. 13:2400–2407.
- Litteljohn D, Mangano EN, Hayley S. 2008. Cyclooxygenase-2 deficiency modifies the neurochemical effects, motor impairment and co-morbid anxiety provoked by paraquat administration in mice. Eur J Neurosci. 28(4):707–716.
- Lou N, Lennard Richard ML, Yu J, Kindy M, Zhang XK. 2017. The Fli-1 transcription factor is a critical regulator for controlling the expression of chemokine C-X-C motif ligand 2 (CXCL2). Mol Immunol. 81:59–66.
- Lu S, Gao D, Wang Y, Feng X, Zhang Y, Li L, Geng Z. 2021. Development and validation of a radiomics nomogram for prognosis prediction of patients with acute paraquat poisoning: a retrospective cohort study. Biomed Res Int. 2021:6621894.
- Magalhães N, Carvalho F, Dinis-Oliveira RJ. 2018. Human and experimental toxicology of diquat poisoning: Toxicokinetics, mechanisms of toxicity, clinical features, and treatment. Hum Exp Toxicol. 37(11):1131–1160.
- Malekinejad H, Rezabakhsh A, Rahmani F, Razi M. 2013. Paraquat exposure up-regulates cyclooxygenase-2 in the lungs, liver and kidneys in rats. Iran J Pharm Res. 12(4):887–896.
- McCarthy LG, Speth CP. 1983. Diquat intoxication. Ann Emerg Med. 12(6):394–396.
- Mitchell JA, Kirkby NS. 2019. Eicosanoids, prostacyclin and cyclooxygenase in the cardiovascular system. Br J Pharmacol. 176(8):1038–1050.
- Mitra S, Chakrabarti N, Bhattacharyya A. 2011. Differential regional expression patterns of α-synuclein, TNF-α, and IL-1β; and variable status of dopaminergic neurotoxicity in mouse brain after Paraquat treatment. J Neuroinflammation. 8:163.
- World Health and International Programme on Chemical 2004. The WHO recommended classification of pesticides by hazard and guidelines to classification. Geneva: World Health Organization.
- Shyam S, Goel P, Kumar D, Malpotra S, Singh MK, Lathwal SS, Chand S, Palta P. 2020. Effect of Dickkopf-1 and colony stimulating factor-2 on the developmental competence, quality, gene expression and live birth rate of buffalo (Bubalus bubalis) embryos produced by hand-made cloning. Theriogenology. 157:254–262.
- Singh S, Gupta SK, Seth PK. 2018. Biomarkers for detection, prognosis and therapeutic assessment of neurological disorders. Rev Neurosci. 29(7):771–789.
- SreeHarsha N. 2020. Embelin impact on paraquat-induced lung injury through suppressing oxidative stress, inflammatory cascade, and MAPK/NF-κB signaling pathway. J Biochem Mol Toxicol. 34(4):e22456.
- Stamper BD, Bammler TK, Beyer RP, Farin FM, Nelson SD. 2010. Differential regulation of mitogen-activated protein kinase pathways by acetaminophen and its nonhepatotoxic regioisomer 3'-hydroxyacetanilide in TAMH cells. Toxicol Sci. 116(1):164–173.
- Sun B, He Y. 2017. [Paraquat poisoning mechanism and its clinical treatment progress]. Zhonghua Wei Zhong Bing ji Jiu yi Xue. 29(11):1043–1046.
- Thompson MR, Xu D, Williams BR. 2009. ATF3 transcription factor and its emerging roles in immunity and cancer. J Mol Med (Berl). 87(11):1053–1060.
- Tríbulo P, Siqueira LGB, Oliveira LJ, Scheffler T, Hansen PJ. 2018. Identification of potential embryokines in the bovine reproductive tract. J Dairy Sci. 101(1):690–704.
- Vale JA, Meredith TJ, Buckley BM. 1987. Paraquat poisoning: clinical features and immediate general management. Hum Toxicol. 6(1):41–47. eng.
- Wang Y, Tang H, Debarry JD, Tan X, Li J, Wang X, Lee TH, Jin H, Marler B, Guo H, et al. 2012. MCScanX: a toolkit for detection and evolutionary analysis of gene synteny and collinearity. Nucleic Acids Res. 40(7):e49.
- Wang YL, Zheng J, Zhang XF, Zhang Y. 2020. Attenuation of paraquat-induced inflammation by inhibitors of phosphorylation of mitogen-activated protein kinases in BV2 microglial cells. J Neurol Sci. 410:116679.
- Xing J, Chu Z, Han D, Jiang X, Zang X, Liu Y, Gao S, Sun L. 2020. Lethal diquat poisoning manifesting as central pontine myelinolysis and acute kidney injury: a case report and literature review. J Int Med Res. 48(7):300060520943824. 300060520943824.
- Yang CJ, Yang J, Fan ZX, Yang J. 2016. Activating transcription factor 3-an endogenous inhibitor of myocardial ischemia-reperfusion injury (Review). Mol Med Rep. 13(1):9–12.
- Yang W, Tiffany-Castiglioni E, Lee MY, Son IH. 2010. Paraquat induces cyclooxygenase-2 (COX-2) implicated toxicity in human neuroblastoma SH-SY5Y cells. Toxicol Lett. 199(3):239–246.
- Zhu J, Yu Y, Li H, Zheng F, Lin R, Yang C. 2018. Effect of sucralfate on cytokines in rat with paraquat poisoning. Zhonghua Wei Zhong Bing ji Jiu yi Xue. 30(3):220–223.