
Abstract
Drug-induced convulsions—often caused by the inhibition of GABA receptors and stimulation of glutamate receptors—are difficult to predict in animals. In this study, we attempted to detect the proconvulsant potential using motor-evoked potentials (MEPs) after focal electrical stimulation or upon using a functional observational battery (FOB). Pentylenetetrazole, kainic acid, and pilocarpine were used as convulsion-inducing drugs, and baclofen was used as a negative control. First, each compound was administered to male rats, and the FOB tests were performed. All drugs induced behavioral changes, but no commonality was found. Single electrical stimulation train MEPs were recorded under anesthesia for 60 min (at 5 min intervals) after administration of each drug. A dose-dependent increase in MEPs was observed for each convulsion-inducing drug. Moreover, paired electrical stimulation (conditioned and test) of the cerebral motor cortex was conducted with a 1–15 ms interstimulus interval (ISI), 10 min after administration of the drug. All convulsion-inducing drugs inhibited the short-interval intracortical inhibition (ISI: 3 ms), which may be associated with GABA. Intracortical facilitation (ISI: 11 ms), related to glutamate, was not enhanced by any drug but was inhibited by pilocarpine. Dose correlation was not found in short-interval intracortical inhibition or intracortical facilitation in any drugs. No changes in MEPs were observed after baclofen administration. These results suggest that it is possible to evaluate the convulsion potential and associated mechanisms using MEP, independent of the behavioral changes. The early identification of convulsion potential using this model will lead to more efficient drug development.
Introduction
Convulsions are one of the most common drug-induced adverse effects. Though convulsions cause distress or increase the risk of mortality, there are no biomarkers that are able to predict them (Engel and Pitkänen Citation2020). Accordingly, this can lead to the discontinuation of the development of a drug. Thus, it is necessary to assess the baseline risk of drug-induced convulsions to determine the safe dose for conducting clinical studies. Even if a drug candidate is discontinued, it is necessary to investigate the mechanism underlying the occurrence of convulsions to develop drugs that target alternate pathways. Many drug-induced convulsions are caused in response to a decrease in gamma-aminobutyric acid type A (GABAA) levels and an increase in glutamate levels (Chen et al. Citation2016). GABA receptors are expressed in inhibitory neurons and act by suppressing the propagation of excitatory pulses, whereas glutamate receptors are expressed in excitatory neurons and function by inducing the propagation of excitatory pulses. When the balance between excitatory and inhibitory neurons is disrupted, neurons become highly stimulated, and this results in seizures. Although these mechanisms have occasionally been investigated in the field of molecular biology (Enna and McCarson Citation2013), it is challenging to confirm the effects of drugs on GABAA and glutamate receptors in vivo.
To investigate the molecular and neurophysiological mechanisms of epileptic seizures in vivo, magnetic resonance spectroscopy and transcranial magnetic stimulation (TMS) are widely used. These techniques have also been used to evaluate GABAergic and glutamatergic neurons in humans. Proton magnetic resonance spectroscopy utilizing MRI enables the measurement of several brain neurotransmitters, including GABA and glutamate (Zieminska et al. Citation2018; Cuypers et al. Citation2021). TMS can be used to evaluate motor excitability by measuring the motor-evoked potential (MEP), which is the recording of action potentials evoked in skeletal muscles by magnetic or electrical stimulation of the cerebrum. Stimulation of the primary motor cortex excites cortical interneurons and pyramidal neurons that are synaptically connected to the corticospinal tract cells. This stimulation travels down the corticospinal tract and excites alpha-motor neurons on the opposite side of the spinal cord, which travels along motor nerve fibers to induce muscle contractions. By recording this response using electromyography, the pyramidal tract can be indirectly evaluated. In addition, it is known that GABAergic and glutamatergic neurons can be evaluated by paired TMS consisting of a conditioned stimulus below the motor threshold and a test stimulus (Kujirai et al. Citation1993). When the interstimulus interval (ISI) is 1–5 ms, the amplitude of the potential evoked by paired TMS is usually smaller than that of a single stimulus. This phenomenon is called short-interval intracortical inhibition (SICI). Pharmacological studies have shown that the SICI reflects the function of GABAergic interneurons in the motor cortex (Ziemann et al. Citation1996; Di Lazzaro et al. Citation2006). The amplitude of potential evoked by paired TMS increases when the ISI is 6–20 ms. This is known as intracortical facilitation (ICF), which reflects the function of glutamate receptors (Cash et al. Citation2017).
There are few studies on TMS in animals and these experimental conditions have not been identified. Recently, a method using electrical stimulation (ES), instead of magnetic stimulation, was used in anesthetized rats and the MEP results obtained using method were similar to those obtained using TMS in humans (Fujiki, Kawasaki, et al. Citation2020; Fujiki et al. Citation2021). It is also known that the response to electric and magnetic stimulation is different in humans. ES is known to activate axons of corticospinal neurons in the white matter, whereas magnetic stimulation is known to activate the same fibers trans-synaptically (Rossini et al. Citation2015). However, in our previous study, a rat model exhibited SICI and ICF after paired ES training, and the N-methyl-D-aspartate-type glutamate receptor antagonist, MK-801, suppressed ICF (Fujiki et al. Citation2021). Therefore, if SICI and ICF can be evaluated along with human TMS, we assume that it is possible to examine the effects on GABA receptors and glutamate receptors in rats, with which we could predict convulsions in rats. In this study, we administered convulsion-inducing drugs to rats, and evaluated their effects on the motor cortex ES to assess these effects on GABA and glutamate in vivo. Furthermore, we investigated the usefulness of this method as a convulsion prediction system. In addition, using a functional observational battery (FOB), we examined whether there was a correlation between ES results and behavioral changes. We also investigated whether there were clinical signs that preceded seizures.
Materials and methods
Test drugs
Pentylenetetrazole (PTZ, GABAA receptor antagonist, FUJIFILM Wako Pure Chemical Corporation, Osaka, Japan), kainic acid (KA, kainic acid type glutamine receptor agonist, FUJIFILM Wako Pure Chemical Corporation, Osaka, Japan), and pilocarpine hydrochloride (PILO, muscarinic receptor agonist, Tokyo Chemical Industry Co., Ltd., Tokyo, Japan) were used as convulsion-inducing drugs. Baclofen (BAC, GABAB receptor agonist, Tokyo Chemical Industry Co., Ltd.) was used as a negative control. On the day before dosing or on the day of dosing, appropriate amounts of drugs were weighed and dissolved in saline. All the solutions were filtered through a 0.2-micrometer filter. The dose levels used in this study are listed in .
Table 1. Dose setting in functional observational battery (FOB) and motor-evoked potential (MEP) studies.
Animals
Male Crl:CD (SD) rats were purchased from Charles River Japan Inc. (Kanagawa, Japan) and left to acclimate to the laboratory environmental conditions for 1 week. On the day of the experiments, rats were weighed (rats weighing 200–300 g and 250–400 g were used for the FOB and ES test, respectively). The conditions of the room were controlled with the room temperature maintained between 20 °C and 26 °C, a 12-h light/dark cycle, and constant humidity. The rats were allowed free access to a pelleted laboratory animal diet and tap water throughout the experimental period. All experimental protocols were approved by the Ethical Committee of the School of Medicine, Oita University or by the Institutional Animal Care and Use Committee of Shonan Health Innovation Park. The study also conformed to the requirements of the Guide for the Care and Use of Laboratory Animals published by the National Institute of Health.
FOB
A range-finding experiment was performed to set the dose levels for the FOB. The drugs were administered to rats (n = 2/group) subcutaneously and clinical signs were observed until 24 h after administration. The dose levels of this range-finding study were as follows: 25 and 50 mg/kg for PTZ; 5 and 10 mg/kg for KA; 50 and 100 mg/kg for PILO; and 5 and 50 mg/kg for BAC. All animals administered 50 mg/kg PTZ and one animal administered 10 mg/kg KA were euthanized moribund because of convulsions. One animal was euthanized moribund, and the other was found dead after administration of 50 mg/kg of BAC because of the deteriorated physical condition (data not shown). All other animals were euthanized after observation 24 h post-dose. Histopathological examination was not performed in the range-finding experiment. Based on these results, the dose levels for FOB were set at the highest dose that did not induce convulsions or marked deterioration in the condition of animals, as shown in .
The FOB test was conducted before, and 1 and 6 h after subcutaneous administration (n = 4/groups). The following FOB parameters were examined for each animal in the following order: home cage observations (piloerection, skin color, body position, respiration, twitch, convulsion, defecation, and urination), handheld observations (ease of handling, body temperature, body tone, exophthalmos, lacrimation, salivation, and pupil size), open-field observations (abnormal gait, tremor, bizarre behavior, palpebral closure, and locomotor activity), and observations of sensory function and reaction (click response, approach response, tail pinch response, righting reflex, catalepsy, proprioception, forelimb strength, visual placing response, wheelbarrowing, hopping reaction, hindlimb landing foot-splay, and pupil response). Detailed scores for the parameters examined are presented in Supplemental Material 1. After the completion of the FOB test, examination of the Brain Sections Necropsy was performed in all animals 2 days after administration of the drugs. Under isoflurane anesthesia, saline followed by an appropriate amount of 10 vol% neutral buffered formalin was perfused into the left cardiac ventricle to fix the brain. After the animals were euthanized, the brains were harvested, immersed in 10 vol% neutral buffered formalin, and trimmed coronally at seven levels (Bolon et al. Citation2013). These trimmed tissues were embedded in paraffin, sectioned, stained with hematoxylin, eosin, and Fluoro-Jade C, and then microscopically examined.
Motor-evoked potentials
Epidural electrodes, 1.19 mm in diameter, with a flat tip were placed at two locations, 1.0 mm rostral and 2.0 mm lateral (1 R, 2 L), and 3.0 mm rostral and 4.0 mm lateral from bregma (3 R, 4 L). This was done 7 days before administering the drugs under a mixture of 0.15 mg/kg medetomidine, 2.0 mg/kg midazolam and 5.0 mg/kg butorphanol anesthesia (MMB). The screw electrodes were attached in advance to a plastic head connector and they were secured with skull screws and dental acrylic for repeated measurements. A train of three biphasic square wave pulses was delivered with an isolated pulse stimulator to achieve temporal summation for selective activation of the motor cortex (0.2 ms per pulse for each polarity; ISI of 3 ms. The detailed procedure is described in our previous study (Fujiki, Kawasaki, et al. Citation2020). After recovery from the surgical operation (approximately after 7 days), test drugs were intraperitoneally administered to the rats (n = 6–12/group). MEPs were continuously recorded from the contralateral right biceps brachii (BB) muscle via wire-electrodes 0–60 min after administration with an interval of 5 min (Fujiki, Yee, et al. Citation2020; Fujiki, Kawasaki, et al. Citation2020; Fujiki et al. Citation2021). During MEP measurements, the rats were anesthetized with MMB to preserve the motor responses. The MEP data were analyzed offline, as previously reported (Sykes et al. Citation2016; Fujiki et al. Citation2021). MEP amplitudes were measured in a peak-to-peak manner, with 120% resting motor threshold (RMT) stimulus intensity used for MEP recording with an interval of 10 s, where six individual sweeps run each minute (except for the initial 30 min with a 10 s interval, where the three sweeps protocol was run every 5 min). Amplitude was normalized to the final 5 min baseline amplitude and expressed as percentage change, allowing for comparisons between subjects and grouping into 5 min bins.
SICI and ICF were tested 10 min after intraperitoneal administration (n = 5–11/group) using paired electrical stimuli, which was a subthreshold conditioning stimulus (CS) preceding a suprathreshold test stimulus (TS) (Kujirai et al. Citation1993; Fujiki, Kawasaki, et al. Citation2020). SICI and ICF were measured independently from MEP amplitudes in some animals, but measured simultaneously with MEP in the other animals. These stimuli were determined based on RMT, which was measured by varying the stimulator output in 0.1-mA-step until six stable peak-to-peak-50 μV-MEP elicitations were obtained for each of the 12 trials. The subthreshold CS was set at 75% RMT, while the intensity of TS was adjusted to evoke an MEP of approximately 300 μV (peak-to-peak) in the right BB muscle. Two isolated stimulators connected to a custom-made single-stimulus-electrode switching unit were controlled for appropriate stimulus intervals (1, 2, 3, 5, 7, 11, 13, and 15 ms) and intensity (0.5–1.2 mA) in a manner similar to that for the paired TMS (Vahabzadeh-Hagh et al. Citation2011; Fujiki, Kawasaki, et al. Citation2020).
Dose levels of each drug were the same as in the FOB study. The data of the vehicle control were obtained from vehicle-control group data (n = 5 for MEP measurements, and n = 16 for paired electrical stimuli) obtained at the same time from the same breeder in a previous study (Fujiki et al. Citation2021). MEP amplitudes of each ISI were measured in a peak-to-peak manner, and the results were calculated as a percentage of the single ES train response.
Statistical analyses
Data were tested using analysis of variance for the serial measurement data indicating group and time as the first- and second-order factors, respectively. For FOB parameters (body temperature, pupil size, and hindlimb landing foot-splay), when the interactions between group and time factors were found to be significant, the following tests were conducted at each time point. The data at each time point were analyzed for homogeneity of variance using the Bartlett’s test. When the variances were homogeneous, the data were analyzed using the Williams’ test. When the Williams’ test did not identify a significant difference between the vehicle and each dose group, the Dunnett’s test was used to compare the mean value in the vehicle group with the mean value in each dose group. When the variances were heterogeneous based on the Bartlett’s test, the Shirley–Williams test was performed. When significant differences between the vehicle and individual dose groups were not identified using the Shirley–Williams test, the Steel test was used to compare the mean rank in the vehicle group with that in each dose group. For the ES study, statistical analyses were performed for the SICI and ICF (ISI: 3 ms and 11 ms) values. The data at each time point were analyzed for homogeneity of variance using the Bartlett’s test, and no significant differences were observed. The Dunnett’s test was used to compare the mean value in the vehicle group with that in each dose group for individual compounds.
The Bartlett's test was conducted at a significance level of p < 0.05, and the other tests were conducted at two-tailed significance levels of p < 0.05. Statistical analyses were performed using EXSUS (version 8.0) or GraphPad Prism (version 6.0).
Results
Fob
In the range-finding experiment, PTZ and KA induced clonic convulsions at 50 and 10 mg/kg, respectively. Twitches of the whole body and/or extremities were observed at 10 mg/kg KA and 100 mg/kg PILO. In addition to seizure-related findings, mydriasis was observed at a dose of 50 mg/kg PTZ. Wet dog shaking, salivation, and stereotyping were observed at 10 mg/kg KA. Staggering gait, reddish tear, salivation, loose stool, and mydriasis at ≥50 mg/kg and a decrease in locomotor activity at 100 mg/kg were observed with PILO. BAC induced loss of righting reflex, prone position, a decrease in locomotor activity, and mortality at 50 mg/kg. Furthermore, 25 mg/kg of PTZ, 5 mg/kg of KA, and 5 mg/kg of BAC did not show any abnormalities.
The FOB results are shown in and . A statistically significant increase in the pupil size of the left eye was noted 1 h post 25 mg/kg PTZ dose. No clear abnormalities in rats were noted after administration of 12.5 mg/kg of PTZ. A no/weak approach response was noted 6 h post-dose at 5 mg/kg KA. No abnormalities were noted at 2.5 mg/kg KA. PILO at 50 mg/kg induced lacrimation, salivation, weak tail pinch response, abnormal pupil response (no pupillary construction), and an increase in pupil size 1 h post-dose. It also decreased locomotor activity and body temperature at 1 h post-dose, and increased locomotor activity and body temperature at 6 h post-dose. In addition, a weak click response and abnormal hoping reaction were noted at 1 h post-dose at 100 mg/kg of PILO. Prone/lateral position, no locomotor activity, no/weak click response, no response of wheelbarrowing, and abnormal hopping reaction (both forelimb and hindlimb) were observed at 1 h post-dose of 12.5 mg/kg BAC. Abnormal approach response, weak tail pinch response, weak righting reflex, no proprioception response, loss of forelimb strength, and abnormal hopping reaction (both forelimb and hindlimb) were noted at 1 h post-dose of 25 mg/kg BAC. Abnormal gait (leg dragging) and loss of hopping reaction were also noted in one animal at 6 h post-dose of 25 mg/kg BAC. Body temperature was decreased at 1 h post-dose of 12.5 mg/kg BAC without a statistically significant difference. A statistically significant increase in hindlimb landing foot-splay was noted at 1 h post-dose of 12.5 mg/kg BAC and at 6 h post-dose of 25 mg/kg BAC.
Table 2. Group mean scores of behaviors and clinical signs evaluated using a functional observation battery (FOB) test (n = 4 each).
Table 3. Body temperature, pupil size, and hindlimb landing foot-splay evaluated by performing a functional observation battery (FOB) test before, and 1 and 6 h after administration (n = 4 each).
In the macroscopic and microscopic examinations, no compound-related findings were observed in the brains of any animal in any group.
MEPs
The results of time course changes in MEP are shown in and the typical waveforms before and after the administration of each drugs are shown in . No changes were observed after the administration of saline. There was a continuous increase in MEP at high doses of KA, PTZ, and PILO. The changes were sustained until 60 min post-dose of PTZ and KA, but were attenuated in rats administered PILO. The low-dose KA group did not show an increase in the amplitude. For the low-dose groups of PTZ and PILO, the amplitude increased 5 min after administration, but recovered 10 min after administration. BAC did not show any effect on the time course changes in the MEP.
Figure 1. Time course changes in motor-evoked potentials obtained by continuous single electrical stimulation train at 5-minute interval (Mean ± SE). Motor-evoked potential (MEP) amplitude clearly increased at high doses of pentylenetetrazole, kainic acid, and pilocarpine, although baclofen showed no changes.
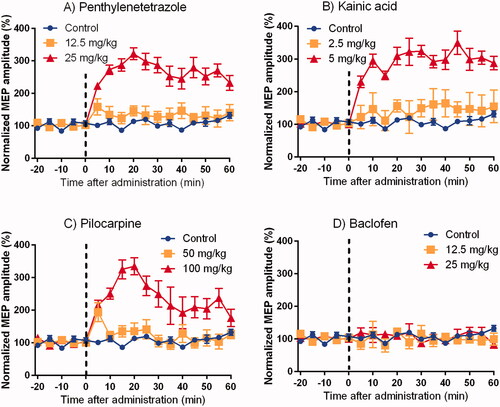
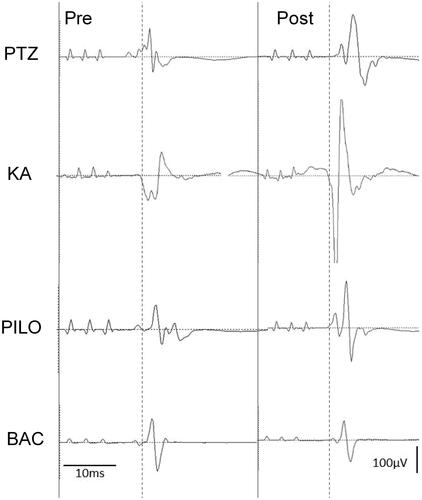
Figure 2. Basic record waveform of motor-evoked potentials (MEPs) recorded from the biceps muscle before and after the administration of penthylenetetrazole (PTZ, 25 mg/kg), kainic acid (KA, 5 mg/kg), pilocarpine (PILO, 100 mg/kg) and baclofen (BAC, 25 mg/kg). Left side is pre-dose waveform and right side is post-dose waveform. At the post-dose of PTZ, KA, or PILO, the peak amplitude of the wave was substantially increased. BAC did not affect the MEP amplitudes.
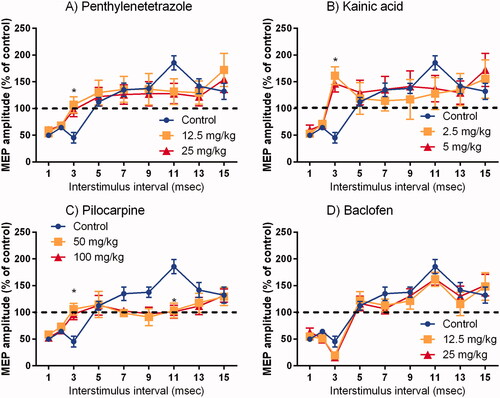
The results for SICI and ICF induced by paired ES are shown in . SICI and ICF were confirmed from 1 to 3 ms and from 7 to 15 ms ISI in the control, respectively. Statistically significant inhibition of SICI (ISI 3 ms) was observed after administration of KA, PTZ, and PILO. Moreover, KA showed an ICF in a broad ISI. PILO significantly inhibited ICF (ISI 11 ms). Although there were no statistical differences, ICF also disappeared at 7, 9, and 13 ms ISI for PILO. As for KA and PTZ, ICF tended to be blocked at 11 ms of ISI, although the difference was not statistically significant. There was no dose-response in the effects of each compound on SICI and ICF at any ISI and no changes in BAC compared to the control.
Figure 3. Amplitude of motor-evoked potentials after paired electrical stimulation train in each interstimulus interval (Mean ± SE). The conditioned responses are expressed as a percentage of the single electrical stimulation train response. *p < 0.05 for both doses compared with the control.
Discussion
We tested the effects of three different convulsion-inducing drugs on different targets (GABA, glutamatergic, and muscarinic-acetylcholine receptors). Continuous and dose-dependent increase in MEP amplitude persisted for up to 60 min for all the convulsion-inducing drugs. The increase in MEP amplitude may indicate an increase in excitatory sensitivity, such as synaptic transmission, and could be an indicator of convulsions. Inhibition of SICI by paired ES trains was also commonly observed in all three convulsion-inducing drugs in this study, suggesting that SICI is also a possible indicator of convulsions. SICI is known for its GABAergic interneuronal function in human TMS (Cash et al. Citation2017). We demonstrate a clear inhibition of SICI in rats with PTZ (GABAA receptor antagonist), likely comparable that in humans. SICI was also inhibited by KA-type glutamate receptor agonists. It has been reported that kainite receptor activation decreases the GABAergic inhibition (Rodríguez-Moreno et al. Citation1997), suggesting that KA might affect the GABAergic functional connectivity of interneurons in the motor cortex.
A previous study, which used ketamine and MK-801 (non-competitive NMDA receptor blockers) showed that inhibition of glutamate receptors inhibits ICF without affecting SICI (Fujiki, Kawasaki, et al. Citation2020; Fujiki et al. Citation2021). Therefore, we hypothesized that ICF was enhanced by KA; however, no enhancement was observed at the time of ICF in the control group. It is postulated that CS might be relatively strong due to the increase in the synaptic excitability caused by KA injection. The baseline increase suggests that the MEP amplitude was already saturated to the upper limit of corticospinal and cortico-muscular excitability; thus, no further ICF enhancement was observed. In fact, the results of SICI patterns after administration of KA are quite reminiscent of those with 80% of the RMT in controls, which is 5% stronger and preceding CS with 3 ms in a previous study (Fujiki, Kawasaki, et al. Citation2020).
PILO, a muscarinic-acetylcholine receptor antagonist, affected both SICI and ICF. There are few studies on the relationship between acetylcholine and TMS that consider the effects of GABA and glutamate. The muscarinic blocker scopolamine has been reported to increase the amplitude of MEPs evoked by magnetic stimulation but does not affect MEPs evoked by ES. Scopolamine has also been reported to have no effect on SICI or ICF by magnetic stimulation (Di Lazzaro et al. Citation2006). Indeed, the mechanism by which PILO affects GABA and glutamate levels should be clarified using multiple methods.
Tremors and twitches are often observed as prodromal symptoms of convulsions in clinical observations. In the range-finding study, twitches were observed in KA and PILO at the convulsive dose; however, behavioral analysis using FOB did not show any common findings in the prodromal symptoms for the three compounds. This suggests that it is difficult to predict the convulsive doses using only phenotypic data. We conducted FOB only 1 and 6 h after administration in the present study, but it is possible that different results could be obtained by increasing the number of time points to account for toxicokinetics.
Although various findings were observed in the FOB test, BAC, a non-convulsant drug, did not change the endpoints of the ES. This evidence support the fact that ES results reflect the potential convulsions caused by drugs. Although SICI and ICF were not affected by BAC, it has been reported that BAC increases the long intracortical inhibition (LICI; ISI 50–200 ms) in human TMS (McDonnell et al. Citation2006).
There are some limitations to this study. We could not compare the behavioral phenotype and MEP at the same blood concentration because we used different administration routes. FOB is not suitable for capturing findings over a short post-dose period, whereas our MEP model was focused on capturing changes over the short post-dose period. Because there was a concern that the subcutaneous administration would fail to capture findings within a short period of time after administration, intraperitoneal administration was chosen for the ES study because of its faster onset of action. Further studies using the same route of administration are planned for the future. In addition, the results were obtained using few compounds in this study; however, it is necessary to confirm the usefulness of this model using more compounds in the future. In particular, it is necessary to consider whether the promotion of ICF, which has not been observed so far, can be evaluated. As there was no dose-response for TES in this study, it will be important to identify the no-effect dose in experiments with lower doses in order to examine the sensitivity of this method.
Conclusion
In the present study, we demonstrated that it might be possible to evaluate the convulsion potential of compounds by combining the time course of MEP and SICI. Thus, using our model, it might be possible to elucidate the mechanism underlying drug-induced convulsions. TMS has been used to elucidate the mechanism underlying epileptic seizures (Cantello et al. Citation2000; Tsuboyama et al. Citation2019). Nevertheless, the results obtained in rats in this study were similar to those of TMS in humans. Extrapolating the findings of our model to TMS in humans would contribute to ensuring the safety of the participants in clinical trials.
Supplemental Material
Download PDF (102 KB)Acknowledgments
We would like to thank Yoshiyuki Furukawa and Harumi Kitaura in Axcelead Drug Discovery Partners Inc. for supporting the experiments on range-finding and FOB studies. We would like to thank Editage (www.editage.com) for English language editing.
Disclosure statement
KK and HO are employees of Takeda Pharmaceutical Company Ltd. No potential conflict of interest was reported by the author(s).
Data availability statement
The data that support the findings of this study are available on request from the corresponding author.
Additional information
Funding
References
- Bolon B, Garman RH, Pardo ID, Jensen K, Sills RC, Roulois A, Radovsky A, Bradley A, Andrews-Jones L, Butt M, et al. 2013. STP position paper: recommended practices for sampling and processing the nervous system (brain, spinal cord, nerve, and eye) during nonclinical general toxicity studies. Toxicol Pathol. 41(7):1028–1048.
- Cantello R, Civardi C, Cavalli A, Varrasi C, Tarletti R, Monaco F, Migliaretti G. 2000. Cortical excitability in cryptogenic localization-related epilepsy: interictal transcranial magnetic stimulation studies. Epilepsia. 41(6):694–704.
- Cash RFH, Noda Y, Zomorrodi R, Radhu N, Farzan F, Rajji TK, Fitzgerald PB, Chen R, Daskalakis ZJ, Blumberger DM. 2017. Characterization of glutamatergic and GABA A-mediated neurotransmission in motor and dorsolateral prefrontal cortex using paired-pulse TMS-EEG. Neuropsychopharmacology. 42(2):502–511.
- Chen HY, Albertson TE, Olson KR. 2016. Treatment of drug-induced seizures. Br J Clin Pharmacol. 81(3):412–419.
- Cuypers K, Hehl M, van Aalst J, Chalavi S, Mikkelsen M, Van Laere K, Dupont P, Mantini D, Swinnen SP. 2021. Age-related GABAergic differences in the primary sensorimotor cortex: a multimodal approach combining PET, MRS and TMS. Neuroimage. 226(vember 2020):117536.
- Engel J, Pitkänen A. 2020. Biomarkers for epileptogenesis and its treatment. Neuropharmacology. 167(July 2019):107735.
- Enna SJ, McCarson KE. 2013. Characterization of GABA receptors. Curr Protoc Pharmacol. 63:1.7.1–1.7.20.
- Fujiki M, Yee KM, Steward O. 2020. Non-invasive high frequency repetitive transcranial magnetic stimulation (hfrTMS) robustly activates molecular pathways implicated in neuronal growth and synaptic plasticity in select populations of neurons. Front Neurosci. 14(June):1–17.
- Fujiki M, Kawasaki Y, Fudaba H. 2020. Continuous theta-burst stimulation intensity dependently facilitates motor-evoked potentials following focal electrical stimulation of the rat motor cortex. Front Neural Circuits. 14(September):1–12.
- Fujiki M, Kuga K, Ozaki H, Kawasaki Y, Hirotaka F. 2021. Blockade of motor cortical long-term potentiation induction by glutamatergic dysfunction causes abnormal neurobehavior in an experimental subarachnoid hemorrhage model. Front Neural Circuits. 15(April):1–11.
- Kujirai T, Caramia MD, Rothwell JC, Day BL, Thompson PD, Ferbert A, Wroe S, Asselman P, Marsden CD. 1993. Corticocortical inhibition in human motor cortex. J Physiol. 471(1):501–519.
- Di Lazzaro V, Pilato F, Dileone M, Ranieri F, Ricci V, Profice P, Bria P, Tonali PA, Ziemann U. 2006. GABAA receptor subtype specific enhancement of inhibition in human motor cortex. J Physiol. 575(Pt 3):721–726.
- McDonnell MN, Orekhov Y, Ziemann U. 2006. The role of GABA(B) receptors in intracortical inhibition in the human motor cortex. Exp Brain Res. 173(1):86–93.
- Rodríguez-Moreno A, Herreras O, Lerma J. 1997. Kainate receptors presynaptically downregulate GABAergic inhibition in the rat hippocampus. Neuron. 19(4):893–901.
- Rossini PM, Burke D, Chen R, Cohen LG, Daskalakis Z, Di Iorio R, Di Lazzaro V, Ferreri F, Fitzgerald PB, George MS, et al. 2015. Non-invasive electrical and magnetic stimulation of the brain, spinal cord, roots and peripheral nerves: basic principles and procedures for routine clinical and research application. An updated report from an I.F.C.N. Committee. Clin Neurophysiol. 126(6):1071–1107.
- Sykes M, Matheson NA, Brownjohn PW, Tang AD, Rodger J, Shemmeii JBH, Reynolds JNJ. 2016. Differences in motor evoked potentials induced in rats by transcranial magnetic stimulation under two separate anesthetics: implications for plasticity studies. Front Neural Circuits. 10(OCT):1–11.
- Tsuboyama M, Lee Kaye H, Rotenberg A. 2019. Biomarkers obtained by transcranial magnetic stimulation of the motor cortex in epilepsy. Front Integr Neurosci. 13(57):57–10.
- Vahabzadeh-Hagh AM, Muller PA, Pascual-Leone A, Jensen FE, Rotenberg A. 2011. Measures of cortical inhibition by paired-pulse transcranial magnetic stimulation in anesthetized rats. J Neurophysiol. 105(2):615–624.
- Ziemann U, Rothwell JC, Ridding MC. 1996. Interaction between intracortical inhibition and facilitation in human motor cortex. J Physiol. 496(3):873–881.
- Zieminska E, Toczylowska B, Diamandakis D, Hilgier W, Filipkowski RK, Polowy R, Orzel J, Gorka M, Lazarewicz JW. 2018. Glutamate, glutamine and GABA levels in rat brain measured using MRS, HPLC and NMR methods in study of two models of autism. Front Mol Neurosci. 11:418.