
Abstract
Background: Clozapine is an atypical antipsychotic drug used to treat treatment-resistant schizophrenia. Its side effects, including liver enzyme abnormalities, experienced by many patients preclude its more common use as a first-line therapy for schizophrenia. Toxicoproteomic approaches have been demonstrated to effectively guide the identification of toxicological mechanisms.
Methods: To further our understanding of the molecular effects of clozapine, we performed a data-independent acquisition (DIA)-based quantitative proteomics investigation of clozapine-treated human liver spheroid cultures.
Results: In total, we quantified 4479 proteins across the five treatment groups (vehicle; 15 µM, 30 µM, and 60 µM clozapine; and 10 ng/mL TNFα + IL-1β). Clozapine (60 µM) treatment yielded 36 differentially expressed proteins (FDR < 0.05). Gene-set enrichment analysis indicated perturbation of several gene sets, including interferon gamma signaling (e.g. interferon gamma receptor 1) and prominent autophagy-related processes (e.g. upregulation of sequestosome-1 (SQSTM1), MAP1LC3B/LC3B2, GABARAPL2, and nuclear receptor coactivator 4). The effects of clozapine on autophagy were confirmed by targeted mass spectrometry and western blotting using conventional SQSTM1 and LC3B markers.
Conclusions: Combined with prior literature, our work suggests a broad contribution of autophagy to both the therapeutic and side effects of clozapine. Overall, this study demonstrates how proteomics can contribute to the elucidation of physiological and toxicological mechanisms of drugs.
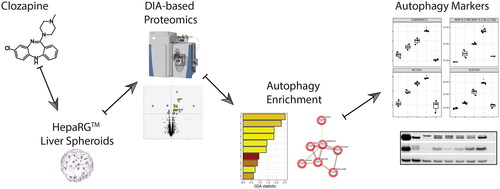
GRAPHICAL ABSTRACT
1. Introduction
Clozapine is an atypical antipsychotic drug used to treat treatment-resistant schizophrenia (Haidary and Padhy Citation2020). As a drug developed in 1961, clozapine is still considered one of the most effective drugs against schizophrenia, which often induces remarkable symptom relief and improves quality of life (Orsolini et al. Citation2016; De Berardis et al. Citation2018). However, the side effects experienced by many patients preclude its common use as a first-line therapy for schizophrenia (Orsolini et al. Citation2016). Common side effects of clozapine include sedation, hypertension, weight gain, and seizures, and less common side effects include liver enzyme abnormalities and agranulocytosis or granulocytopenia (De Berardis et al. Citation2018). In addition, clozapine has a large inter-individual variability in plasma concentrations when the same dose is administered (Dailly et al. Citation2002; Lee et al. Citation2009). Combined with the narrow therapeutic window of the drug, therapeutic drug monitoring is advised (Thorn et al. Citation2018; Albitar et al. Citation2020; Jovanović et al. Citation2020). Clozapine is metabolized by the hepatic cytochrome P450 (CYP) microsomal system. The drug is converted to norclozapine by CYP3A4 and CYP1A2 and to clozapine N-oxide by CYP3A4 (Eiermann et al. Citation1997; Buur-Rasmussen and Brøsen Citation1999). Drug–drug interactions that affect P450 enzymes, such as oral contraceptives and antifungals, can lead to a significant change in clozapine metabolism. Miconazole and ketoconazole have been demonstrated to inhibit clozapine metabolism by more than 50% (Bun et al. Citation1999). This interaction leads to an increase in the plasma concentration of the parent compound, and a narrow therapeutic index leads to significant clozapine toxicity (Jovanović et al. Citation2020).
The molecular effects of clozapine have been investigated using diverse test systems and methods; for example, identifying the upregulation of lipogenic SREBP target genes upon acute clozapine treatment in rat liver (Fernø et al. Citation2009), reduction in hepatic sphingolipid levels in clozapine-treated rats (Weston-Green et al. Citation2018), and the effects of clozapine on mitochondrial morphology and function in vitro (Contreras-Shannon et al. Citation2013). However, in-depth proteomic investigations of the effects of clozapine are rare. For example, a shotgun proteomics study with human oligodendrocytes found that clozapine affects ubiquitination, proteasome degradation, lipid metabolism, and DNA damage repair processes (Seabra et al. Citation2020).
In the framework of systems toxicology studies, toxicoproteomic approaches have been demonstrated to effectively guide the identification of toxicological mechanisms (Titz et al. Citation2014; Suman et al. Citation2016). For example, a data-independent acquisition (DIA)-based proteomics approach has been used to investigate acetaminophen-induced liver toxicity in liver spheroid cultures (Bruderer et al. 2015).
Here, to further expand our understanding of the molecular effects of clozapine, we performed a DIA-based quantitative proteomics investigation of clozapine-treated human in vitro liver spheroid cultures.
2. Materials and methods
2.1. Preparation of liver spheroid cultures
Liver spheroids composed of HepaRG™ cells were prepared as described previously (Bovard et al. Citation2018). Briefly, cryopreserved and differentiated HepaRG cells (Thermo Fisher Scientific, Waltham, MA, USA; Catalog number: HPRGC10) were thawed in William’s E medium containing Thaw, Plate, and General Purpose supplement (Thermo Fisher Scientific) and GlutaMAX (Thermo Fisher Scientific). Spheroids composed of 5000 cells were prepared by diluting 10 million cells in a cryopreserved vial with 200 mL of William’s E medium and seeding 100 μL of this cell suspension into each well of an ultra-low-adhesion 96-well plate (Nunclon Sphera 3D, Thermo Fisher Scientific). The 96-well plates were incubated at 37 °C for 2 days, after which 100 μL of medium was added to each well. On the fifth day, 50% of the medium in each well was replaced with fresh media. On the same day, the cells formed dense aggregates with a visible extracellular matrix, confirming spheroid formation. Thereafter, the cell culture medium was renewed every two to three days. The spheroids were used from the seventh day after the HepaRG cells were thawed.
2.2. Metabolite measurement
For the measurement of clozapine metabolization and metabolites formation, HepaRG liver spheroids were incubated with 62.5 µM Clozapine (Sigma Aldrich, Merck KGaA, Darmstadt, Germany; Catalog number: C6305) for 48 h. Supernatants were collected and analyzed by Pharmacelsus GmbH (Saarbrücken, Germany) using semi-quantitative liquid chromatography–mass spectroscopy (LC–MS).
Metabolite analysis was performed using an LC-MS Q-Exactive Plus Orbitrap instrument (Thermo Scientific). The data were then processed using a customized workflow in Compound Discoverer™ 2.1.0.398 software (Thermo Scientific). The workflow assembled various data processing techniques, such as mass defect filtering and matching isotope patterns. Based on the parent drug structure, appropriate transformations were generated, raw data were processed, and positive hits were selectively adopted. The structures of the discovered metabolites were further confirmed by accurate mass product ion spectra of parent and suspected metabolites if applicable. Accurate mass characterization of the parent ion structure provided a basis for assessing the structural assignment of the metabolites. Metabolite analysis included screening for phase I and II metabolites, followed by identification of their structures using high-resolution mass spectrometry. Peak areas of metabolites detectable in the Compound Discoverer were generated using the standard software Xcalibur 4.0.27.19. For metabolite screening, the use of authentic standards for each of the potential metabolites was not foreseen; however, the formation of metabolites in relation to the parental compound was evaluated using a semi-quantitative approach, and the peak areas of metabolites and the parental compound were compared based on the assumption of an identical instrument response for parent/components and metabolites.
2.3. Viability measurement
The viability of HepaRG spheroids was evaluated by measuring the level of adenosine triphosphate in a single liver spheroid after 48 and 96 h of incubation (n = 8) with a range of clozapine concentrations (0 µM and 1–2000 µM). For the 96 h duration, the treatment was renewed after 48 h by replacing 50% (v/v) of the media with fresh media containing the original (1x) clozapine concentration. The spheroid and its medium were transferred to a 96-well white polystyrene microplate, and the same volume of CellTiter-Glo® reagent (Promega, Madison, WI, USA) was added to the plate. Luminescence was measured 30 min later by using a FLUOstar Omega plate reader (BMG Labtech, Ortenberg, Germany).
2.4. Proteomics by the data-independent acquisition approach
HepaRG spheroids were treated with 15, 30, or 60 µM clozapine; 10 ng/mL TNFα + IL-1β; or vehicle control for 48 h (n = 3). For each replicate, 20 spheroids, corresponding to 100 000 initial cells in the spheroid preparation (see above), were washed with PBS, pooled, and stored at −80 °C until further processing.
Proteins were precipitated using 400 µL of precooled methanol, then sonicated for 10 s at 10% amplitude using a sonifier (Branson, Danbury, Connecticut, USA). Samples were centrifuged at 12 700 rpm and the protein pellet was resuspended in 50 µL of Preomics Lyse (Martinsried, Germany) buffer and sonicated for 10 s at 10% amplitude to allow the complete resuspension of the pellet. Then, 30 µg of protein extract was processed according to the manufacturer’s protocol (Preomics) with trypsin digestion conducted for 3 h. Next, 3 µg of peptide digest was injected on to a 50 cm Easy-nanoLC (AcclaimPepMap C18, 75 μm × 500 mm, 100 Å, particle size 2 μm) on an Easy nLC 1200 instrument coupled to a Q-Exactive HF (Thermo Scientific) mass spectrometer in DIA mode. Peptides were separated using a 110 min gradient from 0% buffer B to 40% buffer B (buffer A: 1% acetonitrile, 0.1% formic acid, and buffer B: 95% acetonitrile, 0.1% formic acid). The Q-Exactive HF was operated in DIA mode using 23 variable windows. DIA data analysis was performed in DirectDIA mode using Spectronaut software (version 14.3.200701.47784, Biognosys, Schlieren, Switzerland) with factory settings and the Homo sapiens Swissprot database from February 2019.
2.5. Proteomics by a parallel-reaction monitoring approach
The peptide digests were spiked with heavily labeled peptides. The peptides were injected on to a 15 cm easy-nanoLC column connected to a Q-Exactive HF instrument. Peptides were separated using a gradient from 4% to 35% LC buffer B for 33 min. The Q-Exactive HF was operated in the PRM mode. PRM data were analyzed using SpectroDive (version 8.0.14288.9.24402, Biognosys, Schlieren, Switzerland) in factory settings.
2.6. Luminex-based cytokine measurements
Supernatants from liver spheroid cultures were sampled for quantification of cytokines/chemokines (GRO, G-CSF, GM-CSF, IL-1α, IL-1β, IL-6, IL-8, IL-13, IFN-γ, IP-10, VEGF, and TNFα). The analyte levels were measured with Luminex® xMAP® (Luminex Corporation, Austin, TX, USA) technology using the commercially available MILLIPLEX® MAP Human Cytokine/Chemokine/Growth Factor Panel A (Merck KGaA, Darmstadt, Germany; catalog number: HCYTA-60K-12C). The samples were undiluted and 25-fold diluted. The samples were assayed in duplicate according to the manufacturer’s protocol. The plate was read using a Luminex® FLEXMAP 3D® instrument equipped with xPONENT® software (Version 4.2, Luminex Corp). The analyte concentrations (pg/mL) were determined by the instrument after back-fitting the median fluorescence intensities using a five-parameter logistic curve. Values from the undiluted samples were used, and values above the limit of quantification were replaced with values from the 25-fold dilution.
2.7. Western blots and autophagy flux experiments
For the autophagy marker experiments, HepaRG spheroids were treated with 15, 30, or 60 µM clozapine; 10 ng/mL TNFα + IL-1β; 20 µM chloroquine; combinations of 30, or 60 µM clozapine with 20 µM chloroquine; or vehicle control for 24 h (n = 3). For each replicate, 30 spheroids, corresponding to 150 000 initial cells in the spheroid preparation (see above), were washed with PBS, pooled, and stored at −80 °C until further processing.
For Western blot analysis, HepaRG spheroid pellets were resuspended in RIPA buffer (containing Protease inhibitor mix 1:100 dilution, (GE product number 80-6501-23) and PhosphoSTOP (Roche) tab) and sonicated for lysis. Protein extracts were centrifuged for 5 min at 18 000 g at 4 °C and total protein amount was measured using 660 nm assay (Thermo) following the supplier’s protocol. Western blots were performed using 6 µg of protein with the following antibodies: LCB3 (Catalog # 12741, Cellular Signaling Technology, Danvers, MA, USA), p62 (Catalog # 8025, Cellular Signaling Technology), and beta actin (Catalog # 4970, Cellular Signaling Technology). Transfer was performed with the iBlot2 Transfer device (Catalog # IB21001, Thermo Fisher), using the P3 predefined program (20 V, 7 min). The image acquisition has been done with the Odyssey XF imaging system (Li Cor). Each signal was normalized to its corresponding beta actin band.
2.8. ALT measurement
Hepatotoxicity was assessed by measuring the levels of alanine aminotransferase (ALT) in supernatant of the spheroids. ALT was measured using Human ALT ELISA kit (Abcam, Cambridge, UK ref. ab234578) from 50 µL of a single liver spheroid supernatant after 24 h incubation (n = 6) with a clozapine concentration 30 and 60 µM, chloroquine concentration of 20 µM and co-stimulation with both. The optical density at 450 nm was determined using a FLUOstar Omega plate reader (BMG Labtech, Ortenberg, Germany).
2.9. Computational and statistical analyses
Statistical analyses were performed using GraphPad Prism (version 9) and R statistical environment. Statistical tests included two-way analysis of variance with Dunnett’s post-hoc comparison and pairwise t-tests. The statistical significance threshold was set at p < 0.05.
For DIA-based proteomics, the mass-list outputs of the mass spectrometry runs were interrogated against the human proteome set using a library-free DIA approach (directDIA) with Spectronaut (Version 14, Biognosys, Schlieren, Switzerland). DirectDIA quantification data were exported and processed in the R statistical environment. For each protein, the obtained quantification values for its quantified peptide/charge states were summed. Data were log2 transformed and normalized for equal medians across all samples. To detect differentially expressed proteins, a linear model was fitted for each treatment condition and its respective control group, and p values from moderated t-statistics were calculated using the empirical Bayes approach (Gentleman et al. Citation2004). The Benjamini–Hochberg False Discovery Rate (FDR) method was used to correct for multiple testing effects, and proteins with an adjusted p value < 0.05 were considered as differentially expressed/abundant.
Gene-set analysis (GSA) was conducted against the Reactome pathway database using the piano library in R (Väremo et al. Citation2013; Fabregat et al. Citation2018). The scores from the t-statistics were used as gene-/protein-level statistics, and the mean was used as the gene-set statistic. Functional clustering of the differentially expressed proteins following clozapine treatment was performed using the STRING database network and STRINGdb R library (Szklarczyk et al. Citation2021; version 11.5). Functional protein associations between the differentially expressed proteins with a score ≥ 0.4 were considered and clustering was performed with the ‘fastgreedy’ algorithm. Overrepresentation analysis was performed within the same framework with all quantified proteins as the background.
For Western Blots, two targeted proteins were investigated, LCB3 and p62. The quantification of protein expression was normalized to beta-actin. To determine the effect of treatment and concentration on protein expression, data were log2 transformed and a linear model was fitted for each protein. Dunnett test was conducted to compare treatment by concentration relative to control. When pairwise tests included comparisons between the different treatments and concentration, FDR correction was applied. Data processing and analyses were performed in R (version 3.5.1).
3. Results and discussion
3.1. Clozapine’s effect on liver spheroid viability
In this study, we assessed the effects of clozapine on human spheroid liver culture. For this purpose, we used HepaRG spheroid cultures. Previously, such 3D cultures supported the creation of multi-organ chip co-culture models for exposure studies (Schimek et al. Citation2020).
First, we assessed the effect of clozapine on liver spheroid viability by testing a concentration of up to 2000 µM clozapine for a 48 or 96 h dosing period (). For the 48 h period, liver spheroid culture viability was maintained with a concentration of up to 62.5 µM clozapine; for the 96 h period, liver spheroid culture viability was maintained with a concentration of up to 31.25 µM clozapine.
Figure 1. Viability of liver spheroids with clozapine and metabolism of clozapine. (A) Dose-dependent effect of clozapine on liver spheroid viability. The adenosine triphosphate content values were normalized with the values obtained in untreated spheroids (100%). Each dot corresponds to the mean ± standard deviation (n = 8). Two-way analysis of variance with Dunnett’s post comparison vs. untreated **** (p < 0.0001). (B) Metabolites resulting from clozapine metabolization. The structure of the seven metabolites (M1–M7; M6, norclozapine; M2, clozapine N-oxide) predicted after incubation of liver spheroids with clozapine. (C) Proportion of clozapine metabolites. Each bar corresponds to the mean ± standard error of the mean (n = 12).
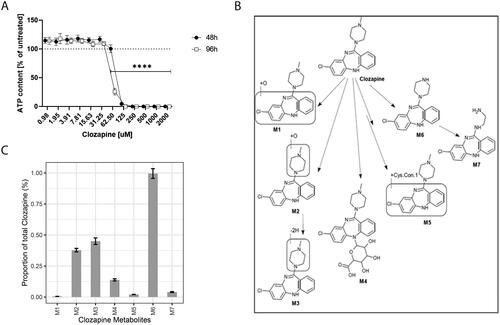
Clozapine is metabolized into several metabolites (). For example, the ratio of clozapine to norclozapine (M6), the main metabolite of clozapine, has been associated with decreased neutrophil counts in long-term clozapine users (Willcocks et al. Citation2021). While not necessarily pointing to a specific role of the metabolite norclozapine, these results support the general relevance of clozapine’s metabolism for its (side) effects. To evaluate the extent of clozapine metabolism in our in vitro culture system, we semi-quantified its metabolites using LC–MS after 48 h of incubation (). Most of the clozapine remained unmetabolized. Four of the investigated clozapine metabolites (M2, M3, M4, and M6) reached levels of above 0.1%, but all remained below 1% of the unmetabolized clozapine concentration. Thus, the observed effects of clozapine are likely related to clozapine itself rather than to one of its metabolites, such as norclozapine.
3.2. Clozapine’s effect on the proteome of liver spheroids
To investigate clozapine’s mechanism of liver toxicity, we applied a DIA-based quantitative proteomics approach. DIA is an emerging mass spectrometry-based quantitative proteomics approach that enables consistent and accurate proteomic analysis (Gillet et al. Citation2012). For example, the DIA approach has been used to investigate the effects of acetaminophen treatment in a 3D liver in vitro model (Bruderer et al. Citation2015).
Based on the in vitro cytotoxicity results, we tested the effects of clozapine treatment at three concentrations (15, 30, and 60 µM) for a treatment duration of 48 h. Clozapine’s Cmax concentration in human studies was reported as 2.45 µM (Vorrink et al. Citation2018). The tested concentrations in our in vitro model correspond to 6.1 × Cmax, 12.2 × Cmax, and 24.5 × Cmax, which is in line with the tested concentration ranges in in vitro drug-induced liver injury assessment studies (Vorrink et al. Citation2018).
In addition, we included 10 ng/mL TNFα + IL-1β treatment as a control for the potential inflammatory effects induced by clozapine. Immune-mediated mechanisms have been proposed for the positive and negative effects of clozapine during schizophrenia treatment (Røge et al. Citation2012; De Berardis et al. Citation2018; Pandurangi and Buckley Citation2020). Up to 50% of patients develop fever and flu-like symptoms during the first weeks of treatment – symptoms that have been associated with increases in inflammatory cytokine (e.g. IL-6) and C-reactive protein levels (Maes et al. Citation1997; Kohen et al. Citation2009; Klemettilä et al. Citation2014).
We quantified 4479 proteins across the five treatment groups and analyzed them in three biological replicates. Compared to the untreated control group, we identified 180 and 36 differentially expressed proteins for TNFα + IL-1β and 60 µM clozapine treatment, respectively, whereas no protein was significant for the lower clozapine concentrations (FDR adjusted p value < 0.05) (, Supplementary Table 1).
Figure 2. Clozapine’s effect on the liver spheroid proteome. (A) Volcano plot showing the log2 fold-change (x-axis) and statistical significance (−log10 FDR adjusted p value, y-axis). Significantly differentially expressed proteins (FDR adjusted p value < 0.05, n = 3) are indicated with larger dots. (B) Comparison of the proteome response to TNFα + IL-1β versus 60 µM clozapine treatment. Fold-change responses of differentially expressed proteins upon TNFα + IL-1β treatment are compared. (C) Gene-set enrichment results for 60 µM clozapine treatment. See Supplementary Table 2 for more details. (D) Autophagy-related protein cluster. All included proteins were upregulated. See Supplementary Figure 3 for more details. (E) Protein expression profiles of differentially expressed proteins upon 60 µM clozapine exposure. Autophagy-related proteins are highlighted in bold.
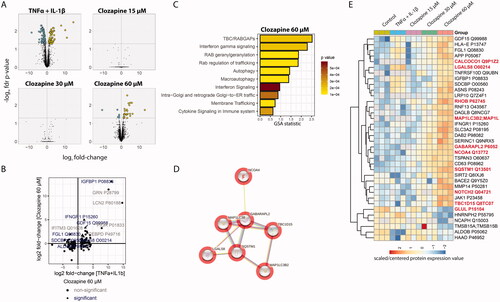
Evaluation of the protein changes upon TNFα + IL-1β treatment by GSA indicated the expected perturbation of several immune-related gene/protein sets, including cytokine, inflammasome, and innate immune cell-related gene/protein sets (Supplementary Table 2). Most of the protein levels affected by TNFα + IL-1β treatment did not significantly change upon clozapine treatment (), suggesting that clozapine did not induce a broad inflammatory response in liver spheroid cultures. However, interferon gamma receptor 1 (IFNGR1) was significantly upregulated by both TNFα + IL-1β and 60 µM clozapine treatment. IFNGR1 upregulation in the liver has been observed upon exposure to liver toxicants (Jellali et al. Citation2021), and IFN-γ has been found to affect the fate of hepatocytes (Horras et al. Citation2011). Insulin-like growth factor-binding protein 1 (IGFBP1) was strongly upregulated by both treatments. IGFBP1 is associated with autophagy regulation (Galluzzi et al. Citation2014).
For 60 µM clozapine treatment, GSA indicated perturbation of several gene sets, which included interferon gamma signaling (IFNGR1) and autophagy/macroautophagy-related processes (). Similarly, functional network analysis indicated the enrichment of an autophagy-related protein cluster (). Autophagy results in catabolization of intracellular components, including proteins and organelles, through lysosomal recycling. In the liver, autophagy plays an important homeostatic role in energy balance and regeneration of organelles; however, it has also been associated with liver-associated diseases (Ke Citation2019). Interestingly, a previous study found the accumulation of autophagosomes upon clozapine treatment in in vitro cultures of rat primary neurons (Park et al. Citation2012). In addition, a previous study showed that clozapine induces autophagy via the AMPK-ULK1-Beclin1 signaling pathway in the rat frontal cortex (Kim et al. Citation2018). In contrast, the protective effect of clozapine on neural stem cells has been associated with decreased expression of the autophagosome marker 1 A/1B-light chain 3 (LC3-II) (Lundberg et al. Citation2020).
In the current study, the autophagy-related effects triggered by clozapine treatment included the upregulation of sequestosome-1 (SQSTM1), Microtubule Associated Protein 1 Light Chain 3 Beta (MAP1LC3B), GABA Type A Receptor Associated Protein Like 2 (GABARAPL2), and nuclear receptor coactivator 4 (NCOA4) (), as well as changes in the abundance of other autophagy-associated proteins. SQSTM1 (p62) is an autophagy receptor that interacts with autophagy marker MAP1LC3B (Bjørkøy et al. Citation2005). During autophagy, the precursor protein MAP1LC3B/LC3B2 is cleaved by ATG4B to form the cytosolic LC3-I form, which is subsequently conjugated to phosphatidylethanolamine to form the autophagosome membrane-bound LC3-II form (Tanida et al. Citation2004). GABARAPL2 is a ubiquitin-like modifier involved in autophagy (Weidberg et al. Citation2010). NCOA4 is a selective cargo receptor for autophagic turnover of ferritin (ferritinophagy) (Mancias et al. Citation2014). Other proteins involved in selective autophagy are calcium binding and coiled-coil domain 1 CALCOCO1), which is implicated in Golgi apparatus turnover (Golgiphagy) and ER-phagy (Nthiga et al. Citation2020, Citation2021), and TBC1 domain family member 15 (TBC1D15), which plays a role in mitophagy by promoting the clearance of damaged mitochondria in cardiomyocytes (Yu et al. Citation2020). However, the autophagy-inhibiting role of TBC1D15 has also been reported (Ejlerskov et al. Citation2020). Moreover, from the list of proteins affected by clozapine treatment, galectin 8 (LGALS8) was found to activate autophagy through CALCOCO2. In addition, LGALS8, ras homolog family member B (RHOB), and glutamate-ammonia ligase (GLUL) have been shown to inhibit the mechanistic target of rapamycin kinase (MTOR), a major anti-autophagic regulator (van der Vos and Coffer Citation2012; Jia et al. Citation2019). In our proteomics assay, the regulation of LGALS8 and RHOB was opposite to that of GLUL peptide; while LGALS8 and RHOB levels were increased, GLUL peptide levels were decreased, although these changes were moderate. Notch receptor 2 may also be involved in autophagy regulation through modulation of the MTOR signaling pathway (Zheng et al. Citation2020).
Taken together, quantitative proteome profiling suggests an effect of clozapine treatment on both inflammation- and autophagy-related biological processes. We conducted additional measurements to further investigate the potential relevance of these effects at the proteome level.
3.3. Clozapine’s effect on the cytokine response of liver spheroids
To follow up on the inflammation-related effects, we quantified cytokines released into the media by human liver spheroid cultures after 48 h of treatment using a multiplex Luminex assay (). Control treatment with TNFα + IL-1β (10 ng/mL) induced the expected strong cytokine-release response, including induction of IL-8, G-CSF, GM-CSF, GRO, IL-13, IL-1α, IL-1β, IL-6, IP-10, and TNFα (Supplementary Figure 1).
Figure 3. Clozapine’s effect on cytokine secretion. Cytokine secretion was quantified by Luminex technology. Analytes quantified above the limit of quantification were selected for this figure. T-test versus untreated were evaluated (ns, non-significant; *p < 0.05; **p < 0.01; ***p < 0.001; ****p < 0.0001). See Supplementary Figure 1 for the whole cytokine panel.
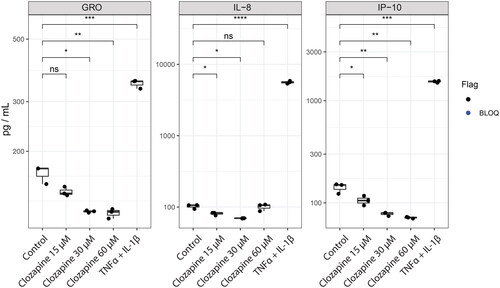
In contrast to TNFα + IL-1β treatment, clozapine treatment at the three tested concentrations (15, 30, and 60 µM) had a much more limited effect on cytokine levels. Indeed, only GRO, IL-8, and IP-10 levels were found to be above the lower limit of quantification under clozapine treatment conditions (). Interestingly, all three cytokines showed significantly lower levels upon clozapine treatment, whereas all were substantially induced by TNFα + IL-1β treatment.
From this, we can exclude the strong pro-inflammatory effect of clozapine in this in vitro model. However, it is important to note that we only tested the direct effect of clozapine without considering other synergistic relationships or including Kupffer cells in our model. For example, Hadi et al. found that clozapine could amplify LPS-induced TNFα release in human precision-cut liver slices (Hadi et al. Citation2013).
3.4. Clozapine’s effect on autophagy in liver spheroids
To further evaluate the effect of clozapine on autophagy, as suggested by the proteomics results, we first investigated the dose-response of four autophagy-related proteins (SQSTM1, MAP1LC3B/LC3B, NCOA4, and GABARAPL2; ). All four markers demonstrated a clear dose-response to clozapine treatment, with statistical significance compared with the control at 60 µM clozapine treatment. We also confirmed this response for SQSTM1 using a targeted mass spectrometry approach, again demonstrating a clear dose-dependent induction of the autophagy marker SQSTM1 upon clozapine treatment (). Furthermore, induction of SQSTM1 was recapitulated by a western blot assay (). In addition, clozapine treatment strongly induced the LCB3-II form of the autophagic marker LC3 (MAP1LC3B) (Bjørkøy et al. Citation2005), which represents the autophagosome membrane-bound form (see above) (Tanida et al. Citation2004).
Figure 4. Clozapine induces autophagy in liver spheroid cultures. (A) Quantification of autophagy markers by data-independent acquisition. See Supplementary Figure 4 for additional autophagy-related proteins. (B) Confirmation of sequestosome-1 (SQSTM1) induction upon clozapine exposure, measured by the targeted proteomics approach. (C) Western blots of SQSTM1 and LCB3I/II, including Clozapine and Chloroquine combination treatments. (D) Boxplot of the quantification of western blot results. (E) Heatmap summarizing the results of the statistical comparisons for the western blots (panels C and D). Log2 fold-changes of the indicated comparisons are color coded and statistical significance is marked (+, FDR adjusted p value < 0.01; *, FDR adjusted p value < 0.05; n = 3).
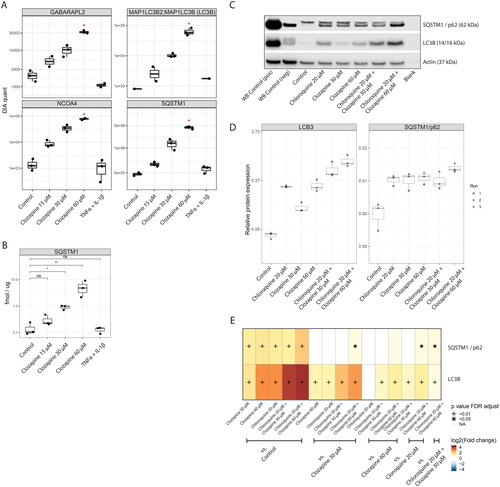
This increase in autophagy markers may represent induction of autophagy with increased synthesis of these markers or decreased flux through the autophagy pathway due to blockage of autophagosome maturation or degradation. Combination treatment with autophagy inhibitors such as chloroquine, which inhibits autophagy by preventing the fusion of autophagosomes with lysosomes (Mauthe et al. Citation2018), has been used to further investigate the mechanisms how compounds affect autophagic flux (Klionsky et al. Citation2021).
In our model system, treatment with 20 µM chloroquine by itself upregulated 208 protein groups and downregulated 156 protein groups as measured by DIA-based proteomics (4726 protein groups quantified in total; see Supplementary Figure 2(A)). Six autophagy-related markers (SQSTM1, MAP1LC3B/LC3B, NCOA4, GABARAPL2, GLUL, RHOB) were significantly differentially regulated upon chloroquine treatment (see Supplementary Figure 2(B)) including four identical markers as with the clozapine only treatment – suggesting a general similarity between cloroquine’s and clozapine’s effects on the autophagic process in liver microtissues.
In a co-treatment experiment with chloroquine and clozapine, LCB3-II was significantly further induced compared to single treatment with chloroquine, and SQSTM1 showed significant co-treatment induction, but only for the higher clozapine concentration of 60 µM. Thus, these data are consistent with an induction of autophagic influx by clozapine treatment, although – also, considering the limited effects of combination treatment – an effect of clozapine on autophagic efflux cannot be ruled out. Of note, combination treatment with the higher clozapine concentration (60 µM) increase ALT media concentrations, as an indicator of hepatotoxicity (Supplementary Figure 2(C)).
Consistent with the observed modulating effect of clozapine on autophagy, a previous study on rat primary neurons identified accumulation of autophagosomes upon clozapine treatment (Park et al. Citation2012). In this case, the authors found that clozapine blocks autophagosome turnover, including impaired lysosomal fusion. Recently, Paterganni et al. proposed a causal role for autophagy in multiple sclerosis and suggested that clozapine, as an autophagy inhibitor, is a novel treatment option (Patergnani et al. Citation2021).
Modulation of autophagic flux in the liver can have different outcomes depending on the context. For example, chloroquine improved carbon tetrachloride-induced acute liver injury in mice (Dai et al. Citation2018). On the contrary, paracetamol-induced hepatotoxicity is enhanced by chloroquine-induced autophagy inhibition (Ni et al. Citation2012). Therefore, monitoring liver-related effects of autophagy modulators is relevant, especially under conditions where the liver is challenged by other exposures or physiological conditions.
Overall, these follow-up assays confirmed the effect of clozapine on autophagy in the employed 3D liver model. A partial additive effect of clozapine and chloroquine treatment suggested that induction of autophagic flux by clozapine contributes to the observed effect. However, further investigation would be required to more precisely decipher the specific mechanism(s) how clozapine affects autophagic flux in the liver.
4. Conclusions
Guided by proteomic data, we identified a modulating effect of clozapine on autophagy in human liver spheroid cultures. Clozapine has a long history as an atypical antipsychotic drug for treatment-resistant schizophrenia, but its side effect profile precludes its use as a first-line therapy. Clozapine’s efficacy for schizophrenia treatment has been associated with its effect on autophagy, and multiple sclerosis has been proposed as a novel indication that might benefit from clozapine’s effect on autophagy. On the other hand, drugs with similar effects on autophagy, such as chloroquine, have been found to exacerbate hepatotoxicity – demonstrating complex interactions with pathophysiological states and other exposures. Overall, this exemplifies the general challenge with powerful drugs that target broad cellular mechanisms, such as autophagy, which poses challenges for finding a meaningful tradeoff between drug benefits and generalized side effects.
Author contributions
Catherine Nury: Conceptualization, Formal analysis, Methodology, Investigation, Supervision, Writing – Original Draft; Celine Merg: Investigation, Supervision, Writing – Review & Editing; Yvan Eb-Levadoux: Methodology, Formal analysis, Investigation, Writing – Review & Editing; David Bovard: Methodology, Formal analysis, Investigation, Visualization, Writing – Review & Editing; Matthieu Porchet: Investigation, Writing – Review & Editing; Fabio Maranzano: Investigation, Writing – Review & Editing; Isidora Loncarevic: Investigation, Writing – Review & Editing; Shahrzad Tavalaei: Investigation, Writing – Review & Editing; Eleonore Lize: Investigation, Writing – Review & Editing; Ramona Liliana Demenescu: Methodology, Formal analysis, Writing – Review & Editing Hasmik Yepiskoposyan: Methodology, Writing – Review & Editing; Julia Hoeng: Funding acquisition, Writing – Review & Editing; Nikolai V Ivanov: Supervision, Writing – Review & Editing; Kasper Renggli: Conceptualization, Supervision, Writing – Review & Editing; Bjoern Titz: Conceptualization, Formal analysis, Visualization, Supervision, Writing – Original Draft.
Supplemental Material
Download PDF (176.6 KB)Supplemental Material
Download PDF (613.6 KB)Supplemental Material
Download PDF (7.8 MB)Supplemental Material
Download PDF (144.4 KB)Supplemental Material
Download MS Excel (30.1 KB)Supplemental Material
Download MS Excel (23.4 KB)Acknowledgements
The authors would like to thank the study team at Philip Morris Products S.A., Neuchâtel, Switzerland. Furthermore, the authors would like to thank the study team of Pharmacelsus GmbH for the generation of data on clozapine metabolism and the Editage team for editing a draft of the manuscript.
Disclosure statement
All authors are employees of Philip Morris International or contracted and paid by Philip Morris International.
Data availability statement
The mass spectrometry proteomic data are available from the ProteomeXchange Consortium through the PRIDE partner repository (http://www.ebi.ac.uk/pride/archive/) (Perez-Riverol et al. Citation2019), with the identifier PXD034257and PXD038007.
Additional information
Funding
References
- Albitar O, Harun SN, Zainal H, Ibrahim B, Sheikh Ghadzi SM. 2020. Population pharmacokinetics of clozapine: a systematic review. Biomed Res Int. 9872936. https://doi.org/10.1155/2020/9872936.
- Bjørkøy G, Lamark T, Brech A, Outzen H, Perander M, Overvatn A, Stenmark H, Johansen T. 2005. p62/SQSTM1 forms protein aggregates degraded by autophagy and has a protective effect on huntingtin-induced cell death. J Cell Biol. 171(4):603–614.
- Bovard D, Sandoz A, Luettich K, Frentzel S, Iskandar A, Marescotti D, Trivedi K, Guedj E, Dutertre Q, Peitsch MC, et al. 2018. A lung/liver-on-a-chip platform for acute and chronic toxicity studies. Lab Chip. 18(24):3814–3829.
- Bruderer R, Bernhardt OM, Gandhi T, Miladinović SM, Cheng L-Y, Messner S, Ehrenberger T, Zanotelli V, Butscheid Y, Escher C, et al. 2015. Extending the limits of quantitative proteome profiling with data-independent acquisition and application to acetaminophen-treated three-dimensional liver microtissues. Mol Cell Proteomics. 14(5):1400–1410.
- Bun H, Disdier B, Aubert C, Catalin J. 1999. Interspecies variability and drug interactions of clozapine metabolism by microsomes. Fundam Clin Pharmacol. 13(5):577–581.
- Buur-Rasmussen B, Brøsen K. 1999. Cytochrome P450 and therapeutic drug monitoring with respect to clozapine. Eur Neuropsychopharmacol. 9(6):453–459.
- Contreras-Shannon V, Heart DL, Paredes RM, Navaira E, Catano G, Maffi SK, Walss-Bass C. 2013. Clozapine-induced mitochondria alterations and inflammation in brain and insulin-responsive cells. PLoS One. 8(3):e59012.
- Dai C, Xiao X, Li D, Tun S, Wang Y, Velkov T, Tang S. 2018. Chloroquine ameliorates carbon tetrachloride-induced acute liver injury in mice via the concomitant inhibition of inflammation and induction of apoptosis. Cell Death Dis. 9(12):1–13.
- Dailly E, Urien S, Chanut E, Claudel B, Guerra N, Fernandez C, Jolliet P, Bourin M. 2002. Evidence from a population pharmacokinetics analysis for a major effect of CYP1A2 activity on inter- and intraindividual variations of clozapine clearance. Prog Neuropsychopharmacol Biol Psychiatry. 26(4):699–703.
- De Berardis D, Rapini G, Olivieri L, Di Nicola D, Tomasetti C, Valchera A, Fornaro M, Di Fabio F, Perna G, Di Nicola M, et al. 2018. Safety of antipsychotics for the treatment of schizophrenia: a focus on the adverse effects of clozapine. Ther Adv Drug Saf. 9(5):237–256.
- Eiermann B, Engel G, Johansson I, Zanger UM, Bertilsson L. 1997. The involvement of CYP1A2 and CYP3A4 in the metabolism of clozapine. Br J Clin Pharmacol. 44(5):439–446.
- Ejlerskov P, Rubinsztein DC, Pocock R. 2020. IFNB/interferon-β regulates autophagy via a MIR1-TBC1D15-RAB7 pathway. Autophagy. 16(4):767–769.
- Fabregat A, Jupe S, Matthews L, Sidiropoulos K, Gillespie M, Garapati P, Haw R, Jassal B, Korninger F, May B, et al. 2018. The reactome pathway knowledgebase. Nucleic Acids Res. 46(D1):D649–D655.
- Fernø J, Vik-Mo AO, Jassim G, Håvik B, Berge K, Skrede S, Gudbrandsen OA, Waage J, Lunder N, Mørk S, et al. 2009. Acute clozapine exposure in vivo induces lipid accumulation and marked sequential changes in the expression of SREBP, PPAR, and LXR target genes in rat liver. Psychopharmacology. 203(1):73–84.
- Galluzzi L, Pietrocola F, Levine B, Kroemer G. 2014. Metabolic control of autophagy. Cell. 159(6):1263–1276.
- Gentleman RC, Carey VJ, Bates DM, Bolstad B, Dettling M, Dudoit S, Ellis B, Gautier L, Ge Y, Gentry J, et al. 2004. Bioconductor: open software development for computational biology and bioinformatics. Genome Biol. 5(10):R80–R16.
- Gillet LC, Navarro P, Tate S, Röst H, Selevsek N, Reiter L, Bonner R, Aebersold R. 2012. Targeted data extraction of the MS/MS spectra generated by data-independent acquisition: a new concept for consistent and accurate proteome analysis. Mol Cell Proteomics. 11(6):O111. 016717.
- Hadi M, Westra IM, Starokozhko V, Dragovic S, Merema MT, Groothuis GM. 2013. Human precision-cut liver slices as an ex vivo model to study idiosyncratic drug-induced liver injury. Chem Res Toxicol. 26(5):710–720.
- Haidary HA, Padhy RK. 2020. Clozapine. In: StatPearls. Treasure Island (FL): StatPearls Publishing LLC. https://www.ncbi.nlm.nih.gov/books/NBK535399/.
- Horras CJ, Lamb CL, Mitchell KA. 2011. Regulation of hepatocyte fate by interferon-γ. Cytokine Growth Factor Rev. 22(1):35–43.
- Jellali R, Jacques S, Essaouiba A, Gilard F, Letourneur F, Gakière B, Legallais C, Leclerc E. 2021. Investigation of steatosis profiles induced by pesticides using liver organ-on-chip model and omics analysis. Food Chem Toxicol. 152:112155.
- Jia J, Abudu YP, Claude-Taupin A, Gu Y, Kumar S, Choi SW, Peters R, Mudd MH, Allers L, Salemi M, et al. 2019. Galectins control MTOR and AMPK in response to lysosomal damage to induce autophagy. Autophagy. 15(1):169–171.
- Jovanović M, Vučićević K, Miljković B. 2020. Understanding variability in the pharmacokinetics of atypical antipsychotics – focus on clozapine, olanzapine and aripiprazole population models. Drug Metab Rev. 52(1):1–18.
- Ke P-Y. 2019. Diverse functions of autophagy in liver physiology and liver diseases. IJMS. 20(2):300.
- Kim SH, Park S, Yu HS, Ko KH, Park HG, Kim YS. 2018. The antipsychotic agent clozapine induces autophagy via the AMPK-ULK1-Beclin1 signaling pathway in the rat frontal cortex. Prog Neuropsychopharmacol Biol Psychiatry. 81:96–104.
- Klemettilä JP, Kampman O, Seppälä N, Viikki M, Hämäläinen M, Moilanen E, Leinonen E. 2014. Cytokine and adipokine alterations in patients with schizophrenia treated with clozapine. Psychiatry Res. 218(3):277–283.
- Klionsky DJ, Abdel-Aziz AK, Abdelfatah S, Abdellatif M, Abdoli A, Abel S, Abeliovich H, Abildgaard MH, Abudu YP, Acevedo-Arozena A, et al. 2021. Guidelines for the use and interpretation of assays for monitoring autophagy. Autophagy. 17(1):1–382.
- Kohen I, Afzal N, Hussain S, Manu P. 2009. Increases in C-reactive protein may predict recurrence of clozapine-induced fever. Ann Pharmacother. 43(1):143–146.
- Lee ST, Ryu S, Nam HJ, Lee SY, Hong KS. 2009. Determination of pharmacokinetic properties of clozapine and norclozapine in Korean schizophrenia patients. Int Clin Psychopharmacol. 24(3):139–144.
- Lundberg M, Curbo S, Bohman H, Agartz I, Ögren SO, Patrone C, Mansouri S. 2020. Clozapine protects adult neural stem cells from ketamine-induced cell death in correlation with decreased apoptosis and autophagy. Biosci Rep. 40(1):BSR20193156.
- Maes M, Bosmans E, Kenis G, De Jong R, Smith RS, Meltzer HY. 1997. In vivo immunomodulatory effects of clozapine in schizophrenia. Schizophr Res. 26(2-3):221–225.
- Mancias JD, Wang X, Gygi SP, Harper JW, Kimmelman AC. 2014. Quantitative proteomics identifies NCOA4 as the cargo receptor mediating ferritinophagy. Nature. 509(7498):105–109.
- Mauthe M, Orhon I, Rocchi C, Zhou X, Luhr M, Hijlkema K-J, Coppes RP, Engedal N, Mari M, Reggiori F. 2018. Chloroquine inhibits autophagic flux by decreasing autophagosome-lysosome fusion. Autophagy. 14(8):1435–1455.
- Ni H-M, Bockus A, Boggess N, Jaeschke H, Ding W-X. 2012. Activation of autophagy protects against acetaminophen-induced hepatotoxicity. Hepatology. 55(1):222–232.
- Nthiga TM, Shrestha BK, Bruun JA, Larsen KB, Lamark T, Johansen T. 2021. Regulation of Golgi turnover by CALCOCO1-mediated selective autophagy. J Cell Biol. 220(6):e202006128.
- Nthiga TM, Kumar Shrestha B, Sjøttem E, Bruun JA, Bowitz Larsen K, Bhujabal Z, Lamark T, Johansen T. 2020. CALCOCO1 acts with VAMP-associated proteins to mediate ER-phagy. EMBO J. 39(15):e103649.
- Orsolini L, Tomasetti C, Valchera A, Vecchiotti R, Matarazzo I, Vellante F, Iasevoli F, Buonaguro EF, Fornaro M, Fiengo ALC, et al. 2016. An update of safety of clinically used atypical antipsychotics. Expert Opin Drug Saf. 15(10):1329–1347.
- Pandurangi AK, Buckley PF. 2020. Inflammation, antipsychotic drugs, and evidence for effectiveness of anti-inflammatory agents in schizophrenia. Curr Top Behav Neurosci. 44:227–244.
- Park J, Chung S, An H, Kim J, Seo J, Kim DH, Yoon SY. 2012. Haloperidol and clozapine block formation of autophagolysosomes in rat primary neurons. Neuroscience. 209:64–73.
- Patergnani S, Bonora M, Ingusci S, Previati M, Marchi S, Zucchini S, Perrone M, Wieckowski MR, Castellazzi M, Pugliatti M, et al. 2021. Antipsychotic drugs counteract autophagy and mitophagy in multiple sclerosis. Proc Natl Acad Sci USA. 118(24):e2020078118.
- Perez-Riverol Y, Csordas A, Bai J, Bernal-Llinares M, Hewapathirana S, Kundu DJ, Inuganti A, Griss J, Mayer G, Eisenacher M, et al. 2019. The PRIDE database and related tools and resources in 2019: improving support for quantification data. Nucleic Acids Res. 47(D1):D442–D450.
- Røge R, Møller BK, Andersen CR, Correll CU, Nielsen J. 2012. Immunomodulatory effects of clozapine and their clinical implications: what have we learned so far? Schizophr Res. 140(1-3):204–213.
- Schimek K, Frentzel S, Luettich K, Bovard D, Rütschle I, Boden L, Rambo F, Erfurth H, Dehne E-M, Winter A, et al. 2020. Human multi-organ chip co-culture of bronchial lung culture and liver spheroids for substance exposure studies. Sci Rep. 10(1):7865.
- Seabra G, de Almeida V, Reis-de-Oliveira G, Crunfli F, Antunes A, Martins-de-Souza D. 2020. Ubiquitin-proteasome system, lipid metabolism and DNA damage repair are triggered by antipsychotic medication in human oligodendrocytes: implications in schizophrenia. Sci Rep. 10(1):12655.
- Suman S, Mishra S, Shukla Y. 2016. Toxicoproteomics in human health and disease: an update. Expert Rev Proteomics. 13(12):1073–1089.
- Szklarczyk D, Gable AL, Nastou KC, Lyon D, Kirsch R, Pyysalo S, Doncheva NT, Legeay M, Fang T, Bork P, et al. 2021. The STRING database in 2021: customizable protein–protein networks, and functional characterization of user-uploaded gene/measurement sets. Nucleic Acids Res. 49(D1):D605–D612.
- Tanida I, Sou YS, Ezaki J, Minematsu-Ikeguchi N, Ueno T, Kominami E. 2004. HsAtg4B/HsApg4B/autophagin-1 cleaves the carboxyl termini of three human Atg8 homologues and delipidates microtubule-associated protein light chain 3- and GABAA receptor-associated protein-phospholipid conjugates. J Biol Chem. 279(35):36268–36276.
- Thorn CF, Müller DJ, Altman RB, Klein TE. 2018. PharmGKB summary: clozapine pathway, pharmacokinetics. Pharmacogenet Genomics. 28(9):214–222.
- Titz B, Elamin A, Martin F, Schneider T, Dijon S, Ivanov NV, Hoeng J, Peitsch MC. 2014. Proteomics for systems toxicology. Comput Struct Biotechnol J. 11(18):73–90.
- van der Vos KE, Coffer PJ. 2012. Glutamine metabolism links growth factor signaling to the regulation of autophagy. Autophagy. 8(12):1862–1864.
- Väremo L, Nielsen J, Nookaew I. 2013. Enriching the gene set analysis of genome-wide data by incorporating directionality of gene expression and combining statistical hypotheses and methods. Nucleic Acids Res. 41(8):4378–4391.
- Vorrink SU, Zhou Y, Ingelman-Sundberg M, Lauschke VM. 2018. Prediction of drug-induced hepatotoxicity using long-term stable primary hepatic 3D spheroid cultures in chemically defined conditions. Toxicol Sci. 163(2):655–665.
- Weidberg H, Shvets E, Shpilka T, Shimron F, Shinder V, Elazar Z. 2010. LC3 and GATE-16/GABARAP subfamilies are both essential yet act differently in autophagosome biogenesis. Embo J. 29(11):1792–1802.
- Weston-Green K, Babic I, De Santis M, Pan B, Montgomery MK, Mitchell T, Huang X-F, Nealon J. 2018. Disrupted sphingolipid metabolism following acute clozapine and olanzapine administration. J Biomed Sci. 25(1):1–11.
- Willcocks IR, Legge SE, Nalmpanti M, Mazzeo L, King A, Jansen J, Helthuis M, Owen MJ, O’Donovan MC, Walters JTR, et al. 2021. Clozapine metabolism is associated with absolute neutrophil count in individuals with treatment-resistant schizophrenia. Front Pharmacol. 12:658734.
- Yu W, Sun S, Xu H, Li C, Ren J, Zhang Y. 2020. TBC1D15/RAB7-regulated mitochondria-lysosome interaction confers cardioprotection against acute myocardial infarction-induced cardiac injury. Theranostics. 10(24):11244–11263.
- Zheng D, Tao M, Liang X, Li Y, Jin J, He Q. 2020. p66Shc regulates podocyte autophagy in high glucose environment through the Notch-PTEN-PI3K/Akt/mTOR pathway. Histol Histopathol. 35(4):405–415.