
 ?Mathematical formulae have been encoded as MathML and are displayed in this HTML version using MathJax in order to improve their display. Uncheck the box to turn MathJax off. This feature requires Javascript. Click on a formula to zoom.
Abstract
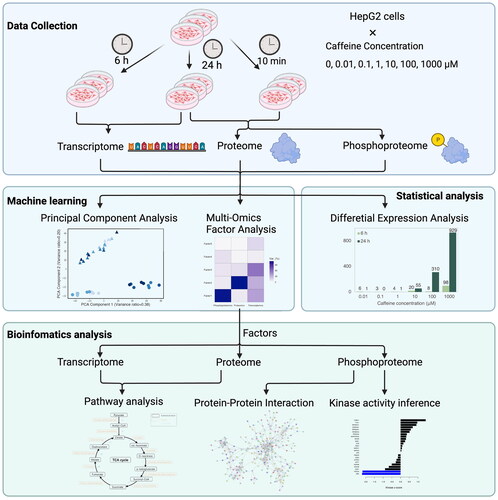
Comprehensive analysis of multi-omics data can reveal alterations in regulatory pathways induced by cellular exposure to chemicals by characterizing biological processes at the molecular level. Data-driven omics analysis, conducted in a dose-dependent or dynamic manner, can facilitate comprehending toxicity mechanisms. This study introduces a novel multi-omics data analysis designed to concurrently examine dose-dependent and temporal patterns of cellular responses to chemical perturbations. This analysis, encompassing preliminary exploration, pattern deconstruction, and network reconstruction of multi-omics data, provides a comprehensive perspective on the dynamic behaviors of cells exposed to varying levels of chemical stimuli. Importantly, this analysis is adaptable to any number of omics layers, including site-specific phosphoproteomics. We implemented this analysis on multi-omics data obtained from HepG2 cells exposed to a range of caffeine doses over varying durations and identified six response patterns, along with their associated biomolecules and pathways. Our study demonstrates the effectiveness of the proposed multi-omics data analysis in capturing multidimensional patterns of cellular response to chemical perturbation, enhancing understanding of pathway regulation for chemical risk assessment.
GRAPHICAL ABSTRACT
1. Introduction
A significant advancement for modern risk assessment has been the transition away from conventional animal experiments toward target-specific and mechanism-based biological observations primarily derived from in vitro assays (Tice et al. Citation2013; Wang Citation2018). This contemporary approach to toxicological assessment presents challenges, particularly considering the rapidly escalating need for testing (about 300 new chemicals are introduced in the U.S. alone annually), the necessity of endpoint determination, and the imperative to assess the effect of chemical mixtures (Titz et al. Citation2014). These factors underscore the urgent need for a comprehensive understanding of toxicological mechanisms that can inform and support the development of toxicity predictions for diverse human exposure scenarios.
Chemical exposure can initiate a range of effects at the regulatory pathway level in cells or organisms, including changes in the levels, interaction, and feedback loops of various types of biomolecules. Omics technologies such as proteomics allow for the identification and quantification of biomolecules of a particular type, thereby detecting changes at one level. From a toxicological perspective, omics technologies enable the generation of information about substance-induced molecular perturbations in cells that are related to adverse outcomes, thereby enabling a systemic understanding of adverse outcome pathways (AOPs) (Canzler et al. Citation2020). While single-omics analysis can provide information about biomarker identification for certain exposures, it lacks the capacity to facilitate a systematic comprehension of toxicity pathways or AOPs. The integration of multiple omics datasets integration offers a promising approach to significantly improve the detection of pathway responses to a toxicant by increasing the amount of information and providing a systematic understanding (Canzler et al. Citation2020). The necessity to integrate multi-omics measurements for a comprehensive understanding of AOPs was emphasized at the European Center for Ecotoxicology and Toxicology of Chemicals (ECETOC) workshop (Buesen et al. Citation2017).
To identify pathways responding to chemical exposure, transcriptomics, proteomics, phosphoproteomics, and metabolomics are considered as potential information providers. In transcriptomics, pathway responses can be detected through a known set of target genes that are differentially expressed. Similarly, pathway response in proteomics is largely detected by proteins that are found differentially expressed in a given pathway. Phosphoproteomics studies can identify up to 20,000 phosphorylation sites and an association of these phosphorylation sites to the pathways is possible (von Stechow et al. Citation2015).
The acquisition of multi-omics data following exposure to different doses of varied classes of chemicals at varying durations potentially promotes the development of more universal models, designed for a comprehensive range of experimental conditions, thereby benefiting chemical risk assessment (Antczak et al. Citation2013). Some studies have begun to investigate toxicity mechanisms at time and dose dimensions. For example, Selevsek et al. (Citation2020) integrated time-series transcriptome, proteome and methylome data to unravel the adverse mechanisms of anthracycline cardiotoxicity and proved the spectrum of anthracyclines in various multiple critical cellular systems. Lee et al. (Citation2021) used transcriptomics, proteomics, and metabolomics data of zebrafish larvae exposed to different concentrations of perfluorooctanesulfonic acid to elucidate the molecular mechanism underlying the developmental neurotoxicity with the signature of axonal deformation, neuroinflammatory stimulation, and dysregulation of calcium ion signaling. Li et al. (Citation2023) captured the events chain of the cellular response to chemical exposure from transcriptome, proteome, and phosphoproteome analyzed separately at different doses of caffeine and coumarin at different time points.
Despite these advances, there is a need to develop reproducible protocols that support the integration of multivariate multi-omics data to facilitate the incorporation of omics techniques into chemical risk assessment. In this study, we present an analysis for the first time for integrating multi-omics data to concurrently capture dose-dependent variance and temporal changes in response to chemical exposure. This analysis combines statistical analysis, machine learning, and bioinformatics analysis methods. Statistical analysis, differential expression analysis here, was applied to identify differentially expressed biomolecules at different conditions. Machine learning methods include principal component analysis (PCA) and multi-omics factor analysis (MOFA) (Argelaguet et al. Citation2020). The visualization of PCA enables a preliminary observation about whether the omics data change with variables (time and doses). MOFA was employed to infer the latent factors that capture variability. Biomolecules associated with a latent factor in each layer-omics were identified and further analyzed for biological function. Bioinformatics analysis methods include ReactomeGSA (Griss et al. Citation2020) to integrate transcriptomics and proteomics data for pathway analysis; STRING database (Szklarczyk et al. Citation2021) to construct protein–protein interaction networks from phosphoproteomics; and Kinase-Substrate Enrichment Analysis (KSEA) (Wiredja et al. Citation2017) to infer kinase activity. Notably, the application of this analysis is not confined to specific omics layers. We use the experimental data of caffeine including transcriptomics proteomics and phosphoproteomics as a case study to implement the analysis. We present the first description of in-depth integrative analysis of transcriptomics proteomics and site-specific phosphoproteomics. The datasets measuring the cellular response to different doses of caffeine at three time points were collected from the literature (Li et al. Citation2023). PCA confirmed the cellular response varies with time and concentration. MOFA identified six response patterns, which were further analyzed with ReactomeGSA, STRING, and KSEA to reconstruct the cellular events.
2. Methods
2.1. Data collection and preprocessing
The analysis was applied to the multi-omics data collected from the available publication and pre-processed following the original paper (see Supplementary materials) (Li et al. Citation2023). HepG2 cells were incubated with 7 different concentrations of caffeine (0, 0.01, 0.1, 1, 10, 100, 1000 ). For the transcriptomics study, the cells were harvested after 6 and 24 h incubation and then the expression profile of genes was obtained. For proteomics and phosphoproteomics study, the cells were harvested after 10 min and 24 h incubation. For each concentration at every time point, three biological replicates were performed.
2.2. Principal component analysis (PCA)
PCA was performed to reduce the dimensionality of each omics dataset and visualize the variation in the data caused by caffeine exposure. Scikit-learn (version 1.0.2) was utilized to perform PCA, and the explained variance ratio for each principal component was calculated. The first two principal components, which explained the most variance, were used for subsequent visualizations.
2.3. Differential expression analysis
Differential expression analysis was performed to identify the significantly regulated biomolecules at each caffeine concentration compared to a control group (0 ). Firstly, differentially expressed genes were identified from gene count data with the DESeq2 R package (version 1.39.8) (Love et al. Citation2014). The identification of differentially expressed proteins and phosphosites was implemented with the limma R package (version 3.56.1) (Ritchie et al. Citation2015). Biomolecules with a p-value less than or equal to 0.05 and an average fold-change greater than 2 were considered significantly differentially expressed.
2.4. Multi-Omics Factor Analysis
Multi-Omics Factor Analysis (MOFA), a framework for unsupervised integration of multi-omics datasets, aims to implement the generalization of PCA and infer a low-dimensional representation of data using latent factors that capture the biological and technical sources of variability (Argelaguet et al. Citation2018). MOFA can decompose input matrices as
(1)
(1)
where
denotes the matrix of observations for the mth modality in the gth group, Zg denotes the factor matrix for the gth group, Wm denotes the weight matrices for the mth modality, and
denotes the residual noise term for mth modality and the gth group.
MOFA (MOFA2 R package, version 1.9.2) was employed to analyze transcriptomic, proteomic, and phosphoproteomic data in this study to investigate the source of variation across molecular layers in the datasets (). Two-way ANOVA was applied to identify differentially expressed biomolecules with the variance of concentration or time. The ANOVA test was modeled as follows:
(2)
(2)
Subsequently, the average of three replicates at each concentration at each time point was calculated, and then the average values were standard scaled. MOFA package (MOFA2 v1.9.2) was used to analyze the DE biomolecules dataset and the number of factors was set to 7. The proteins, phosphosites, and genes that are highly relative to each factor were retrieved.
2.5. Pathway analysis
Pathway analysis facilitates a systematic understanding of cellular response in relation to AOPs. The Reactome gene set analysis system (ReactomeGSA) provides an effective comparative pathway analysis across multi-omics datasets (Griss et al. Citation2020) and it supports transcriptomic, proteomic, and micro-array data as input. Among the multiple analysis methods that ReactomeGSA employs, Pathway Analysis with Down-weighting of Overlapping genes (PADOG) (Tarca et al. Citation2012), Camera (Ritchie et al. Citation2015), and ssGSEA (Barbie et al. Citation2009) for pathway analysis, the PADOG method, a weighted gene set analysis method, was deployed on proteins and genes corresponding to each factor collected in the MOFA. According to the characteristic that the relative change degree of the factor value represents the relative change degree of the inferred variable, we use the two groups with the largest difference in the factor value in each factor as the comparison group to enrich the pathway (see Supplementary materials for details). Default settings were applied except disease pathways were not considered in enrichment. The p-values of each pathway at each omics layer were collected and then combined with Fisher’s method. This was then corrected for multiple hypothesis testing correction using Benjamini–Hochberg (BH) method to control false discovery rate (Benjamini and Hochberg Citation1995). A pathway was designated as significantly regulated if it had a BH-adjusted p-value of less than 0.05.
2.6. Protein–protein interaction network
Proteins and their intricate networks are pivotal for structuring cellular function, thereby enhancing our understanding of biological phenomena as they enable the inference of molecular functions and allow the characterization of modularity in biological processes. The STRING database amasses and integrates publicly accessible protein-protein interaction data, and supports pathway-enrichment analysis through various frameworks such as Gene Ontology annotations, KEGG pathways, UniProt keywords, Reactome pathways, and more (Szklarczyk et al. Citation2019, Citation2021). Phosphoproteins corresponding to each factor were used as the input of STRING. Functional enrichments result in Gene Ontology (Biological Process and Molecular Function) and Reactome Pathways were retrieved. Factor 2 contains the most phosphoproteins (2922 in total). To further analyze phosphoproteins in factor 2, we employed the cluster network function in the STRING app (version 2.0.1) Doncheva et al. Citation2019 installed in the Cytoscape app (version 3.10.0) (Shannon et al. Citation2003) with the granularity parameter set to 2. This allowed for a detailed examination of the interactions and network structure of these phosphoproteins within Factor 2.
2.7. Kinase activity inference
Cell signaling plays a crucial role in the regulation of transcription and epigenetic processes, thus profoundly influencing cell fate decisions (Yang et al. Citation2015). The capability to quantify phosphosite data allows for the characterization of differential kinase activity. This, in turn, provides valuable insights into the complexities of cellular circuitry and the dynamism of signaling cascades. In this study, we utilized KSEA tool to infer kinase activity from phosphoproteomic data (Wiredja et al. Citation2017). The phosphosites corresponding to each factor were used as the input for KSEA. To calculate p-values and fold changes, we identified and used the two states with the greatest difference in factor value for each respective factor (see Supplementary materials for details). This approach facilitated the inference of kinase activity and provided an understanding of the functional implications of changes in phosphosite data.
3. Results
3.1. PCA
PCA was applied on each omics dataset at both time points. The variance ratio explained by each eigenvector was computed, and the top two eigenvectors with the highest explained variance ratio were retained for visualization. The PCA results revealed a clear dose-dependent and time-dependent separation of data ().
Figure 1. Multi-Omics Factor Analysis (MOFA) model overview. MOFA takes proteomic, phosphoproteomic and transcriptomic data matrices (Y1, Y2, Y3) as input and decomposes these matrices into factor matrices Z1, Z2, Z3 and weight matrices W1, W2, and W3 for each data input.The green dataset represents proteomic data. The blue dataset is indicative of phosphoproteomic data. The yellow dataset corresponds to transcriptomic data. Within the Y matrices, any white elements highlight the presence of missing values. As for the weight matrices, the variation in color intensity–from light to dark shades–symbolizes the range of weights corresponding to different numerical values. Similarly, in the factor matrices, the gradation of color represents varying weights associated with distinct numerical values.
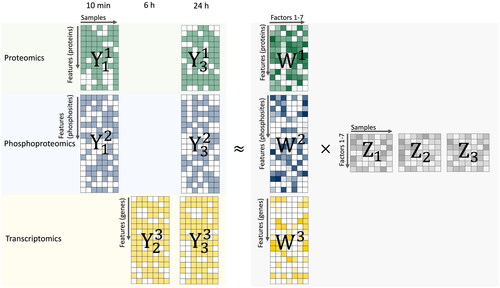
Figure 2. PCA of (a) transcriptome, (b) proteome, and (c) phosphoproteome; the number of differentially expressed (d) genes, (e) proteins, and (f) phosphosites.
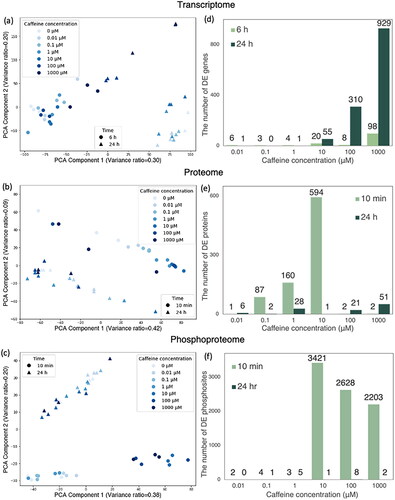
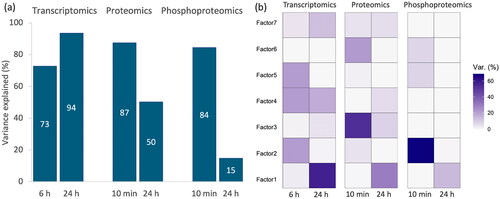
Figure 3. (a) Total variance explained for all factors across different time points and omics layer; (b) percentage of variance explained for each factor across different time points and omics layer. Factor 1 captures a strong source of variation from 24 h. Factor 2 primarily encapsulates variation evident in the phosphoproteomics at the 10-min mark and in transcriptomics at 6 h. Factor 3 represents distinct variance in proteome in response to a perturbation at 10 min. Factor 4 captures the variance specific to transcriptomic data. Factor 5 captures variation from transcriptomic data observed at 6 h. Factor 6 captures variation from 10 min. Factor 7 captures weak variation across transcriptomic and proteomic data.
3.2. Differential expression analysis
Differentially expressed proteins, phosphosites, and genes at each caffeine concentration compared to the control group were identified (see S1–3 for details). For transcriptomic data, the highest number of significantly changed genes was observed under 1000 caffeine concentration (). In proteomic data, the greatest number of significant changes was seen under 10
caffeine concentration at 10 min (). The phosphoproteomic data showed a large number of dysregulated phosphate sites at high caffeine concentrations (10–1000
) at 10 min, but not at any concentration at 24 h ().
3.3. Multi-Omics Factor Analysis
Three omics datasets comprising expression data for 16186 genes, 5819 proteins, and 15039 phosphosites were decomposed into seven factors. These factors explain 15–93% of the variance in the original datasets (), with six factors showing clear time and dose-dependent trends. A detailed examination of each factor revealed its unique relationships with different genes, proteins, and phosphosites and the specific variance they capture within the datasets (see S4–S6 for details).
Factor 1 is closely associated with 5929 genes, 454 proteins, and 776 phosphosites. This factor captures a strong source of variation from 24 h. An evaluation of the factor values indicates a relatively stable response at early time points, with a distinct uptick in response observed at 24 h, particularly at caffeine concentrations ranging from 10 to 1000 (). Factor 2 shows a robust correlation with 409 genes, 44 proteins, and 6745 phosphosites. This factor primarily encapsulates variation evident in the phosphoproteomics at the 10-minute mark and in transcriptomics at 6 h. A significant increase in response is observed at 10 min with concentrations between 10 and 1000
subsequently followed by a slight decrease (). At 6 and 24 h, the response remains relatively stable. Factor 3 exhibits a strong correlation with 231 genes, 1243 proteins, and 137 phosphosites. This factor represents a class of variance demonstrating a substantial response to perturbation at 10 min, peaking at a concentration of 10
No significant response is observed at 6 h, whereas at 24 h, the biomolecules exhibit a response, which gradually declines in magnitude with increasing concentrations ().
Figure 4. Factor value of Factor 1–6 at three time points and seven doses of caffeine (a–f). Factor values indicated the relative alteration level. Six factors exhibit clear time and dose-dependent trends.
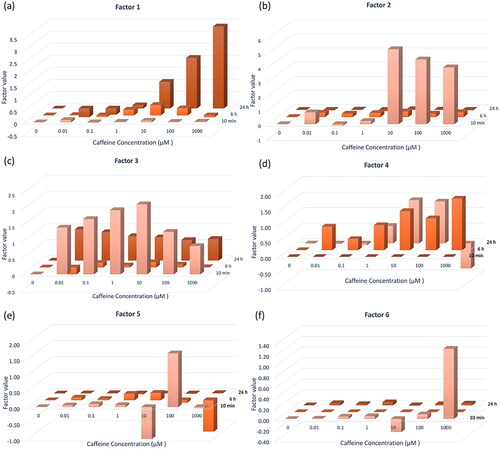
Factor 4 is significantly associated with 749 genes, 41 proteins, and 222 phosphosites. Primarily, this factor captures the variance in the transcriptomic data. At 10 min, there’s no discernible response across all concentrations. However, the degree of response gradually increases with increasing concentration at the 6-h mark (). At 24 h, the biomolecules’ response isn’t prominent at low concentrations, but it first escalates and then diminishes, peaking at a 10 concentration. Factor 5 corresponds to 10 genes, 5 proteins, and 476 phosphosites. The response is particularly noticeable at a concentration of 10
and 100
at 10 min and 1000
at 24 h (). These specific concentrations and time points induce distinct changes in biomolecular behavior. Factor 6 relates to 485 genes, 260 proteins, and 462 phosphosites. Interestingly, the factor value reveals a marked increase in response at 10 min under a concentration of 1000
The data also shows that at 6 h and 24 h, these biomolecules exhibit only weak responses across all concentrations ().
3.4. Pathway analysis
The ReactomeGSA pathway analysis was performed using the proteins and genes corresponding to each factor (see S7 for details). Factor 1 is linked with 1696 pathways, 198 of which exhibit significant expression. It plays a key role in regulating various metabolic processes (), particularly nucleotide, nitric oxide, inositol phosphate, peptide hormone metabolism, and protein folding. Notable differential regulation is seen in Signaling by GPCR, the neuronal system, Cilium Assembly, and Aquaporin-mediated transport. Factor 2 has 992 pathways identified by ReactomeGSA, with 34 pathways displaying differential regulation. Factor 2 is related to signaling by nuclear receptors, neuronal system including protein–protein interactions at synapses and metabolism including The citric acid (TCA) cycle and respiratory electron transport ()
Figure 5. Part of enriched Reactome pathways result. While the outer ring showcases all significant second-level pathways (p-values < 0.05), the inner ring displays the parent pathways. Color intensity in the rings indicates the p-value. (a) Factor 1 regulates several metabolism pathways, neuronal systems etc.; (b) Factor 2 regulates signaling by nuclear receptors, protein–protein interactions at synapses and the citric acid (TCA) cycle and respiratory electron transport, etc.; (c) Factor 3 regulates DNA replication, cell cycle, cellular response to stimuli, autophagy, signal transduction, etc; (d) Factor 4 is related to transport of small molecules, Organelle biogenesis and maintenance and Sensory Perception etc.; (e) Factor 6 relates to cell cycle, programmed cell death, etc.
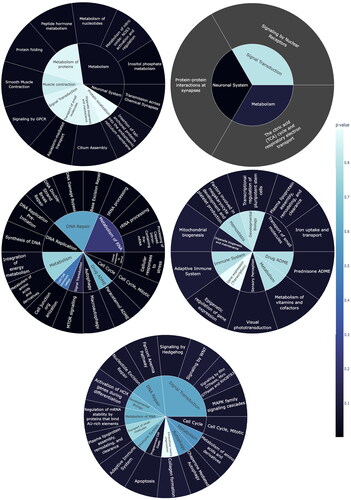
ReactomeGSA identified 1270 pathways in Factor 3, with 144 pathways showing substantial regulation. These include numerous metabolism pathways, such as integration of energy metabolism, metabolism of amino acids and derivatives. Factor 3 is associated with several signal transduction pathways including MTRO signaling. Almost all phases of cell cycle were regulated. DNA repair and replication and processing of tRNA, rRNA, capped intronless pre-mRNA also showed differential expression ().
ReactomeGSA identified 1117 pathways in Factor 4, of which 76 showed substantial regulation. Key regulated pathways involve the metabolism of vitamins and cofactors (). Factor 4 also significantly relates to the transport of small molecules, particularly plasma lipoprotein assembly, remodeling, and clearance, along with iron uptake and transport. Factor 4 also participates in Organelle biogenesis and maintenance including mitochondrial biogenesis and sensory perception including visual phototransduction. Due to the scarcity of the number of proteins and genes related to factor 5, ReactomeGSA did not find a significant pathway.
Factor 6 encompasses 1006 recognized pathways, with 147 exhibiting significant regulation. Factor 6 is linked to several signal transduction pathways, including Hedgehog, WNT, Signaling by Rho GTPases, Miro GTPases and RHOBTB3 and MAPK family signaling cascades (). This factor also regulates cell cycle, apoptosis, metabolism of RNA, and DNA Repair.
3.5. Protein–protein interaction
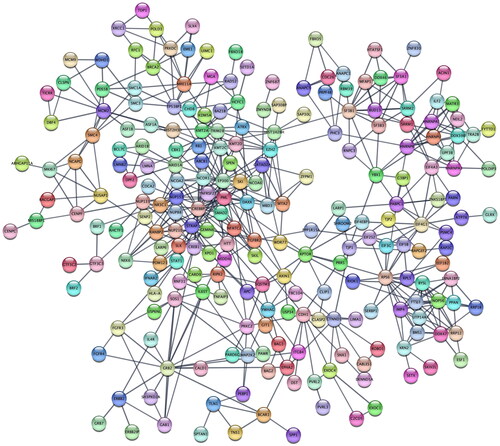
PPI network analysis identified biological processes, molecular functions, and Reactome pathways from proteins and phosphoproteins strongly correlated with each factor (see S8 for details). Factor 1 correlates with 776 phosphosites, which were collapsed to 615 phosphoproteins (). From these, STRING identifies 239 biological processes, 52 molecular functions, and 82 significant Reactome pathways. Unique biological processes reveal that Factor 1 is associated with Histone methylation and signal transduction processes contributing to a DNA damage checkpoint. RNA polymerase II activating transcription factor binding stands out as a distinct molecular function. Reactome pathways connect Factor 1 to the M phase in the cell cycle, transcriptional regulation by RUNX1, and signaling by the TGF-BETA receptor complex.
Figure 6. Protein–protein interaction network reconstructed from phosphoproteins that are highly related to factor 1.
Factor 2 correlates with 6745 phosphosites, condensed into 2921 phosphoproteins. These were subsequently grouped into more than 11 clusters containing over 20 nodes each (see S9 for details). Functional enrichment analysis of these clusters elucidates the roles of Factor 2. Biological processes cover translational initiation, cell division, cell surface receptor signaling pathways, rRNA modification, etc. Key molecular functions of Factor 2 include structural constituent of ribosome, microtubule binding, protein kinase binding, rRNA methyltransferase activity, and RNA helicase activity. Reactome enrichment analysis highlights Factor 2’s involvement in eukaryotic translation initiation, mitotic prometaphase, axon guidance, rRNA processing, and histone deacetylation by HDACs.
Factor 3 correlates with 137 phosphosites, reduced to 127 phosphoproteins. From these, STRING identifies 27 biological processes, 14 molecular functions, and 4 significant Reactome pathways. Unique biological processes indicate Factor 3’s involvement in cellular detoxification, adherens junctions, and cell adhesion. Vinculin binding emerges as a distinct molecular function. Reactome pathways link factor 3 to mRNA splicing and RHO GTPase effectors. Factor 4 correlates with 222 phosphosites, which are reduced to 207 phosphoproteins. From these, STRING identifies 92 biological processes, 27 molecular functions, and 40 significant Reactome pathways. Unique biological processes point to Factor 4’s role in regulating the reactive oxygen species metabolic process. cAMP response element binding protein binding is recognized as a unique molecular function. Reactome pathways associate Factor 4 with membrane trafficking, RNA metabolism, and SUMOylation.
Factor 5 correlates with 476 phosphosites, reduced to 416 phosphoproteins. From these, STRING identifies 172 biological processes, 36 molecular functions, and 9 significant Reactome pathways. Unique biological processes reveal Factor 5’s involvement in the regulation of localization, transport, and autophagy of mitochondria, and the establishment of cell polarity. RNA polymerase II C-terminal domain binding is a distinct molecular function. Reactome pathways link Factor 5 to cellular response to stress and RNA polymerase II transcription. Factor 6 correlates with 462 phosphosites, reduced to 403 phosphoproteins. From these, STRING identifies 251 biological processes, 49 molecular functions, and 10 significant Reactome pathways. Unique biological processes suggest these phosphoproteins are related to anatomical structure development, regulation of protein deacetylation, regulation of the extrinsic apoptotic signaling pathway, and common-partner SMAD protein phosphorylation. Distinct molecular functions include protein N-terminus binding, retinoic acid receptor binding, and calcium-dependent protein kinase C activity. Reactome pathways associate Factor 6 with the M phase in the cell cycle and transcriptional regulation by TP53.
3.6. Kinase activity inference
Inferring kinase activity allows us to understand how cell signaling contributes to translation and epigenetic processes. Through the Kinase-substrate Enrichment analysis of the phosphosites data highly correlated with each factor, the potential kinases were identified (p-value < 0.05) (see S10 for details). Factor 1 is associated with two kinases: casein kinase 2 alpha 2 (CSNK2A2) and ribosomal protein S6 kinase B1 (RPS6KB1). CSNK2A2 is involved in several cellular processes including cell cycle control, apoptosis, and circadian rhythms. RPS6KB1 is known to respond to mTOR (mammalian target of rapamycin) signaling, promoting protein synthesis, cell growth, and cell proliferation. Factor 2 is linked to five kinases. 3-phosphoinositide dependent protein kinase 1 (PDPK1) participates in numerous processes, such as cell surface receptor signaling pathways, regulation of protein kinase activity, and signal transduction regulation. SRC proto-oncogene (SRC), a non-receptor tyrosine kinase, plays a role in the regulation of embryonic development and cell growth. Cyclin-dependent kinase 7 (CDK7) is recognized as a crucial regulator of cell cycle progression. CDC-like kinase 1 (CLK1) contributes to pre-mRNA processing, releasing them into the nucleoplasm. ABL proto-oncogene 2 (ABL2), a non-receptor tyrosine kinase, is involved in cytoskeletal rearrangements through its C-terminal F-actin- and microtubule-binding sequences.
Factor 3 correlates with three kinases: p21 (RAC1) activated kinase 1, 2, and 4 (PAK1, PAK2, PAK4). These kinases are critical effectors that link RhoGTPases to cytoskeleton reorganization and nuclear signaling, thereby regulating cell motility and morphology. Specifically, p21 (RAC1) activated kinase 2 may regulate apoptotic events in dying cells, while p21 (RAC1) activated kinase 4 plays a role in the reorganization of the actin cytoskeleton. Factor 4 is associated with a single kinase, dual specificity tyrosine phosphorylation regulated kinase 1 A (DYRK1A), which autophosphorylates on serine/threonine and tyrosine residues. It may have a significant role in a signaling pathway that regulates cell proliferation and may contribute to brain development. No kinases with significantly altered activity were identified from the factor 5-associated phosphosites. Factor 6 is associated with one kinase, cyclin-dependent kinase 5 (CDK5). This kinase functions in diverse processes such as synaptic plasticity and neuronal migration by phosphorylating proteins required for cytoskeletal organization, endocytosis, exocytosis, and apoptosis.
4. Discussion
The use of omics techniques in understanding toxicity mechanisms has seen a significant increase in recent studies, focusing primarily on temporal changes or dose-dependent responses (Zhang et al. Citation2018; Klann et al. Citation2020; Selevsek et al. Citation2020; Lee et al. Citation2021; Li et al. Citation2023). However, these studies have either centred on a single source of variation or analyzed states independently for each experimental condition, disregarding the variation between states. Our research introduces an innovative multi-omics data analysis that amalgamates statistical analysis, machine learning techniques, and bioinformatics tools. We utilized a publicly accessible dataset of cellular responses (transcriptome, proteome, and phosphoproteome) to caffeine to demonstrate that our analysis can discern temporal and dose-dependent variance patterns from heterogeneous data and reconstruct the underlying cellular response network, encompassing pathway analysis, PPI network, and kinase activity inference.
Initial PCA visualization unveiled trend patterns in three omics data sets, correlating with caffeine’s concentration and the passage of time. These patterns indicate distinct biological processes under different caffeine concentrations and at various time points. Subsequent differential expression analysis uncovered the proteomic response at 10 min time point. Given the central dogma of molecular biology—with the proteome being downstream of the transcriptome and protein translation and synthesis takes hours (Canzler et al. Citation2020), the observed short-term adaptations may be linked to post-translational modifications such as phosphorylation in very early cell signaling events and ubiquitination in cell cycle control. We also noticed that the number of biomolecules changed in the proteome and phosphoproteome did not always increase proportionally with concentration, suggesting complex cellular response regulatory mechanisms. Thereafter, multigroup MOFA identified the primary sources of variance across time and dose in the three omics datasets, revealing six factors with time and dose dependencies.
The results demonstrated that at the ten-minute time point, a variety of proteins underwent regulation in cells exposed to low concentrations of caffeine. Analysis of the ReactomeGSA pathway revealed regulation of several signal transduction pathways, including those controlled by Hedgehog, WNT, Rho GTPases, Miro GTPases, RHOBTB3, and the MAPK family, along with the adaptive immune system and cell cycle. PPI network and kinase activity analysis confirmed that PAK family regulated cell motility and morphology by connecting RhoGTPases to cytoskeleton reorganization and nuclear signaling. As the concentration increased to 10 signaling by IGF1R, insulin receptor, PDGF, and VEGF were regulated. Further PPI network and kinase activity analysis validated that cellular processes such as cell cycle eukaryotic translation, mitotic prometaphase, axon guidance, and rRNA processing experienced dysregulation. At the 6-hour point, the regulation degree of pathways such as metabolism of steroids, vitamins, and cofactors, aspects of membrane trafficking, RNA metabolism, and SUMOylation increased with concentration. At the 24-h time point, pathways regulated at low caffeine concentrations at the 10-minute point were also regulated across all concentrations. As the concentration increased, the extent to which pathways such as metabolic processes (particularly steroid, nucleotide, and inositol phosphate metabolism), signaling by GPCR, the neuronal system, and aquaporin-mediated transport increased. PPI network and kinase activity inference identified that cellular processes such as cell cycle control, apoptosis, circadian rhythms, protein synthesis, cell growth, and cell proliferation also underwent regulation.
This study’s novelty lies in two primary aspects. First, the decomposition of omics data variance over time and the intensity of chemical stimuli together provides a more profound understanding of complex cellular regulatory mechanisms by capturing molecular events’ sequence. This provides important mechanistic insights into toxicity and benefits the development of universal modeling of cellular response under different experimental conditions. Secondly, instead of analyzing each layer of omics data separately and combining the results at the end, we proposed an integrative analysis method to investigate transcriptomics, proteomics, and phosphoproteomics. Notably, we used site-centered phosphoproteomic data to retain site-specific phosphorylation behaviors involved in signaling events without collapsing multiple phosphosites into phosphoproteins or phosphopeptides (Mantini et al. Citation2021).
Although our analysis provides an important protocol for applying omics techniques to derive insight into toxicity mechanisms, it presents limitations. Bioinformatic tools yield extensive information from each factor, necessitating a robust knowledge reserve and substantial processing time to extract key data, indicating the need for an efficient bioinformatics results handling tool. An efficient tool that can handle bioinformatics results is needed. Furthermore, the application of caffeine data includes only three-time points, and only the transcriptome was recorded at 6 hr, which makes the dynamics kinetic results sparse. This may lead to the loss of some key information about the intermediate time points.
In summary, our integrative omics data analysis methods have the potential to investigate the complex changes underlying cellular chemical exposure responses. This provides a comprehensive analytical method applicable to future research exploring mechanisms of toxicity when more time- and dose-exploring omics data are available. Ultimately, this may promote the generation of models simulating the relationship between toxins and AOPs accurately.
Author contributions
Conceptualization, Y.L., G.L. and T.C.; data curation, Y.L.; formal analysis, Y.L.; supervision, G.L. and T.C.; visualization, Y.L.; writing—original draft, Y.L.; writing—review and editing, G.L. and T.C. All authors have read and agreed to the published version of the manuscript.
KSEA Kinase Scores
Download MS Excel (25 KB)PPI Factor
Download MS Excel (367.7 KB)STRING PPI Results
Download MS Excel (689.4 KB)Reactome pathway analysis results
Download MS Excel (189.2 KB)Phosphoproteomics Factor
Download MS Excel (138 KB)Proteomics Factor
Download MS Excel (38.6 KB)Transcriptomics Factor
Download MS Excel (106.2 KB)Differentially expressed proteins
Download MS Excel (28.3 KB)Differential expressed phosphosites
Download MS Excel (121.7 KB)Defferential expressed genes
Download MS Excel (34.5 KB)Supplemental Material
Download MS Word (16.5 KB)Acknowledgement(s)
Graphical Abstract was created with BioRender.com
Disclosure statement
The authors report there are no competing interests to declare.
Data availability statement
The authors confirm that the data supporting the findings of this study are available within the article and its supplementary materials. The data and code that support the findings of this study are available from the following GitHub repository https://github.com/Yufan98/multi-variate-multi-omics-data-analysis. Raw data are available from the Gene Expression Omnibus website (https://www.ncbi.nlm.nih.gov/geo/) with the accession numbers GSE200441 and GSE200700 and ProteomeXchange Consortium website (http://proteomecentral.proteomexchange.org) with the dataset identifier PXD030943, PXD030946, PXD031031, PXD031005.
Additional information
Funding
References
- Antczak P, Jo HJ, Woo S, Scanlan L, Poynton H, Loguinov A, Chan S, Falciani F, Vulpe C. 2013. Molecular toxicity identification evaluation (mtie) approach predicts chemical exposure in daphnia magna. Environ Sci Technol. 47(20):11747–11756. doi: 10.1021/es402819c.
- Argelaguet R, Arnol D, Bredikhin D, Deloro Y, Velten B, Marioni JC, Stegle O. 2020. Mofa+: a statistical framework for comprehensive integration of multi-modal single-cell data. Genome Biol. 21(1):111. doi: 10.1186/s13059-020-02015-1.
- Argelaguet R, Velten B, Arnol D, Dietrich S, Zenz T, Marioni JC, Buettner F, Huber W, Stegle O. 2018. Multi-omics factor analysis–a framework for unsupervised integration of multi-omics data sets. Mol Syst Biol. 14(6):e8124. doi: 10.15252/msb.20178124.
- Barbie DA, Tamayo P, Boehm JS, Kim SY, Moody SE, Dunn IF, Schinzel AC, Sandy P, Meylan E, Scholl C, et al. 2009. Systematic rna interference reveals that oncogenic kras-driven cancers require tbk1. Nature. 462(7269):108–112. doi: 10.1038/nature08460.
- Benjamini Y, Hochberg Y. 1995. Controlling the false discovery rate: a practical and powerful approach to multiple testing. J Roy Statis Soc Series B (Methodological). 57(1):289–300.
- Buesen R, Chorley BN, da Silva Lima B, Daston G, Deferme L, Ebbels T, Gant TW, Goetz A, Greally J, Gribaldo L, et al. 2017. Applying’omics technologies in chemicals risk assessment: report of an ecetoc workshop. Regul Toxicol Pharmacol. 91 Suppl 1(Suppl 1):S3–S13. doi: 10.1016/j.yrtph.2017.09.002.
- Canzler S, Schor J, Busch W, Schubert K, Rolle-Kampczyk UE, Seitz H, Kamp H, von Bergen M, Buesen R, Hackermüller J. 2020. Prospects and challenges of multi-omics data integration in toxicology. Arch Toxicol. 94(2):371–388. doi: 10.1007/s00204-020-02656-y.
- Doncheva NT, Morris JH, Gorodkin J, Jensen LJ. 2019. Cytoscape stringapp: network analysis and visualization of proteomics data. J Proteome Res. 18(2):623–632. doi: 10.1021/acs.jproteome.8b00702.
- Griss J, Viteri G, Sidiropoulos K, Nguyen V, Fabregat A, Hermjakob H. 2020. Reactomegsa-efficient multi-omics comparative pathway analysis. Mol Cell Proteomics. 19(12):2115–2125. doi: 10.1074/mcp.TIR120.002155.
- Klann K, Tascher G, Münch C. 2020. Functional translatome proteomics reveal converging and dose-dependent regulation by mtorc1 and eif2α. Mol Cell. 77(4):913–925.e4. doi: 10.1016/j.molcel.2019.11.010.
- Lee H, Sung EJ, Seo S, Min EK, Lee JY, Shim I, Kim P, Kim TY, Lee S, Kim KT. 2021. Integrated multi-omics analysis reveals the underlying molecular mechanism for developmental neurotoxicity of perfluorooctanesulfonic acid in zebrafish. Environ Int. 157:106802. doi: 10.1016/j.envint.2021.106802.
- Li Y, Zhang Z, Jiang S, Xu F, Tulum L, Li K, Liu S, Li S, Chang L, Liddell M, et al. 2023. Using transcriptomics, proteomics and phosphoproteomics as new approach methodology (nam) to define biological responses for chemical safety assessment. Chemosphere. 313:137359. doi: 10.1016/j.chemosphere.2022.137359.
- Love MI, Huber W, Anders S. 2014. Moderated estimation of fold change and dispersion for rna-seq data with deseq2. Genome Biol. 15(12):550. doi: 10.1186/s13059-014-0550-8.
- Mantini G, Pham TV, Piersma SR, Jimenez CR. 2021. Computational analysis of phosphoproteomics data in multi-omics cancer studies. Proteomics. 21(3–4):e1900312.doi: 10.1002/pmic.201900312.
- Ritchie ME, Phipson B, Wu D, Hu Y, Law CW, Shi W, Smyth GK. 2015. limma powers differential expression analyses for rna-sequencing and microarray studies. Nucleic Acids Res. 43(7):e47–e47–e47. doi: 10.1093/nar/gkv007.
- Selevsek N, Caiment F, Nudischer R, Gmuender H, Agarkova I, Atkinson FL, Bachmann I, Baier V, Barel G, Bauer C, et al. 2020. Network integration and modelling of dynamic drug responses at multi-omics levels. Commun Biol. 3(1):573. doi: 10.1038/s42003-020-01302-8.
- Shannon P, Markiel A, Ozier O, Baliga NS, Wang JT, Ramage D, Amin N, Schwikowski B, Ideker T. 2003. Cytoscape: a software environment for integrated models of biomolecular interaction networks. Genome Res. 13(11):2498–2504. doi: 10.1101/gr.1239303.
- Szklarczyk D, Gable AL, Lyon D, Junge A, Wyder S, Huerta-Cepas J, Simonovic M, Doncheva NT, Morris JH, Bork P, et al. 2019. String v11: protein–protein association networks with increased coverage, supporting functional discovery in genome-wide experimental datasets. Nucleic Acids Res. 47(D1):D607–D613. doi: 10.1093/nar/gky1131.
- Szklarczyk D, Gable AL, Nastou KC, Lyon D, Kirsch R, Pyysalo S, Doncheva NT, Legeay M, Fang T, Bork P, et al. 2021. The string database in 2021: customizable protein–protein networks, and functional characterization of user-uploaded gene/measurement sets. Nucleic Acids Res. 49(D1):D605–D612. doi: 10.1093/nar/gkaa1074.
- Tarca AL, Draghici S, Bhatti G, Romero R. 2012. Down-weighting overlapping genes improves gene set analysis. BMC Bioinformatics. 13(1):136. doi: 10.1186/1471-2105-13-136.
- Tice RR, Austin CP, Kavlock RJ, Bucher JR. 2013. Improving the human hazard characterization of chemicals: a tox21 update. Environ Health Perspect. 121(7):756–765. doi: 10.1289/ehp.1205784.
- Titz B, Elamin A, Martin F, Schneider T, Dijon S, Ivanov NV, Hoeng J, Peitsch MC. 2014. Proteomics for systems toxicology. Comput Struct Biotechnol J. 11(18):73–90. doi: 10.1016/j.csbj.2014.08.004.
- von Stechow L, Francavilla C, Olsen JV. 2015. Recent findings and technological advances in phosphoproteomics for cells and tissues. Expert Rev Proteomics. 12(5):469–487. doi: 10.1586/14789450.2015.1078730.
- Wang D. 2018. Infer the in vivo point of departure with toxcast in vitro assay data using a robust learning approach. Arch Toxicol. 92(9):2913–2922. doi: 10.1007/s00204-018-2260-6.
- Wiredja DD, Koyutürk M, Chance MR. 2017. The ksea app: a web-based tool for kinase activity inference from quantitative phosphoproteomics. Bioinformatics. 33(21):3489–3491. doi: 10.1093/bioinformatics/btx415.
- Yang P, Zheng X, Jayaswal V, Hu G, Yang JYH, Jothi R. 2015. Knowledge-based analysis for detecting key signaling events from time-series phosphoproteomics data. PLoS Comput Biol. 11(8):e1004403. doi: 10.1371/journal.pcbi.1004403.
- Zhang X, Xia P, Wang P, Yang J, Baird DJ. 2018. Omics advances in ecotoxicology. Environ Sci Technol. 52(7):3842–3851. doi: 10.1021/acs.est.7b06494.