
Abstract
Arginine auxotrophy constitutes a weak point of several tumors, among them glioblastoma multiforme (GBM). Hence, those tumors are supposed to be sensitive for arginine-depleting substances, such as arginine deiminase (ADI). Here we elucidated the sensitivity of patient-individual GBM cell lines toward Streptococcus pyogenes-derived ADI. To improve therapy, ADI was combined with currently established and pre-clinical cytostatic drugs. Additionally, effectiveness of local ADI therapy was determined in xenopatients. Half of the GBM cell lines tested responded well toward ADI monotherapy. In those cell lines, viability decreased significantly (up to 50 %). Responding cell lines were subjected to combination therapy experiments to test if any additive or even synergistic effects may be achieved. Such promising results were obtained in 2/3 cases. In cell lines HROG02, HROG05 and HROG10, ADI and Palomid 529 combinations were most effective yielding more than 70 % killing after 2 rounds of treatment. Comparable boosted antitumoral effects were observed after adding chloroquine to ADI (>60% killing). Apoptosis, as well as cell cycle dysregulation were found to play a minor role. In some, but clearly not all cases, (epi-) genetic silencing of arginine synthesis pathway genes (argininosuccinate synthetase 1 and argininosuccinate lyase) explained obtained results. In vivo, ADI as well as the combination of ADI and SAHA efficiently controlled HROG05 xenograft growth, whereas adding Palomid 529 to ADI did not further increase the strong antitumoral effect of ADI. The cumulative in vitro and in vivo results proved ADI as a very promising candidate therapeutic, especially for development of adjuvant GBM combination treatments.
Abbreviations
| Arg | = | L-Arginine |
| ADI | = | arginine deiminase |
| GBM | = | Glioblastoma multiforme, ASS1, argininosuccinate synthetase 1 |
| ASL | = | argininosuccinate lyase |
| SAHA | = | suberoylanilide hydroxamic acid |
Introduction
The hallmarks of cancer have been formulated by functional molecular and biological traits that distinguish neoplastic from normal cells and dysregulation of cellular metabolism was found to be one of the critical steps in cancer development and progression.Citation1 Based on these findings, targeting metabolic pathways has become increasingly recognized in experimental oncological research.
Certain tumors exhibit disturbed arginine (Arg) synthesis and metabolism. L-Arg is a semi-essential amino acid that, under physiological conditions, is primarily synthesized in kidneys, liver, and epithelial cells of the small intestine.Citation2 In normal cells, Arg depletion results in G1 cell cycle arrest, which is abrogated after subsequent administration of exogenous arginine.Citation3 By contrast, tumor cells lacking Arg synthesis do not have the capacity to regrow and proliferate again. Hence, this auxotrophy may be their Achilles' heel.Citation3 Arg auxotrophy results from genetic or epigenetic (mostly by methylation) inactivation of the argininosuccinate synthetase 1 (ASS1) geneCitation4 and it is primarily found in tumors associated with chemoresistance and a poor clinical outcome–such as melanoma, hepatocellular carcinoma, and pancreatic cancer.Citation5 In the only prior study, glioblastoma multiforme (GBM), a deadly primary brain malignancy, has been identified as another target for Arg-depleting therapeutic strategies.Citation6 Despite aggressive (combinatorial) treatment strategies, GBM patients’ outcome has improved by only a few months over the past 50 years, emphasizing the need for novel treatment options.Citation7,8 A promising agent is arginine deiminase (ADI), an enzyme that hydrolyzes L-Arg to L-citrulline and ammonia. Being isolated from Mycoplasma hominis or M. arginini, ADI is by nature highly antigenic. Hence, a stabilized pegylated form of Mycoplasma-derived ADI (=ADI-PEG20) was developed and applied in numerous preclinical and clinical phase I/II trials, which are ongoing or have just been completed.Citation3 However, results obtained so far are contradictory, often describing development of resistance due to ASS1 re-expression or activation of apoptosis-resistance mechanisms.Citation3,9,10 The application of arginine-depleting enzymes in combination with other chemotherapeutics might increase the antitumoral effects of ADI and needs to be investigated in more detail.Citation3
We here evaluated the oncolytic potential of Streptococcus pyogenes-derived ADI for treatment of patient-derived GBM cell lines, since the enzyme is well adapted to conditions in the human body and might represent an alternative (or combinatorial partner) for Mycoplasma-derived ADI.Citation11 S. pyogenes-derived ADI was applied as single agent and in combination with antineoplastic drugs both in vitro and in a xenograft mouse model in vivo. Results obtained provide a clear rationale for further optimizing ADI-tailored multidrug therapies.
Results
Cell line specific response to ADI
As a first attempt, responsiveness toward ADI was analyzed on a panel of 12 patient-derived GBM cell lines (). Responsiveness was determined at a level of at least 20% biomass reduction compared to untreated cells.
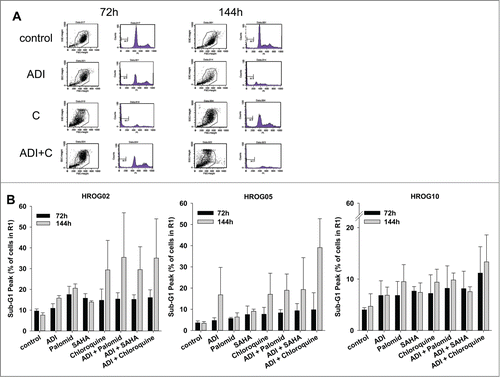
Figure 1. (A) Crystal violet staining of ADI treated and control cells. Quantitative analysis of crystal violet stained adherent cells upon 72 h of incubation with increasing ADI concentrations. Quantification was done by measurement on a microplate reader at 570 nm (reference wavelength: 620 nm). Untreated cells were set as 100%. Results show data of 3 separate experiments. Values are given as the mean % of adherent cells ± SD. (B, C) Proliferation upon ADI exposure. CMFDA labeled cells were treated with ADI for a total of 6 days. Flow cytometric proliferation analysis was done every day of treatment. **P < 0.01 vs. control; *P < 0.05 vs. control; t-test. (B) Quantitative analysis of mean fluorescence intensity of CMFDA-labeled HROG05 cells. *ADI day 1,**ADI days 2 and 3. (C) Representative histograms showing reduced fluorescence in control cells compared to ADI-exposed cells. **P < 0.01 vs. control; *P < 0.05 vs. control; t-test.
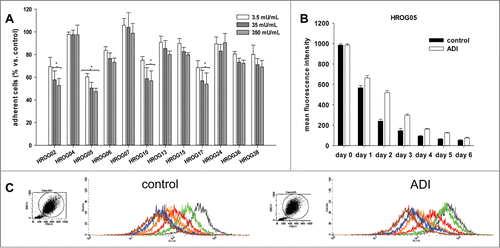
Treatment with increasing ADI concentrations for 72 h revealed cell line specific responses with 7 cell lines being susceptible toward this enzyme, while the remaining 5 lines exhibited intrinsic ADI resistance. Significant effects were observed in HROG02, HROG05, HROG10, and HROG17 cells with up to 50% cytotoxicity as determined by crystal violet staining of remaining cells (). Of note, effects were rather independent from ADI dose and hence, all subsequent experiments were done with 35 mU/ml.
Inhibited proliferation of remaining viable GBM cells
A flow cytometry based proliferation assay was applied to verify the antiproliferative capacity of ADI. Therefore, MFI of CMFDA-labeled HROG02 and HROG05 cells was measured upon ADI exposure and compared to controls.
ADI led to reduced cell proliferation, which was most recognizable on the first 3 treatment days. Here, MFI of ADI-exposed HROG05 cells was about 1.5-fold higher than their control counterparts, being indicative for a reduced growth rate (). Though MFI values converged with incubation time, they even remained higher in the ADI group until the end of experiments (6 days). This growth inhibition was equally seen for HROG02 and HROG05 cells and confirms the potential of ADI to affect GBM cell proliferation ( and data not shown).
ASS1 and ASL expression and methylation profile of primary GBM cell lines
On a molecular level, susceptibility toward ADI is supposed to be dependent on (epi-) genetic silencing of certain cellular enzymes. Quite in line, ASS1 mRNA was absent or low in 9/12 cell lines. By contrast, expression of ASL mRNA was only found to be reduced in half of the examined cases (). Expression levels of these 2 enzymes mostly matched with ADI response, but in some cases, an inverse correlation was found (e.g., HROG10 and HROG24) ().
Figure 2. Expression levels and methylation profile of ASS1 and ASL in a panel of GBM cell lines. (A) Quantitative SYBR Green-1-based PCR to detect ASS1 and ASL expression in GBM cell lines. Expression was normalized to a housekeeping gene (GAPDH). Expression levels are given as 2^-dCt. (B) MSP of ASS1 and ASL as described in material and methods. Methylation profile of these 2 genes in GBM cell lines was assessed by using one primer set for ASL (Set 1) and 2 different primer sets for ASS1 (Set 2 and Set 4), representing distinct CpG islands. For ASS1, results for Set 2 are shown. (C) Quantitative MSP of CpG islands within ASS1 and ASL, respectively. Results show the methylation level of GBM cell lines with high sensitivity toward ADI. SSS1-treated leukocytes were set as 100 % and all other data were given as % vs. SSS1. Values are given as the relative expression ± SD from 3 independent replicates.
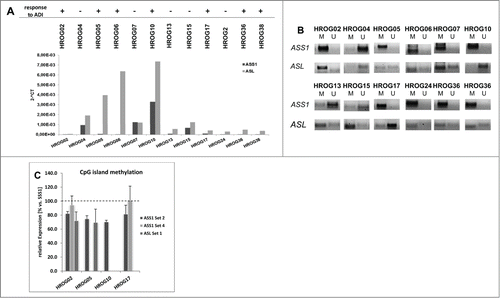
Additional to transcriptional silencing, both genes were found to be frequent targets for CpG island methylation and this methylation is a critical predictor for sensitivity of ADI-tailored therapies [6]. ASS1 CpG island methylation was present in 8/12 cell lines (). In all but one case (HROG07), reduced expression of ASS1 could be attributed to epigenetic silencing. A comparable pattern was seen for ASL, here again, lower mRNA expression was mostly due to methylation. But in 2 cases, an inverse correlation was found. ASL mRNA was nearly absent in HROG17, but without CpG island methylation (). Vice versa, HROG06 cells expressed nearly normal ASL mRNA levels, but simultaneously showed CpG island methylation. This may be best explained by only partial methylation of the analyzed CpG island, thereby preventing genetic silencing. However, since this cell line showed only borderline sensitivity toward S. pyogenes-derived ADI this hypothesis was not further pursued in detail.
In a subsequent experiment, cells with highest susceptibility toward ADI were subjected to quantitative MSP to examine the level of methylation within single CpG islands. These experiments revealed differences within CpG islands of ASS1, with nearly complete methylation of one (Set 2, 80% vs. SSS1-treated gDNA), but absence in another (Set 4) (). Likewise, high CpG island methylation of ASL was found in 2/4 analyzed cases (HROG02: 72% and HROG05: 69% vs. SSS1-treated gDNA, respectively).
Boosted antitumoral effects in combination treatments
ADI was then combined with selected drugs to test if the addition of chemotherapeutics may enhance oncolytic effects. For combination studies, drugs were applied in low doses (<50% killing, as determined in preliminary studies, data not shown). Treatment schedules included single (72 h) and repeated (144 h) drug exposure, thus mimicking the in vivo situation of multiple dose settings.
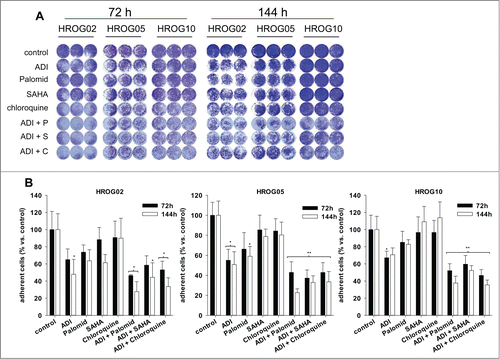
Firstly, the alkylating agent TMZ, the current gold standard for GBM therapy, was added to ADI. However, this combination did not enhance the antitumoral effect of ADI in tested cell lines here (data not shown). Consequently, TMZ was not considered for subsequent analyses. By contrast, the combination with Palomid 529, SAHA or chloroquine boosted antitumoral effects. In cell lines HROG05 and HROG10, ADI and Palomid 529 combinations were most effective, yielding nearly 80 % killing after 2 rounds of treatment (). Comparable effects were observed after adding chloroquine to ADI (up to 60% cell number reduction). The ADI and SAHA combination had less strong–though still remarkable–impact on all cell lines. The best combination for HROG02 was ADI and Palomid 529. Here, 50% (72 h) and 70% (144 h) less adherent cells were detected (). Adding cloroquine to ADI yielded a comparable pattern with more than 60% reduction of cell numbers after 2 cycles ().
Figure 3. Crystal violet staining of GBM cell lines treated with ADI, cytostatic drugs or a combination of both. (A) Macroscopic examination of oncolytic activity. (b) Quantitative analysis of adherent cells upon 72 h and 144 h of incubation with ADI and drug (combinations). Untreated cells were set as 100% and all other data were given as % vs. control. Values are given as the mean % of adherent cells ± SD of 3 separate experiments. **P < 0.01 vs. control; *P < 0.05 vs. control; U-test.
Antitumoral effects of ADI are independent from apoptosis
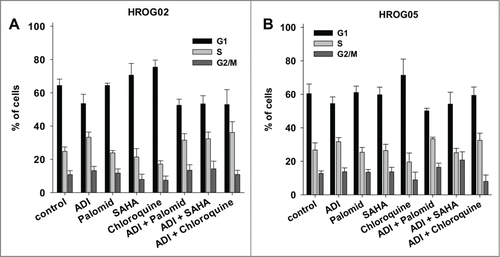
When analyzing cell cycle distribution upon 72 h of ADI exposure, slight increases in S-phases were observed in 2 out of 3 lines (HROG02 and HROG05), however, this did not reach statistical significance (). Adding Palomid 529 to ADI reinforced this effect in HROG05 cells after 2 treatment rounds (data not shown). On the contrary, the other drugs had no influence on cell cycle distribution ().
Figure 4. Cell cycle analysis of (A) HROG02 and (B) HROG05 cells. Cells were treated with ADI, selected drugs or combinations thereof for a total of 72 h. Read out was done by flow cytometry. Values are given as the mean % of cells ± SD of 3 separate experiments.
Afterwards, the kind of cell death was analyzed more deeply taking advantage of the Sub-G1 Peak analysis. In cell line HROG05, numbers of apoptotic cells raised to 20 % after 144 h of ADI exposure. Adding chloroquine to cell culture boosted proapoptotic effects (apoptotic cells: 39.1 ± 13.6 % vs. control: 3.4 ± 0.9 %). The other combinations had no influence on cell death with values comparable to ADI monotherapy (). In HROG02 cells, Sub-G1-DNA content raised upon combinational therapy but only after repetitive treatment. HROG10 cells were relatively resistant toward ADI-induced apoptosis, with Sub-G1 DNA levels below 15 % (). This was irrespective of the used setting. In additional experiments, using an apoptosis/necrosis assay, comparable results were obtained (data not shown).
Figure 5. Sub-G1 analysis of GBM cells. Cells were treated with ADI, selected drugs or combinations thereof for 72 h and 144 h, respectively. Read out was done by flow cytometry using single gating strategy. All cells in Gate 1 were measured (20,000 events in total). (A) Representative dot plots of HROG05 treated cells. (B) Quantitative analysis of cells with Sub-G1 Peak. Values are given as the mean% of cells ± SD of 3 separate experiments.
Significant xenograft growth inhibition after repetitive application
Finally, a subcutaneous tumor model was used to study the effect of ADI on xenograft growth. HROG05 tumors were employed in ultra-low passage (i.e. regrafting after initial implantation of the patient tumor). Following tumor establishment, local therapy was done by repetitive application of ADI, SAHA, Palomid 529 or a combination of ADI and the targeted inhibitors.
All treatments were well tolerated by mice and accordingly, mice did not develop any side effects. Moreover, ADI application significantly affected tumor growth. At day 10 post therapy start, tumors were strikingly smaller than their control counterparts (1.6-fold increase vs. control 4.1-fold increase). Though HROG05 growth was not completely impeded by ADI, tumor progression remained at very low level, even until the end of experiments. Tumor sizes at resection were about 70% smaller than controls (). Adding SAHA to ADI further increased the strong oncolytic effect. Two out of 5 xenografts even macroscopically necrotized upon therapy and one tumor completely regressed. The growth inhibiting effect was evident from start of treatment until the experimental endpoint. Single SAHA treatment also affected HROG05 xenograft growth, but with less strong potential. Therefore, the combination proved best in this in vivo trial.
Figure 6. HROG05 histology and xenograft growth. Therapy was performed by repetitive local application of ADI (250 U/kg bw), Palomid (1 mg/kg bw), SAHA (25 mg/kg bw) and a combination of either Palomid 529 + ADI (=combination 1) or SAHA + ADI (=combination 2). Each therapy was given twice a week (a total of 6 injections) (n=5 mice per group). Tumor-carrying control animals received equivalent volumes of PBS/DMSO (n = 5 per group). (A) Representative HE staining of HROG05 xenografts. Pictures of 4 μm slides were taken at low and high resolution, respectively. (B) Tumor growth curve. Tumor volumes are given as x-fold increase vs. day 0 (Vt/V0) (start of treatment) ± SD. *P < 0.05 vs. control; **P < 0.01 vs. control.
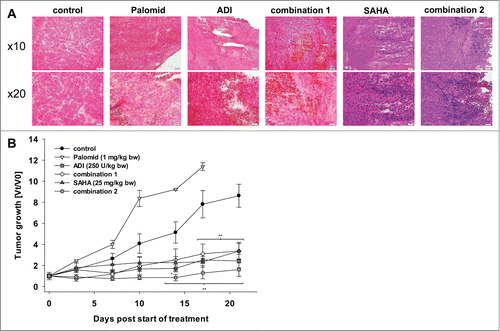
By contrast, Palomid 529 accelerated tumor growth and hence the experiment had to be stopped at day 17 due to excessive tumor burden (11.4-fold increase vs. control 7.8-fold increase). This effect was completely unforeseen. Given the fact that Palomid 529 controlled cell growth in vitro even at low concentration (7.5 μM), at least partial growth inhibition in vivo could have been expected. Quite in line, the combination of ADI and Palomid 529 was not able to boost the strong oncolytic effect of ADI monotherapy in this xenograft model. As can be depicted from , the tumor growth curve was comparable to that of ADI. Additional histological examination of resected xenograft specimens identified large necrotic areas primarily found in ADI-treated tumors (), while cellular apoptosis was not altered upon therapy. This was irrespective of the treatment regimen (M30 Cytodeath staining for detection of caspase-cleaved Cytokeratin 18, data not shown).
Discussion
Amino acid starvation results in effective killing of certain tumor cells. This observation has guided the way for a novel treatment strategy based on ADI, an Arg-degrading bacterial enzyme. Though recent years have seen much efforts in transferring this approach into the clinic, development of resistance mechanisms has so far hampered successful long-term application of Mycoplasma-derived ADI-PEG20.Citation2,10 In this study, ADI of S. pyogenes was applied as therapeutic agent for treating GBM. S. pyogenes-derived ADI has its highest enyzmatic activity at 37°C and a pH optimum at a slightly acidic pH of 6.5 which may be advantageous in tumor microenvironments.Citation11
Half of the cell lines tested here showed responsiveness toward ADI (7/12). In line with the rapid mode of killing, apoptosis was found to play a minor role. This finding is underscored by the fact that GBM cells are intrinsically resistant toward pro-apoptotic signals.Citation17,18 In a recent publication from Syed and coworker, autophagy, the type II cell death, was identified as the main reason for ADI-PEG20-mediated killing of primary GBM cells, independent of caspase activation.Citation6 Though not studied in detail here, a comparable mode of action together with the observation of a good response toward autophagy-inducing therapies is very likely.Citation18 In most, but clearly not all cases, expression status of ASS1 correlated with responsiveness of tested cell lines. Of note, HROG10 cells expressed high ASS1 level, but were susceptible toward ADI-induced oncolysis, indicating that other mechanisms yet to be identified, account for ADI efficacy, as well. Usually, loss of ASS1 expression is the result of epigenetic silencing via methylation of CpG islands within the ASS1 promoter.Citation6 This mechanism was active in most cases studied here, as well. Epigenetic silencing of certain genes delivers an intrinsic biological advantage. Arg auxotrophy is clinically associated with an aggressive cancer type showing intrinsic chemoresistance.Citation2 Since this is also true for GBM, ADI therapy may offer a strategy for a subset of patients harboring tumors with disrupted Arg metabolism. For optimizing treatment regimens, ADI was combined with selected antineoplastic drugs. Rather unexpectedly, the addition of TMZ, the standard of care therapy for GBM, did not boost antitumoral effects of ADI. Hence, several contemporary and experimental drugs were additionally given to ADI. Drug selection based on the following criteria: (i) tumor selectivity (addressing different molecular targets), (ii) proven efficacy in preclinical studies, (iii) enhanced antitumoral effects when given in conjunction with other drugs, and (iv) safe application with minimal toxic side effects. Of note, adding either Palomid 529–a novel small-molecule TORC1/TORC2 inhibitor -, SAHA or chloroquine to ADI resulted in strong oncolysis with up to 70% tumor cell killing. SAHA acts by interfering with the activity of histone deacetylases, thereby targeting the aberrant epigenetic characteristics of tumor cells. Its broad applicability as an antitumor agent and radiosensitizer is well established.Citation19,20 Here, synergistic effects were found in one out of 3 cases (HROG05). This cell line harbored mutated Pten and Kras and was generated from a relapsed GBM patient, thereby representing a very aggressive subtype. P53, which is mutated in only one cell line (HROG02) does not seem to be involved in this process. This is consistent with the literature, showing that inhibited tumor cell proliferation by SAHA is p53-independent.Citation20,21Irrespective of the underlying molecular alterations, SAHA in conjunction with ADI proved to be very effective in our in vivo trial using HROG05 xenografts, without possessing any toxic side effects. Tumor growth was substantially impaired upon therapy and this strong antitumoral effect could be maintained until the experimental endpoint (day 21). Hence, no resistance mechanisms –as had been described for other ADIsCitation10 – developed. Even more important from a clinical point of view, the combination of SAHA and ADI was more effective in controlling tumor growth in vivo than in vitro, indicating that other mechanisms –yet to be identified– were responsible for this strong additive antitumoral effect. Single ADI or SAHA treatment also affected HROG05 xenograft growth, still, the combination proved best here. Subsequent studies on a larger cohort or/and a more clinically relevant orthotopic tumor model will show whether this combination provides a real opportunity for selected GBM patients.
Similarly, chloroquine, traditionally used as an antimalarial medication, is a strong lysosomotropic and DNA-intercalating agent that wakens interest for cancer therapy.Citation22 This substance effectively eliminates chemotherapy-resistant cancer cells. Of note, in a small clinical trial, chloroquine in conjunction with chemotherapy significantly prolonged median survival time of GBM patients.Citation23 In our study, additive effects were found in all tested cell lines. Mechanistically, chloroquine affects the cellular redox state of cells by depleting glutathione.Citation22,23 As an autophagy-inhibitor, chloroquine accelerates ADI-induced cell death. This substance acts late in autophagy, resulting in the accumulation of lipidated LC3-11 (the converted product of LC3-1).Citation6 These findings, together with the recent literatureCitation6, imply that chloroquine or its derivatives mefloquine and quinacrine, represent hopeful candidates for GBM therapies. Quite in line, Palomid 529, a dual TORC1/2 inhibitor was only recently identified as another auspicious agent for GBM and other intracranial malignancies.Citation24
In most GBM cases (>80 %), the PI3K/Akt/mTOR pathway is constitutively activated as a result of multiple gene mutations.Citation24 Consequently, targeting this pathway seems reasonable. Palomid and ADI proved to be very effective, yielding synergistic effects. Autophagy seems to be involved in the antitumoral action, yet, the detailed molecular mechanism is not understood. In preceding in vivo studies reduced angiogenesis, vascular permeability, and tumor growth upon Palomid 529 treatment was reported.Citation25 We observed none of these tumor growth inhibiting effects. Therapeutically applied Palomid 529 accelerated HROG05 xenograft growth. Several reasons might explain these findings: Opposed to the study of Xue et al., we here (i) treated patient-derived, ultra-low passage (P1) xenografts that allowed to grow for some weeks (instead of only a few days); (ii) Palomid 529 was given 6 times peritumorally (vs. daily applications); (iii) the dose applied in this study was quite low compared to the published ones (1 mg/kg bw vs. 25-100 mg/kg bw).Citation25 Still, our results do rather not support a Palomid 529-based conjunctional strategy.
Taken together, this study on ultra-low passage GBM models provides another rationale for personalized medicine. Finally, combinatorial strategies should generally be considered preferably in order to develop an effective treatment regimen. In addition to boosting therapeutic effects, more advantages of ADI-based treatments are at hand: (I) drug application in low doses, thus minimizing toxic side effects; (II) the chance to target all (transformed) subpopulations, since intratumoral heterogeneity is well known; and (III) acting as chemosensitizer, thus making tumor cells more vulnerable to chemo- or even radiotherapy.
Methods
Production of S. pyogenes ADI and determination of ADI activity
ADI from S. pyogenes serotype M49 strain 591 was heterologously expressed in E. coli DHα and purified as reported previously.Citation11 Following purification, ADI activity was assayed by measuring the rate of ammonia produced by the conversion of L-Arg to L-citrulline as described using Ammonia Assay Kit (Sigma, AA0100).Citation11 Here, L-glutamate dehydrogenase catalyzes the reaction of ammonia, α-ketoglutaric acid (KGA), and reduced nicotinamide adenine dinucleotide phosphate (NADPH) to L-glutamate and oxidized nicotinamide adenine dinucleotide phosphate (NADP+). The decrease in absorbance at 340 nm due to the oxidation of NADPH was measured. The amount of oxidized NADPH is equivalent to the amount of ammonium in the sample. Activity was expressed as μmol ammonium produced per minute per mg of enzyme.
Glioblastoma cell lines
Glioblastoma cell lines were established from resection specimens and characterized.Citation12,13 Cell lines were maintained in DMEM/F12 medium (PAN, P04-41500; + 10% FCS (PAN, P40-47500), 2 mM L-glutamine (Sigma, G-7513), antibiotics) and incubated at 37°C in a humidified atmosphere of 5% CO2. Antibiotics and antifungal agents were provided by the pharmacy of the Rostock University Medical Center.
Treatment protocol
GBM cell lines (12 in total) were treated with increasing ADI concentrations (ranging from 3.5 to 350 mU/ml) for 72 h. Thereafter, selected cell lines were used for combination experiments. Cells were either treated with the standard GBM drug temozolomide (TMZ; 0.125 μM and 0.375 μM, pharmacy of the Rostock University Medical Center), or experimental/preclinical agents: chloroquine (5 μM and 20 μM, Sigma, C6628), suberoylanilide hydroxamic acid (SAHA; 0.25 μM and 0.5 μM; Biozol, MK0683), or Palomid 529 (a dual TORC1/TORC2 inhibitor; 7.5 μM; Biozol, SEL-S2238-10), ADI or combinations of the drugs. Read out was performed after 72 and 144 h, respectively.
RNA isolation, cDNA synthesis, and quantitative PCR
Total RNA from GBM cells was isolated with TRIzol® reagent according to the manufacturer's instructions. RNA was reverse transcribed into cDNA from 1 μg RNA using the cDNA Reverse Transcription system provided by Bioron (Bioron, 509001, 105250, 105250). Target cDNA levels were analyzed by quantitative SYBR Green-1 PCR taking advantage of the SibirRoxHot Master Mix (Bioron, 119405) and the following primer: ASS1 forward 5′-ggccaaaaaggtgttcattg-3′ and ASS1 reverse 5′-attccaatgaagcggttctc-3′. Primer concentrations were optimized in prior experiments. PCR conditions were as follows: 94°C, 45 s; 60°C, 45s and 72°C, 1 min for a total of 30 cycles.Citation14 Argininosuccinate lyase (ASL) forward 5′-tgatgccccagaagaaaaac-3′ and ASL reverse 5′-tggtgaatctgcagcgtag-3′. GAPDH was used as internal standard (forward 5′-gaaggtgaaggtcggagtc-3′, reverse 5′-gaagatggtgatgggatttc-3′. PCR was run on an ABI prism 7900 sequence detection system (Applied Biosystems). Reactions were performed in triplicate wells. Expression levels of the gene of interest were calculated in relation to the housekeeping gene (ΔCt = Ct target–Ct GAPDH). All values are given as 2^-dCT.
Bisulphite modification of gDNA and methylation specific PCR (MSP)
Bisulphite conversion of gDNA was done by applying the EpiTect Bisulfite Kit from Qiagen according to the manufacturers’ instruction (59104). Using this system, unmethylated cytosine residues are being converted to uracil, while methylated cytosine residues remain unchanged. Semi-quantitative MSP was then performed to determine the methylation status of ASS1 (Set 2 and Set 4, respectively) and ASL (Set 1) using primer sets and PCR conditions as described in.Citation6 In each PCR reaction, 1 μl of bisulphite modified DNA was used as template. PCR products were visualized using a transilluminator. Additionally, methylation profile of selected cell lines (HROG02, HROG05, and HROG10) was quantified by SYBR Green-1 PCR taking advantage of the SibirRoxHot Master Mix (Bioron, 119405) and equal conditions as before. As control, CpG Methyltransferase (M. SSS1)–treated gDNA of normal blood leukocytes was applied. The level of CpG island methylation in ASS1 and ASL genes was finally quantified by setting values of SSS1-treated gDNA =100% and calculating expression values of GBM cell lines.
Flow cytometric DNA analysis and Crystal violet staining
Cells were grown to about 70% confluence in 24-well culture plates and then incubated in 2 ml complete medium with or without substances for 72 and 144 hours, respectively. Thereafter, cells were prepared for crystal violet staining, as well as flow cytometric apoptosis and cell cycle analysis as reported.Citation15 Additionally, a Yo-Pro-1/PI-based assay for discriminating apoptotic and necrotic cells was applied as explained in.Citation16
CMFDA proliferation assay
Selected cell lines (HROG02, HROG05) were included into a flow cytometric-based proliferation assay. Cells (5 × 10⁴) were stained with CMFDA (5-chloromethylfluorescein diacetate, 1 μM, in the dark; Biotium, 90041), seeded in 24-well plates and allowed to adhere overnight. ADI was added the following day at a final concentration of 35 mU/ml. Controls were left untreated. Treatment was continued for a total of 6 days. Each day, one well of treated and control cells was harvested and conducted to flow cytometry. Mean fluorescence intensity (MFI) was measured as a marker for proliferation. CMFDA is being equally distributed when cells divide, hence, the proliferation rate is proportional to intensity of the fluorescence signal (high proliferation = low MFI and vice versa).
In vivo xenograft model
Male NMRI Foxn1nu mice weighing 20-25 g were used for in vivo xenograft studies. Mice were bred in the animal facilities (University of Rostock) and maintained in specified pathogen-free conditions. All experimental procedures were carried out in strict accordance with the recommendations in the Guide for the Care and Use of Laboratory Animals of the National Institutes of Health. The protocol was approved by the Committee on the Ethics of Animal Experiments of the University of Rostock (Landesamt für Landwirtschaft, Lebensmittelsicherheit und Fischerei Mecklenburg-Vorpommern; permission number: LALLF M-V/TSD/7221.3-1.1-083-11). Xenografting was performed by subcutaneous implantation of HROG05 tumor pieces (3 × 3 × 3 mm) into the right hind flank under anesthesia (Ketamin/Xylazin: 90/6 mg/kg bw). Upon tumor establishment (around 35 days after implantation), groups were randomized (n = 5 mice per group): group 1: control (PBS + DMSO, twice a week); group 2: Palomid 529 (1 mg/kg bw, twice a week); group 3: ADI (250 U/kg bw, twice a week); group 4: combination 1 (ADI + Palomid 529); group 5: SAHA (25 mg/kg bw, twice a week); group 6: combination 2 (ADI + SAHA). Mice were given a total of 6 peritumoral injections (i.e., close to the tumor). Tumor growth was controlled regularly and volume was estimated according to the formula: V = width2 * length * 0.52. All mice (treatment, control) were sacrificed at day 21 or when they became moribund before the tumor volume reached 1000 mm3. Tumors were removed for further routine histological examinations.
Statistics
Values are reported as the mean ± SD for in vitro data and mean ± SEM for in vivo data. After proving the assumption of normality, differences between treated and control cells as well as saline and treated animals were determined by using the unpaired Student's t-test. If normality failed, the nonparametric Mann–Whitney U-Test was applied. The tests were performed by using Sigma-Plot 12.5 (Jandel Corp, San Rafael, CA). The criterion for significance was set to P < 0.05.
Disclosure of Potential Conflicts of Interest
No potential conflicts of interest were disclosed.
Acknowledgments
The authors thank Dr. C.S. Mullins for establishment of primary GBM cell lines.
References
- Hanahan D, Weinberg RA. Hallmarks of cancer: the next generation. Cell 2011; 144:646-74; PMID:21376230; http://dx.doi.org/10.1016/j.cell.2011.02.013
- Delage B, Fennell DA, Nicholson L, McNeish I, Lemoine NR, Crook T, Szlosarek PW. Arginine deprivation and argininosuccinate synthetase expression in the treatment of cancer. Int J Cancer 2010; 126:2762-72; PMID:20104527
- Synakiewicz A, Stachowicz-Stencel T, Adamkiewicz-Drozynska E. The role of arginine and the modified arginine deiminase enzyme ADI-PEG 20 in cancer therapy with special emphasis on Phase I/II clinical trials. Expert Opin Investig Drugs 2014; 26:1-13.
- Phillips MM, Sheaff MT, Szlosarek PW. Targeting arginine-dependent cancers with arginine-degrading enzymes: opportunities and challenges. Cancer Res Treat 2013; 45:251-62; PMID:24453997; http://dx.doi.org/10.4143/crt.2013.45.4.251
- Dillon BJ, Prieto VG, Curley SA, Ensor CM, Holtsberg FW, Bomalaski JS, Clark MA. Incidence and distribution of argininosuccinate synthetase deficiency in human cancers: a method for identifying cancers sensitive to arginine deprivation. Cancer 2004; 100:826-33; PMID:14770441; http://dx.doi.org/10.1002/cncr.20057
- Syed N, Langer J, Janczar K, Singh P, Lo Nigro C, Lattanzio L, Coley HM, Hatzimichael E, Bomalaski J, Szlosarek P, et al. Epigenetic status of argininosuccinate synthetase and argininosuccinate lyase modulates autophagy and cell death in glioblastoma. Cell Death Dis 2013; 4:e458; PMID:23328665; http://dx.doi.org/10.1038/cddis.2012.197
- Bayin NS, Modrek AS, Placantonakis DG. Glioblastoma stem cells: Molecular characteristics and therapeutic implications. World J Stem Cells 2014; 6:230-8; PMID:24772249; http://dx.doi.org/10.4252/wjsc.v6.i2.230
- Wilson TA, Karajannis MA, Harter DH. Glioblastoma multiforme: State of the art and future therapeutics. Surg Neurol Int 2014; 5:64; PMID:24991467; http://dx.doi.org/10.4103/2152-7806.137196
- Savaraj N, Wu C, Kuo MT, You M, Wangpaichitr M, Robles C, Spector S, Feun L. The relationship of arginine deprivation, argininosuccinate synthetase and cell death in melanoma. Drug Target Insights 2007; 2:119-28; PMID:21901069
- Tsai WB, Aiba I, Lee SY, Feun L, Savaraj N, Kuo MT. Resistance to arginine deiminase treatment in melanoma cells is associated with induced argininosuccinate synthetase expression involving c-Myc/HIF-1alpha/Sp4. Mol Cancer Ther 2009; 8:3223-33; PMID:19934275; http://dx.doi.org/10.1158/1535-7163.MCT-09-0794
- Hering S, Sieg A, Kreikemeyer B, Fiedler T. Kinetic characterization of arginine deiminase and carbamate kinase from Streptococcus pyogenes M49. Protein Expr Purif 2013; 91:61-8; PMID:23867361; http://dx.doi.org/10.1016/j.pep.2013.07.002
- Mullins CS, Schneider B, Stockhammer F, Krohn M, Classen CF, Linnebacher M. Establishment and characterization of primary glioblastoma cell lines from fresh and frozen material: a detailed comparison. PLoS One 2013; 8:e71070; PMID:23951083; http://dx.doi.org/10.1371/journal.pone.0071070
- Mullins CS, Schubert J, Schneider B, Linnebacher M, Classen CF. Cilengitide response in ultra-low passage glioblastoma cell lines: relation to molecular markers. J Cancer Res Clin Oncol 2013; 139:1425-31; PMID:23749036; http://dx.doi.org/10.1007/s00432-013-1457-6
- Feun LG, Marini A, Walker G, Elgart G, Moffat F, Rodgers SE, Wu CJ, You M, Wangpaichitr M, Kuo MT, et al. Negative argininosuccinate synthetase expression in melanoma tumours may predict clinical benefit from arginine-depleting therapy with pegylated arginine deiminase. Br J Cancer 2012; 106:1481-5; PMID:22472884; http://dx.doi.org/10.1038/bjc.2012.106
- Klier U, Maletzki C, Göttmann N, Kreikemeyer B, Linnebacher M. Avitalized bacteria mediate tumor growth control via activation of innate immunity. Cell Immunol 2011; 269:120-7; PMID:21463858; http://dx.doi.org/10.1016/j.cellimm.2011.03.014
- Maletzki C, Klier U, Marinkovic S, Klar E, Andrä J, Linnebacher M. Host defense peptides for treatment of colorectal carcinoma – a comparative in vitro and in vivo analysis. Oncotarget 2014; 5:4467-79; PMID:24962950
- Kesari S. Understanding glioblastoma tumor biology: the potential to improve current diagnosis and treatments. Semin Oncol 2011; 38 Suppl 4:S2-10; PMID:22078644; http://dx.doi.org/10.1053/j.seminoncol.2011.09.005
- Lefranc F, Facchini V, Kiss R. Proautophagic drugs: a novel means to combat apoptosis-resistant cancers, with a special emphasis on glioblastomas. Oncologist 2007; 12:1395-403; PMID:18165616; http://dx.doi.org/10.1634/theoncologist.12-12-1395
- Yin D, Ong JM, Hu J, Desmond JC, Kawamata N, Konda BM, Black KL, Koeffler HP. Suberoylanilide hydroxamic acid, a histone deacetylase inhibitor: effects on gene expression and growth of glioma cells in vitro and in vivo. Clin Cancer Res 2007; 13:1045-52; PMID:17289901; http://dx.doi.org/10.1158/1078-0432.CCR-06-1261
- Vrana JA, Decker RH, Johnson CR, Wang Z, Jarvis WD, Richon VM, Ehinger M, Fisher PB, Grant S. Induction of apoptosis in U937 human leukemia cells by suberoylanilide hydroxamic acid (SAHA) proceeds through pathways that are regulated by Bcl-2/Bcl-XL, c-Jun, and p21CIP1, but independent of p53. Oncogene 1999; 18:7016-25; PMID:10597302; http://dx.doi.org/10.1038/sj.onc.1203176
- Huang L, Sowa Y, Sakai T, Pardee AB. Activation of the p21WAF1/CIP1 promoter independent of p53 by the histone deacetylase inhibitor suberoylanilide hydroxamic acid (SAHA) through the Sp1 sites. Oncogene 2000; 19:5712-9; PMID:11126357; http://dx.doi.org/10.1038/sj.onc.1203963
- Geng Y, Kohli L, Klocke BJ, Roth KA. Chloroquine-induced autophagic vacuole accumulation and cell death in glioma cells is p53 independent. Neuro Oncol 2010; 12:473-81; PMID:20406898
- Briceño E, Reyes S, Sotelo J. Therapy of glioblastoma multiforme improved by the antimutagenic chloroquine. Neurosurg Focus 2003; 14:e3.
- Lin F, Buil L, Sherris D, Beijnen JH, van Tellingen O. Dual mTORC1 and mTORC2 inhibitor Palomid 529 penetrates the blood-brain barrier without restriction by ABCB1 and ABCG2. Int J Cancer. 2013; 133:1222-33; PMID:23436212; http://dx.doi.org/10.1002/ijc.28126
- Xue Q, Hopkins B, Perruzzi C, Udayakumar D, Sherris D, Benjamin LE. Palomid 529, a novel small-molecule drug, is a TORC1/TORC2 inhibitor that reduces tumor growth, tumor angiogenesis, and vascular permeability. Cancer Res. 2008; 68:9551-7; PMID:19010932; http://dx.doi.org/10.1158/0008-5472.CAN-08-2058