Abstract
Schweinfurthins are intriguing natural products with anti-cancer activities and as yet incompletely understood mechanisms of action. We investigated whether inhibitors of P-glycoprotein (Pgp), in a manner analogous to other natural products, might enhance schweinfurthins' growth inhibitory actions by increasing intracellular schweinfurthin levels. Both the schweinfurthin-sensitive glioblastoma multiforme cell line SF-295 and relatively insensitive lung carcinoma cell line A549 were treated with 2 schweinfurthin analogs: 3-deoxyschweinfurthin B-p-nitro bis-stilbene (3dSB-PNBS) and 5′-methylschweinfurthin G (methyl-G). There was a synergistic enhancement of growth inhibition with the combination of the Pgp inhibitor verapamil and both analogs in SF-295 cells. Methyl-G, verapamil, and the combination did not result in alterations to intracellular calcium concentration. Verapamil increased the intracellular concentration of 3dSB-PNBS in both SF-295 and A549 cells in a Pgp-independent manner. Methyl-G, verapamil, and the combination do not result in increased ER stress. Methyl-G increased the intracellular concentration of a known Pgp substrate, Rhodamine 123 in SF-295 cells. Reduction of cellular cholesterol leads to the accumulation of Pgp substrates, as Pgp requires cholesterol for proper function. Since 3dSB enhances lovastatin-induced upregulation of the cholesterol efflux pump ABCA1, it is intriguing that co-treatment with cholesterol rescued the methyl-G-induced increase in Rhodamine 123 intracellular concentration. These studies support the hypothesis that verapamil potentiates the schweinfurthin growth inhibitory effect by increasing its intracellular concentration.
Abbreviations
| 3dSB | = | 3-deoxyschweinfurthin B |
| 3dSB-PNBS | = | 3-deoxyschweinfurthin B p-nitro bis-stilbene |
| BAPTA-AM | = | 1,2-bis(o-aminophenoxy)ethane-N,N,N',N'-tetraacetic acid |
| CI | = | combination index |
| DMP-PNBS | = | 3,4-dimethoxypheny-p-nitro bis-stilbene |
| ER | = | endoplasmic reticulum |
| GBM | = | Glioblastoma Multiforme |
| Methyl-G | = | 5'-methoxyschweinfurthin G |
| MTT | = | 3-(4,5-dimethylthiazol-2-yl)-2,5-diphenyltetrazolium bromide |
| NCI | = | National Cancer Institute |
| PARP | = | poly-ADP-ribose polymerase |
| Pgp | = | P-glycoprotein drug efflux pump |
Introduction
Schweinfurthins were first isolated from the plant Macaranga schweinfurthii in the late 1990s by the National Cancer Institute (NCI) Developmental Therapeutics Program and they were found to have potent and differential activity in the NCI 60-cell line screen.Citation1,2 Interestingly, schweinfurthins demonstrated potent growth inhibition against central nervous system cancer cell lines, specifically the glioblastoma multiforme (GBM) cell lines such as SF-295. In contrast schweinfurthins are not as potent growth inhibitors in the human lung carcinoma cell line A549. Development of the naturally occurring schweinfurthins for cancer therapy has been hindered by limited availability. Therefore, the total synthesis of the schweinfurthins was undertaken and several analogs were created that maintained the cytotoxic profiles of the natural product schweinfurthin B.Citation3-6 These included 3-deoxyschweinfurthin B (3dSB), the fluorescent 3-deoxyschweinfurthin B p-nitro bis-stilbene (3dSB-PNBS),Citation7 and 5′-methylschweinfurthin G (methyl-G). Additionally, an inactive compound 3,4-dimethoxyphenyl P-nitro bis-stilbene (DMP-PNBS) was created as a control for fluorescence studies as it contained the same fluorophore but lacked the key hexahydroxanthene substructure of the active schweinfurthins.Citation7 Schweinfurthins maintain a unique pattern of growth inhibition when compared to other compounds of known mechanisms of action. However, the exact mechanism of schweinfurthin mediated anti-proliferative activity remains unknown.Citation8-10
There are compounds that show some correlation with the schweinfurthins in the NCI 60 cell screen.Citation11,12 The compound (3β,16β)-16-[[2-O-acetyl-3-O-[2-O-(4-methoxybenzoyl)-β-D- xylopyranosyl]-α-L-arabinopyranosyl]oxy]-3,17-dihydroxy-cholest-5-en-22-one (OSW-1) depends on intracellular calcium in order to mediate its cytotoxicity. Combination of OSW-1 with the calcium chelator, BAPTA-AM, reduces its apoptotic effect.Citation13 In addition, Cephalostatin 1 is thought to initiate apoptosis though endoplasmic reticulum (ER) stress specific pathways.Citation14 We thought that these mechanistic insights might be of some help in a further search for the mechanism of the schweinfurthins.
We have previously shown that 3dSB and 3dSB-PNBS cause increased ER stress.Citation15 In this same study we also demonstrated that 3dSB and 3dSB-PNBS cause apoptosis as treatment resulted in the cleavage of caspase-9 and poly-ADP-ribose polymerase (PARP).Citation15 Therefore, to begin our explorations we hypothesized that the L-type Ca2+ channel inhibitor verapamil may synergistically enhance the growth inhibitory effect of 3dSB-PNBS and methyl-G. Here we report that verapamil does enhance the growth inhibitory effect of these 2 schweinfurthins, however it appears that this effect is calcium independent. Further we show that verapamil enhances the growth inhibitory activity of the schweinfurthins independent of its effect as an inhibitor of the P-glycoprotein (Pgp) drug efflux pump.
Results
Verapamil enhances schweinfurthin growth inhibitory activity in SF-295 cells
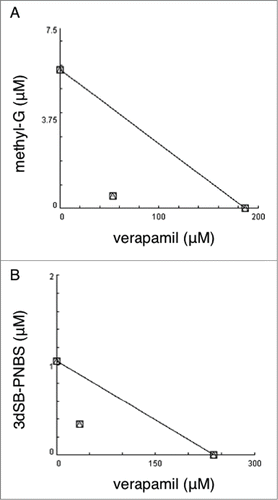
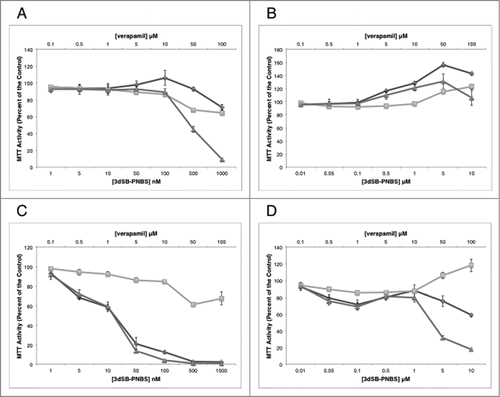
Due to the selective and differential growth inhibitory effects of the schweinfurthins in the NCI 60-cell line screen, we used a 2 cell line screen including schweinfurthin-sensitive SF-295 and insensitive A549 cells. In these cells we tested the combination of verapamil with methyl-G or 3dSB-PNBS using MTT assays. In SF-295 cells, the combination of methyl-G and verapamil inhibits growth after 24 hours of treatment more potently than either drug alone (). After 48-hour co-treatment in SF-295 cells, the combination of methyl-G and verapamil does not inhibit growth more than methyl-G alone (). Methyl-G combined with verapamil in A549 cells at 24-hours does not result in potentiated growth inhibition (). Intriguingly, verapamil potentiates the growth inhibitory effect of methyl-G (10 μM methyl-G and 100 μM verapamil) after 48-hours of incubation in A549 cells. Isobologram analysis of this growth potentiation is not possible due to the limited growth inhibitory potential of verapamil as a single agent at 10, 50, and 100 μM treatment doses (). Similar patterns of potentiation are also observed with 3dSB-PNBS in combination with verapamil. In SF-295 cells after 24-hours of drug incubation, higher concentrations of 3dSB-PNBS (500 nM and 1 μM) and verapamil (50 μM and 100 μM) demonstrate enhanced growth inhibition (). After 48-hour drug incubation in SF-295 cells, verapamil does not potentiate the growth inhibitory effect of 3dSB-PNBS (). In A549 cells after 24-hours, the combination of 3dSB-PNBS and verapamil does not demonstrate enhanced growth inhibition (). Similar to methyl-G, 3dSB-PNBS also demonstrates potentiated growth inhibition with verapamil after 48-hours of drug incubation in A549 cells (). Isobologram analysis of the growth inhibitory effect of the 3 highest concentrations of methyl-G or 3dSB-PNBS (100 nM, 500 nM, 1 μM) and verapamil (10 μM, 50 μM, 100 μm) in SF-295 cells after 24-hour drug incubation results in a combination index (CI) of 0.38 for methyl-G () and 0.47 for 3dSB-PNBS (). These results indicate that verapamil synergistically enhances the growth inhibitory effect of methyl-G and 3dSB-PNBS.
Figure 1. MTT analysis of the combination of verapamil with methyl-G. MTT analysis of the combination of methyl-G and verapamil after 24 hour (A, B) and 48 hour (C, D) drug incubation in SF-295 (A, C) and A549 (B, D) cells. Figures are representative of at least 2 independent experiments. Methyl-G or 3dSB-PNBS (diamond), verapamil (square), combination (triangle).
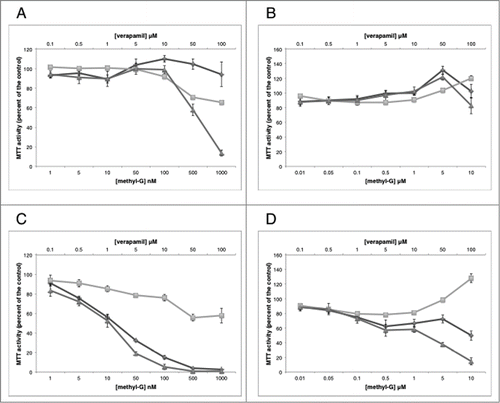
Figure 2. MTT analysis of the combination of verapamil with 3dSB-PNBS. MTT analysis of the combination of 3dSB-PNBS and verapamil after 24 hour (A, B) and 48 hour (C, D) drug incubation in SF-295 (A, C) and A549 (B, D) cells. Figures are representative of at least 2 independent experiments. Methyl-G or 3dSB-PNBS (diamond), verapamil (square), combination (triangle).
Methyl-G does not alter intracellular calcium homeostasis
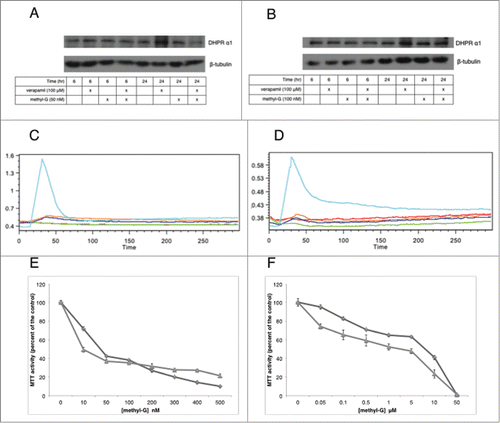
Knowing that verapamil acts to increase the intracellular concentration of 3dSB-PNBS in a Pgp independent fashion, we investigated whether verapamil's other action as a L-type calcium channel inhibitor leads to alterations in calcium homeostasis that may further potentiate the schweinfurthin growth inhibitory effect. Western blot analysis shows that the L-type calcium channel DHPR α1 is expressed in both SF-295 and A549 cells and that the expression of this channel is not altered upon treatment with methyl-G, verapamil, or the combination (). Examination of intracellular calcium concentration by flow cytometry indicates that methyl-G, verapamil, and the combination does not result in alterations in intracellular calcium concentration, as only the positive control ionomycin displays a significant effect (). Due to the antagonistic relationship between BAPTA-AM and OSW-1, we tested the combination of BAPTA-AM with methyl-G using MTT assays. We found that 10 μM BAPTA-AM does not attenuate the growth inhibitory effect of methyl-G (). These results indicate that methyl-G does not impact intracellular calcium homeostasis and that the addition of verapamil does not enhance this effect.
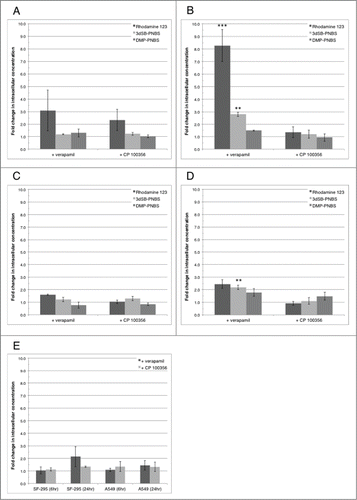
Figure 4. Intracellular concentration of schweinfurthins upon combination treatment with verapamil or CP 100356. (A and B) fold change in intracellular concentration of Rhodamine 123 (5 nM), 3dSB-PNBS (5 nM), and DMP-PNBS (5 nM) in SF-295 cells at 6 (A) and 24 (B) hours combined with either verapamil (100 μM) or CP 100356 (100 nM). (C and D) fold change in intracellular concentration of Rhodamine 123 (50 nM), 3dSB-PNBS (50 nM), and DMP-PNBS (50 nM) in A549 cells at 6 (C) and 24 (D) hours combined with either verapamil (100 μM) or CP 100356 (100 nM). (E) fold change in intracellular concentration of JK-4046 (100 nM) in SF-295 and A549 cells combined with either verapamil (100 μM) or CP 100356 (100 nM) for 6 and 24 hours. Figures are representative of 3 independent experiments. (**) p<0.005, (***) p<0.0005.
Verapamil increases the intracellular concentration of 3dSB-PNBS
With the knowledge that verapamil synergistically enhances the growth inhibitory effect of methyl-G and 3dSB-PNBS, we determined if verapamil increases the intracellular concentration of 3dSB-PNBS using our previously described method.Citation15 Verapamil significantly increases the intracellular concentration of 3dSB-PNBS 2.8 fold in SF-295 cells and 2.2 fold in A549 cells after 24-hours of drug incubation (). However, 6-hour drug incubations in both SF-295 and A549 cells do not significantly increase the intracellular concentration levels of 3dSB-PNBS (). In SF-295 cells, verapamil significantly increases the intracellular concentration of the known Pgp-drug efflux pump substrate Rhodamine 123 at 24-hours (). The specific Pgp inhibitor, CP 100356, does not replicate the verapamil effect. DMP-PNBS intracellular concentration is not altered by verapamil or CP 100356 treatment () showing this is a compound type specific effect. There is no significant increase in JK-4046 intracellular concentration when it is combined with either verapamil or CP-100356 (). These results indicate that verapamil acts to increase the intracellular concentration of 3dSB-PNBS in both SF-295 and A549 cells and that this effect is not specific to Pgp inhibition.
Figure 5. The effects of methyl-G, verapamil, and the combination on calcium homeostasis. (A and B) western blot analysis of DHPRα1 in SF-295 (A) and A549 (B) cells at 6 and 24 hours after incubation with methyl-G, verapamil, or the combination. Images are representative of 3 independent experiments. (C and D) flow cytometric analysis of intracellular calcium release in SF-295 (C) and A549 (D) cells over 5 minutes. The ratio of calcium green over fura red is reported on the y-axis. Images are representative of 3 independent experiments. Cyan: ionomycin (1 μg/mL), Red: vehicle (DMSO), Blue: verapamil (100 μM), Green: methyl-G (10 μM), Orange: methyl-G (10 μM) plus verapamil (100 μM). (E and F) MTT analysis of methyl-G alone and in combination with 10 μM BAPTA-AM in SF-295 (E) and A549 (F) cells after 48-hour drug incubation. Figures are representative of at least 2 independent experiments. Methyl-G alone (diamond), Methyl-G + 10 μM BAPTA-AM (triangle).
Methyl-G treatment does not lead to GRP78 up-regulation
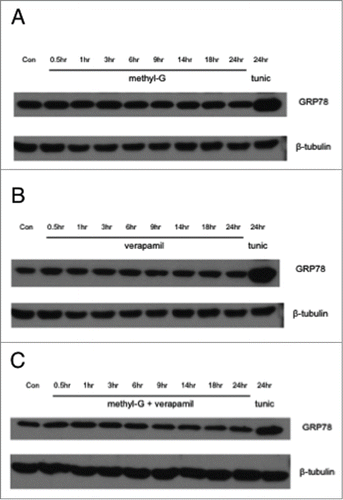
Disruption of protein trafficking within the ER and/or increased protein aggregation in the ER activates the unfolded protein response, which leads to an attenuation of protein synthesis and upregulation of chaperone proteins.Citation16-18 To measure ER stress, we tracked the increased expression of the chaperone protein GRP78. With a 24-hour time course study, methyl-G alone does not increase the expression of GRP78 (). Densitometric analysis shows verapamil alone does not significantly lead to an increase in GRP78 in SF-295 cells or A549 cells (). The combination of methyl-G and verapamil also does not result in significant up-regulation of GRP78 (). These results indicate that methyl-G alone and in combination with verapamil does not lead to increased expression of GRP78.
Methyl-G decreases Pgp activity; cholesterol co-treatment rescues this effect
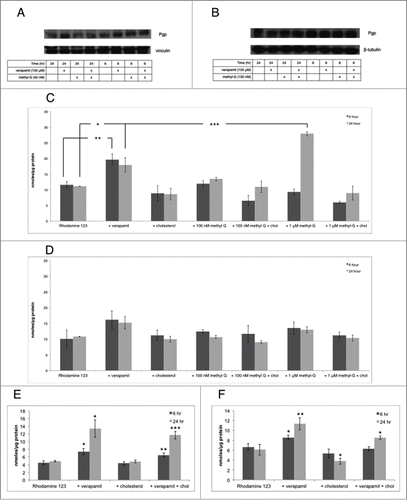
Previously reported results indicate that verapamil is increasing the intracellular concentration of 3dSB-PNBS in an apparent Pgp independent fashion. We hypothesized that methyl-G, verapamil, or the combination may alter Pgp expression. Using Western blot analysis we found that Pgp expression is unaltered in SF-295 and A549 cells (). This result prompted us to hypothesize that methyl-G may be altering Pgp activity and may lead to an increase in the intracellular concentration of a Pgp substrate. 1 μM methyl-G significantly increases the intracellular concentration of Rhodamine 123 to 27.9 nmoles/μg of protein after a 24-hour co-incubation in SF-295 cells (). In comparison, 100 μM verapamil only significantly increases the intracellular concentration of Rhodamine 123 to 17.9 nmoles/μg of protein after 24-hour co-incubation in SF-295 cells (). Interestingly, 1 μM methyl-G does not significantly increase the intracellular concentration of Rhodamine 123 above control after a 6-hour co-incubation, and 1 μM methyl-G does not effect the intracellular concentration of Rhodamine 123 at either 6 or 24-hour co-incubation in A549 cells when compared to the control (). Cholesterol co-treatment reverses the effect of 1 μM methyl-G on intracellular Rhodamine 123 concentration. The intracellular concentration of Rhodamine 123 fell from 27.9 nmoles/μg of protein to 8.9 nmoles/μg of protein when cholesterol was co-treated with 1 μM methyl-G in SF-295 cells (). Cholesterol alone has no effect compared to the control on intracellular Rhodamine 123 concentrations in SF-295 cells. Furthermore, cholesterol does not reverse verapamil's induced increase in intracellular Rhodamine 123 in SF-295 cells at either 6 or 24-hour incubations (). Interestingly, cholesterol co-treatment reverses verapamil induced increases in intracellular Rhodamine 123 concentration in A549 cells after 6-hour co-treatment (). Cholesterol alone significantly decreased intracellular Rhodamine 123 concentrations in A549 cells after 24-hour co-treatment (). Together these results indicate that methyl-G increases intracellular Rhodamine 123 concentration and that cholesterol co-treatment reverses this effect.
Figure 7. The effects of methyl-G, verapamil, and the combination on Pgp expression and activity. (A and B) protein gel blot analysis of Pgp in SF-295 (A) and A549 (B) cells at 6 and 24 hours after incubation with methyl-G, verapamil, or the combination. Images are representative of 3 independent experiments. (C–F) intracellular quantification of 500 nM Rhodamine 123 in SF-295 (C, E) and A549 (D, F) cells alone and in combination with 100 μM verapamil, 400 μg/mL cholesterol, or various concentrations of methyl-G as indicated. Figures are representative of 3 independent experiments. (*) p <0.05, (**) p<0.005, (***) p<0.0005.
Discussion
Schweinfurthins act as potent and selective growth inhibitors in some cancer cell lines, yet a specific mechanism of action has yet to be identified. We sought to gain insight into schweinfurthin mediated cancer cell growth inhibition by testing for drug interactions between the schweinfurthins and other drugs of known mechanisms of action. We identified verapamil as a drug that synergistically enhances the growth inhibitory effect of the schweinfurthins in SF-295 cells. Here we show that verapamil combined with either methyl-G or 3dSB-PNBS in SF-295 cells after 24-hour incubation results in a synergistically enhanced schweinfurthin induced growth inhibition (). Intriguingly, verapamil only enhances the growth inhibitory effect of methyl-G and 3dSB-PNBS after 24-hour incubation. This indicates that verapamil enhances the schweinfurthin growth inhibitory effect before the schweinfurthin alone has an observable growth inhibitory effect, as both methyl-G and 3dSB-PNBS are relatively non-toxic after 24 hours. The potentiation of the schweinfurthin induced growth inhibitory effect elicited by verapamil confirms the differential activity of methyl-G and 3dSB-PNBS in SF-295 and A549 cells.
Our initial hypothesis was that schweinfurthins would be synergistically disrupting calcium signaling in a manner similar to OSW-1.Citation19,20 Therefore, we investigated intracellular calcium homeostasis. We found that the L-type calcium channel, DHPRα1, expression remains unchanged in SF-295 cells and A549 cells (). Also, methyl-G, verapamil, and the combination did not result in alterations to intracellular calcium release () and they did not induce upregulation of GRP78 (). These observations lead us to conclude that intracellular calcium release is not the initial signal of schweinfurthin engagement and that upregulation of GRP78 is not induced by methyl-G alone or in combination with verapamil.
Looking beyond growth inhibition and MTT combination studies, we wanted to attempt to answer the question of why verapamil enhances the growth inhibitory effect of methyl-G and 3dSB-PNBS. In order to answer this question we first utilized a method that let us analyze the intracellular concentrations of the fluorescent Rhodamine 123, 3dSB-PNBS, and DMP-PNBS when combined with either verapamil or the specific Pgp inhibitor CP 100356. We found that verapamil, not CP 100356, significantly increased the intracellular concentration of 3dSB-PNBS in both SF-295 and A549 cells (). This result was intriguing because it meant that the combination of verapamil and 3dSB-PNBS was increasing the intracellular concentration of 3dSB-PNBS in an apparent Pgp independent manner. One explanation for this would be another drug efflux pump responsible for the effects.Citation21 We thought that if this were the case using a schweinfurthin that is a substrate for Pgp would lead to a larger increase in intercellular concentration and enhanced synergy. Verapamil failed to significantly increase the intracellular concentration of JK-4046, a schweinfurthin analog that is a known Pgp substrate (). Importantly, JK-4046 also showed a dramatic synergy with verapamil (data not shown) leading to the conclusion that verapamil may not be solely exerting its synergy with the schweinfurthins by increasing intracellular schweinfurthin concentration. We hypothesized that schweinfurthins may have an effect on Pgp expression or activity as the synergistic relationship between methyl-G and verapamil could not be solely explained by increases in intracellular concentrations of the schweinfurthin. We found that methyl-G does not significantly alter Pgp expression (). These observations lead us to the idea that methyl-G may be affecting Pgp function. We found that methyl-G significantly increased the intracellular concentration of Rhodamine 123 in SF-295 cells (). This result may indicate that methyl-G is altering Pgp efflux of Rhodamine 123. Cholesterol is a key component in Pgp function, as depletion of cholesterol leads to an accumulation in fluorescent Pgp substrates.Citation22 Previously we have shown that 3dSB synergized with lovastatin and that 3dSB attenuated lovastatin-induced decrease in the cholesterol efflux pump ABCA1.Citation23 We hypothesized that the schweinfurthins may be depleting intracellular cholesterol and we in turn found that co-treatment with cholesterol reversed the methyl-G induced increase in intracellular Rhodamine 123 (). This indicates that cholesterol may play a key role in schweinfurthin induced growth inhibition as co-treatment with cholesterol rescues an intracellular effect of schweinfurthin treatment.
Our results here pinpoint cholesterol as a key component of schweinfurthin action. Intracellular cholesterol primarily resides in the plasma membrane, yet a small pool of cholesterol also exists in the ER.Citation24,25 Membrane cholesterol is important for the integrity of lipid rafts; lipid rafts are in turn important in regulating cell surface protein activity and downstream signal transduction.Citation26 A perturbation in membrane cholesterol content can have deleterious effects on Pgp and other cell surface receptors such as epidermal growth factor receptor (EGFR). Interestingly, EGFR localization to lipid rafts has been associated with increased small molecule tyrosine kinase inhibitor resistance and cholesterol depletion restores sensitivity.Citation27 Schweinfurthins have recently been shown to reduce Akt phosphorylation subsequent to shutting down the trans-Golgi network system in several cell lines including human derived glioblastoma line U87MG.Citation28 This report also showed that schweinfurthin G directly interacts with oxysterol binding proteins which are involved in vesicle trafficking and other important lipid regulation systems.Citation29-31 Interestingly, the oxysterol 7-ketocholesterol induces Pgp activity by activating the Akt/PI3K/mTOR signaling pathway in liver cancers,Citation32 and Pgp activity is reduced by the anti-hypercholesterolemic agent atorvastatin.Citation33 These reports indicate that the oxysterol signaling and the systems responsible for cholesterol regulation are connected directly to the Pgp drug efflux pump.
Here we have shown that verapamil enhances schweinfurthin action. Closer analysis of this relationship is providing further clues to the as yet unknown mechanism of schweinfurthin induced growth inhibition. Cholesterol has also been identified as a key component of schweinfurthin action. Our observations here lead to further questions and hypotheses. It is possible that because verapamil inhibits Pgp it has indirect effects on cholesterol in the membrane environment where the schweinfurthins are exerting their effects on oxysterol signaling. Ongoing studies with the schweinfurthins are continuing toward the goal of using the compounds as viable pharmacological options in schweinfurthin sensitive tumors. To completely exploit the anti-proliferative activity of schweinfurthins in sensitive tumors a more detailed understanding of the mechanism is critical. Further studies aimed at integrating the current state of knowledge will be reported in due course.
Methods
Cell culture and materials
The human glioblastoma multiforme cell line, SF-295, was maintained in RPMI 1640 media containing 10% fetal bovine serum, 2.5 μg/mL amphotericin B, 100 units/mL penicillin, 100 μg/mL streptomycin, and 2 mM L-glutamine. The human lung carcinoma cell line, A549, was maintained in Ham's F-12 media containing 10% fetal bovine serum, 2.5 μg/mL amphotericin B, 100 units/mL penicillin, 100 μg/mL streptomycin, and 2 mM L-glutamine. Cell lines were incubated at 37°C and 5% CO2. Rhodamine 123 (83702) and the water-soluble cholesterol (C4951) were obtained from Sigma-Aldrich (St. Louis, MO). Verapamil hydrochloride (0654), CP 100356 (4193), Tunicamycin from Streptomyces sp. (3516), and 1,2-Bis(2-aminophenoxy) ethane-N,N,N′, N′ – tetraactetic acid tetrakis (acetoxymrthyl ester) (BAPTA-AM) (2767) were obtained from Tocris Bioscience (Minneapolis, MN). Ionomycin (sc-3592) was obtained from Santa Cruz Biotechnology (Dallas, TX). Synthesis and preparation of the schweinfurthin analogs 3dSB-PNBS and DMP-PNBS have been previously described.Citation7 Methyl-G and another synthetic schweinfurthin JK-4046Citation5,6 were provided by Terpenoid Therapeutics Inc.., Coralville, IA.
MTT assay
SF-295 or A549 cells were plated in 96-well plates and treated once cells reached 50% confluency. After 20 or 44 hours of exposure, media was aspirated and replaced with filter sterilized RPMI 1640 without phenol red (SF-295) or F-12 (A549) containing MTT [3-(4,5-Dimethyl-2-thiazolyl)-2,5-diphenyl-2H-tetrazolium Bromide, Thiazole Blue] salt at 0.6 mg/mL (EMD Millipore, Darmstadt, Germany). After 4 hours of incubation, the conversion of the MTT salt to its reduced form is halted with MTT solubilization solution (10% 1 N HCl, 10% Triton X-100, 80% isopropyl alcohol). To allow for complete solubilization cells were incubated at 37°C with constant agitation overnight. During incubation plates were tightly wrapped in plastic wrap to prevent evaporation. Absorbance was measured using a plate reader by taking the difference of absorbance measured at 540 nm and 650 nm. The absorbance for control untreated cells was set to 100% MTT activity. Isobolograms derive from MTT activity profiles of SF-295 cells treated with 100 nM, 500 nM, and 1 μM methyl-G or 3dSB-PNBS alone and in combination with 10 μM, 50 μM, and 100 μM verapamil. Isobolograms and combination indices were generated from CompuSyn software (ComboSyn, Inc..) and methods described previously.Citation34 Combination indices below 0.8 were considered synergistic.
Fluorescent intracellular concentration assay
This method was previously used by us to determine 3dSB-PNBS intracellular concentration.Citation15 SF-295 or A549 cells were plated in 12-well plates. At about 60% confluence, cells were treated with or without Rhodamine 123, 3dSB-PNBS, or DMP-PNBS combined with or without verapamil or CP 100356 for 6 and 24 hours. After 6 or 24 hours cells were harvested by incubation with 0.25% trypsin/EDTA for 5 minutes. After incubation, an equal volume of media was added to neutralize the trypsin. Cells were then collected and centrifuged at 1500 g for 7 minutes at 4°C. The cell pellet was washed with phosphate-buffered saline and centrifuged again at 1500 g for 7 minutes at 4°C. Cells were lysed on ice for 30 minutes with radioimmunoprecipitation assay (RIPA) lysis buffer [0.15 M NaCl, 0.05 M Tris HCl, 1% (w/v) sodium deoxycholate, 0.1% (w/v) SDS, 1% (v/v) Triton X-100, 1 mM EDTA, pH 7.4] containing 1 mM phenylmethylsulfonyl fluoride and protease inhibitor cocktail (Sigma). The cell lysate was then cleared by centrifugation at 14,000 g for 15 minutes at 4°C. Protein levels of each sample were then determined by the bicinchoninic acid assay and samples were stored at −80°C. The relative fluorescence of the samples was then measured at the excitation and emission maximum for the tested compounds on a SpectraMax M2e microplate reader (Molecular Devices, Sunnyvale, CA). Five point linear standard curves were created for each compound and sample values were normalized to protein content. Statistical significance was calculated using the f-test to compare variances followed by either the Welch 2 sample t-test or the 2 tailed t-test. Results with p-values less than 0.05 were considered significant.
Flow cytometric analysis of intracellular Ca2+ release
SF-295 or A549 cells were plated in 10 cm dishes. At 60–80% confluence cells were harvested with 0.25% trypsin/EDTA. Cells were then centrifuged at 1500 g for 10 minutes, rinsed with phosphate-buffered saline, centrifuged again at 1500 g for 10 minutes and re-suspended in suspension buffer [25 mM Hepes, 125 mM NaCl, 5 mM KCl, 1 mM Na2HPO4, 0.1% Dextrose, QS to 100 mL with dH20, pH 7.2]. Calcium Green and Fura Red [50 μg dye in 100 μL DMSO, 45 μL per cell pool](Life Technologies, Grand Island, NY) were incubated with the pooled SF-295 or A549 cells at 37°C for 30 minutes. Pooled cells were then divided back into samples and centrifuged at 1500 g for 10 minutes. Cells were then re-suspended in analysis buffer [1 mL of 50 mM MgCl2, 1 mL of 100 mM CaCl2, 0.1 g bovine serum albumin, QS to 100 mL with suspension buffer, pH 7.4] and kept at 37°C until they could be read on the flow cytometer. Samples were analyzed in the University of Iowa Flow Cytometry Core using a Becton Dickinson LSR II using Calcium Green (530/30 band pass) and Fura Red (670/14 band pass) in the A and C slots of the 488 nm excitation respectively. Intracellular calcium flux was calculated by using the ratio of Calcium Green (bound) over Fura Red (unbound) using FlowJo® (Ashland, OR) software.
Western blot analysis
SF-295 or A549 cells were plated in 6 or 10 cm dishes and treated at 65% confluency. At the conclusion of the drug incubation, cells were washed twice with cold phosphate-buffered saline and lysed on ice with RIPA lysis buffer (described in section 2.3) containing 1 mM phenylmethylsulfonyl fluoride, protease inhibitor cocktail (Sigma), and the phosphatase inhibitors sodium fluoride (10 mM) and sodium vanadate (2 mM). Cell lysate was scraped from plates, collected, and homogenized by either passing lysate through 27 G × ½ needles or by sonication. Lysate was then cleared by centrifugation at 14,000 g for 10 minutes at 4°C. Protein levels of each sample were then determined by the bicinchoninic acid assay and samples were stored at −80°C. Equivalent amounts of cell lysate were resolved by SDS-PAGE, transferred to polyvinylidene difluoride membrane, probed with primary antibody, and detected with corresponding HRP-secondary antibody using GE Healthcare Amersham ECL Western blot detection reagents. Primary antibodies included: β-tubulin (SC-9104), Pgp (SC-8313), Santa Cruz Biotechnology (Dallas, TX); vinculin (V9131) Sigma (St. Louis, MO); GRP78 (ab21685), DHPRα1 (ab84814), Abcam (Cambridge, MA). Secondary antibodies included HRP-linked mouse and rabbit, GE Healthcare (Piscataway, NJ). Densitometry analysis was preformed by using ImageJ and a method described previously.Citation35
Disclosure of Potential Conflicts of Interest
No potential conflicts of interest were disclosed.
Acknowledgments
We thank the Flow Cytometry Facility, which is a Carver College of Medicine Core Research Facilities/ Holden Comprehensive Cancer Center Core Laboratory at the University of Iowa. The Facility is funded through user fees and the generous financial support of the Carver College of Medicine, Holden Comprehensive Cancer Center, and Iowa City Veteran's Administration Medical Center.
Funding
This project was supported in part by the Roy J. Carver Charitable Trust, the Roland W Holden Family Program for Experimental Therapeutics, and the National Institutes of Health (5R42NS069272).
References
- Beutler JA, Shoemaker RH, Johnson T, Boyd MR. Cytotoxic geranyl stilbenes from macaranga schweinfurthii. J Nat Prod 1998; 61:1509-12; PMID:9868152; http://dx.doi.org/10.1021/np980208m
- Beutler JA, Jato JG, Cragg G, Wiemer DF, Neighbors JD, Salnikova M, Hollingshead M, Scudiero DA, McCloud TG. The Schweinfurthins: Issues in the Development of a Plant-Derived Anticancer Lead. 2006; 301-309; Springer, The Netherlands.
- Neighbors JD, Beutler JA, Wiemer DF. Synthesis of nonracemic 3-deoxyschweinfurthin B. J Org Chem 2005; 70:925-31; PMID:15675850; http://dx.doi.org/10.1021/jo048444r
- Neighbors JD, Salnikova MS, Beutler JA, Wiemer DF. Synthesis and structure–activity studies of schweinfurthin B analogs: evidence for the importance of a D-ring hydrogen bond donor in expression of differential cytotoxicity. Bioorg Med Chem 2006; 14:1771-84; PMID:16290161; http://dx.doi.org/10.1016/j.bmc.2005.10.025
- Kodet JG, Beutler JA, Wiemer DF. Synthesis and structure activity relationships of schweinfurthin indoles. Bioorg Med Chem 2014; 22:2542-52; PMID:24656801; http://dx.doi.org/10.1016/j.bmc.2014.02.043
- Kodet JG, Wiemer DF. Synthesis of indole analogues of the natural schweinfurthins. J Org Chem 2013; 78:9291-302; PMID:24004185; http://dx.doi.org/10.1021/jo4014244
- Topczewski JJ, Kuder CH, Neighbors JD, Hohl RJ, Wiemer DF. Fluorescent schweinfurthin B and F analogs with anti-proliferative activity. Bioorg Med Chem 2010; 18:6734-41; PMID:20724169; http://dx.doi.org/10.1016/j.bmc.2010.07.056
- Lockett S, Verma C, Brafman A, Gudla P, Nandy K, Mimaki Y, Fuchs PL, Jaja J, Reilly KM, Beutler J. et al. Quantitative analysis of F-actin redistribution in astrocytoma cells treated with candidate pharmaceuticals. Cytometry A 2014; 85A:512-21; PMID:24515854; http://dx.doi.org/10.1002/cyto.a.22442
- Turbyville TJ, Gursel DB, Tuskan RG, Walrath JC, Lipschultz CA, Lockett SJ, Wiemer DF, Beutler JA, Reilly KM. Schweinfurthin a selectively inhibits proliferation and Rho signaling in glioma and neurofibromatosis type 1 tumor cells in a NF1-GRD-dependent manner. Mol Cancer Ther 2010; 9:1234-43; PMID:20442305; http://dx.doi.org/10.1158/1535-7163.MCT-09-0834
- Burgett AWG, Poulsen TB, Wangkanont K, Anderson DR, Kikuchi C, Shimada K, Okubo S, Fortner KC, Mimaki Y, Kuroda M, et al. Natural products reveal cancer cell dependence on oxysterol-binding proteins. Nat Chem Biol 2011; 7:639-47; PMID:21822274; http://dx.doi.org/10.1038/nchembio.625
- Covell DG, Huang RL, Wallqvist A. Anticancer medicines in development: assessment of bioactivity profiles within the National Cancer Institute anticancer screening data. Mol Cancer Ther 2007; 6:2261-70; PMID:17699723; http://dx.doi.org/10.1158/1535-7163.MCT-06-0787
- Covell DG, Wallqvist A, Kenney S, Vistica DT. Bioinformatic analysis of patient-derived ASPS gene expressions and ASPL-TFE3 fusion transcript levels identify potential therapeutic targets. Plos One 2012; 7:e48023; PMID:23226201
- Zhou Y, Garcia-Prieto C, Carney DA, Xu RH, Pelicano H, Kang Y, Yu W, Lou C, Kondo S, Liu J, et al. OSW-1: a natural compound with potent anticancer activity and a novel mechanism of action. J Natl Cancer Inst 2005; 97:1781-5; PMID:16333034; http://dx.doi.org/10.1093/jnci/dji404
- Lopez-Anton N, Rudy A, Barth N, Schmitz ML, Pettit GR, Schulze-Osthoff K, Dirsch VM, Vollmar AM. The marine product cephalostatin 1 activates an endoplasmic reticulum stress-specific and apoptosome-independent apoptotic signaling pathway. J Biol Chem. 2006;281:33078-86; PMID:16945918; http://dx.doi.org/10.1074/jbc.M607904200
- Kuder CH, Sheehy RM, Neighbors JD, Wiemer DF, Hohl RJ. Functional evaluation of a fluorescent schweinfurthin: mechanism of cytotoxicity and intracellular quantification. Mol Pharmacol 2012; 82:9-16; PMID:22461663; http://dx.doi.org/10.1124/mol.111.077107
- Dorner AJ, Wasley LC, Kaufman RJ. Increased synthesis of secreted proteins induces expression of glucose-regulated proteins in butyrate-treated Chinese hamster ovary cells. J Biol Chem 1989; 264:20602-7; PMID:2511206
- Kozutsumi Y, Segal M, Normington K, Gething MJ, Sambrook J. The presence of malfolded proteins in the endoplasmic reticulum signals the induction of glucose-regulated proteins. Nature 1988; 332:462-4; PMID:3352747; http://dx.doi.org/10.1038/332462a0
- Rhoads RE. Signal transduction pathways that regulate eukaryotic protein synthesis. J Biol Chem 1999; 274:30337-40; PMID:10521405; http://dx.doi.org/10.1074/jbc.274.43.30337
- Garcia-Prieto C, Ahmed KBR, Chen Z, Zhou Y, Hammoudi N, Kang Y, Lou C, Mei Y, Jin Z, Huang P. Effective killing of leukemia cells by the natural product OSW-1 through disruption of cellular calcium homeostasis. J Biol Chem 2013; 288:3240-50; PMID:23250754; http://dx.doi.org/10.1074/jbc.M112.384776
- Zhou Y, Fritz RB, Garcia-Prieto C, Jin ZD, Huang P, LeSage G. OSW-1 induces calcium-dependent apoptosis in cholangiocarcinoma. Hepatology 2009; 50:1154A-5A
- Schinkel AH, Jonker JW. Mammalian drug efflux transporters of the ATP binding cassette (ABC) family: an overview. Adv Drug Deliv Rev 2003; 55:3-29; PMID:12535572; http://dx.doi.org/10.1016/S0169-409X(02)00169-2
- Gayet L, Dayan G, Barakat S, Labialle S, Michaud M, Cogne S, Mazane A, Coleman AW, Rigal D, Baggetto LG. Control of P-glycoprotein activity by membrane cholesterol amounts and their relation to multidrug resistance in human CEM leukemia cells. Biochemistry 2005; 44:4499-509; PMID:15766280; http://dx.doi.org/10.1021/bi048669w
- Holstein SA, Kuder CH, Tong H, Hohl RJ. Pleiotropic effects of a schweinfurthin on isoprenoid homeostasis. Lipids 2011; 46:907-21; PMID:21633866; http://dx.doi.org/10.1007/s11745-011-3572-y
- Lange Y, Steck TL. The role of intracellular cholesterol transport in cholesterol homeostasis. Trends Cell Biol 1996; 6:205-8; PMID:15157456; http://dx.doi.org/10.1016/0962-8924(96)20016-9
- Lange Y, Ye J, Steck TL. How cholesterol homeostasis is regulated by plasma membrane cholesterol in excess of phospholipids. Proc Natl Acad Sci U S A 2004; 101:11664-7; PMID:15289597; http://dx.doi.org/10.1073/pnas.0404766101
- Pike LJ. Lipid rafts: bringing order to chaos. J Lipid Res 2003;44:655-67; PMID:12562849; http://dx.doi.org/10.1194/jlr.R200021-JLR200
- Irwin ME, Mueller KL, Bohin N, Ge Y, Boerner JL. Lipid raft localization of EGFR alters the response of cancer cells to the EGFR tyrosine kinase inhibitor gefitinib. J Cell Physiol 2011; 226:2316-28; PMID:21660955;. 10.1002/jcp.22570
- Bao X, Zheng W, Sugi NH, Agarwala Kl, Xu Q, Wang Z, Tendyke K, Lee W, Parent L, Li W, et al. Small molecule schweinfurthins selectively inhibit cancer cell proliferation and mTOR/AKT signaling by interfering with trans-Golgi-network trafficking. Cancer Biol Ther 2015; 16:1-13; PMID:25692617; http://dx.doi.org/10.1080/15384047.2015.1019184
- Raychaudhuri S, Im YJ, Hurley JH, Prinz WA. Nonvesicular sterol movement from plasma membrane to ER requires oxysterol-binding protein-related proteins and phosphoinositides. J Cell Biol 2006; 173:107-19; PMID:16585271; http://dx.doi.org/10.1083/jcb.200510084
- Wood CS, Schmitz KR, Bessman NJ, Setty TG, Ferguson KM, Burd CG. PtdIns4P recognition by Vps74/GOLPH3 links PtdIns 4-kinase signaling to retrograde Golgi trafficking. J Cell Biol 2009; 187:967-75; PMID:20026658; http://dx.doi.org/10.1083/jcb.200909063
- Schroepfer GJ. Oxysterols: modulators of cholesterol metabolism and other processes. Physiol Rev 2000; 80:361-554; PMID:10617772
- Wang SF, Chou YC, Mazumder N, Kao FJ, Nagy LD, Guengerich FP, Huang C, Lee HC, Lai PS, Ueng YF. 7-Ketocholesterol induces P-glycoprotein through PI3K/mTOR signaling in hepatoma cells. Biochem Pharmacol 2013; 86:548-60; PMID:23792120; http://dx.doi.org/10.1016/j.bcp.2013.06.006
- Rodrigues AC, Curi R, Britto LRG, Rebbechi IMM, Hirata MH, Hirata RDC. Dow-regulation of ABCB1 transporter by atorvastatin in a human hepatoma cell line. Faseb J 2006; 20:A486-A; PMID:16996216
- Chou TC. Theoretical basis, experimental design, and computerized simulation of synergism and antagonism in drug combination studies. Pharmacol Rev 2006;58:621-81; PMID:16968952; http://dx.doi.org/10.1124/pr.58.3.10
- Starr T. Quantification of protein bands using densitometry. University Minnesota 2013; http://www1.med.umn.edu/starrlab/prod/groups/med/@pub/@med/@starrlab/documents/content/med_content_370494.html.

