
Abstract
Mcl-1 is an anti-apoptotic Bcl-2 family member that is often over-expressed in the malignant brain tumor glioblastoma (GBM). It has been previously shown that epidermal growth factor receptors up-regulate Mcl-1 contributing to a cell survival response. Hypoxia is a poor prognostic marker in glioblastoma despite the fact that hypoxic regions have areas of necrosis. Hypoxic regions of GBM also highly express the pro-cell death Bcl-2 family member BNIP3, yet when BNIP3 is overexpressed in glioma cells, it induces cell death. The reasons for this discrepancy are unclear. Herein we have found that Mcl-1 expression is reduced under hypoxia due to degradation by the E3 ligase FBW7 leading to increased hypoxia induced cell death. This cell death is reduced by EGFR activation leading to increased Mcl-1 expression under hypoxia. Conversely, BNIP3 is over-expressed in hypoxia at times when Mcl-1 expression is decreased. Knocking down BNIP3 expression reduces hypoxia cell death and Mcl-1 expression effectively blocks BNIP3 induced cell death. Of significance, BNIP3 and Mcl-1 are co-localized under hypoxia in glioma cells. These results suggest that Mcl-1 can block the ability of BNIP3 to induce cell death under hypoxia in GBM tumors.
Keywords:
Introduction
Glioblastoma (GBM) is the most malignant form of brain cancer with a high mortality rate.Citation1 The median duration of survival for patients with GBM is approximately 15 months despite treatment that consists of a combination of surgery, radiation and chemotherapy such as temozolomide (TMZ).Citation2 GBMs are considered members of the group of diffuse infiltrating gliomas.Citation3 Of this group, GBMs are the most common, representing over 40% of adult gliomas and are classified as W.H.O. grade IV astrocytoma. The pathological characteristics of GBM tumors are nuclear atypia, cellular polymorphism, significant mitotic activity, microvascular proliferation and extensive regions of necrosis which are indicative of hypoxia.Citation1,3
Hypoxia is a driving factor in cancer progression, contributing to tumor aggression and poor prognosis.Citation1 Defective tumor vasculature limits the delivery of oxygen and nutrients, often causing necrosis in the interior regions of solid tumors. However, surrounding hypoxic tumor cells can adapt, survive and proliferate by exploiting the induction of survival factors such as Bcl-2 family members. The cellular response to hypoxia leads to sustained angiogenesis and genomic instability, contributing to further tumor cell transformation.Citation1 Indeed, the extent of tumor hypoxia correlates with neoplastic aggression, resistance to therapy, and reduced patient survival especially GBM.Citation1 It is therefore important to understand the cell death mechanisms involved (and evaded) during hypoxia in order to develop improved cancer treatment strategies for GBM.
Myeloid cell leukemia-1 (Mcl-1) is an anti-apoptotic protein that plays an important role in regulating drug resistance.Citation4 Mcl-1 is an anti-apoptotic Bcl-2 family member that is often overexpressed in solid tumors, correlating with poor survival.Citation5 Mcl-1 is a downstream target of epidermal growth factor receptor (EGFR) activation in many different types of cancer, including GBM, through the activation of transcription factors including NFκB, Elk1 and Stat3.Citation6,7 In addition, Mcl-1 expression is regulated by hypoxia inducible factor 1 (HIF1) under hypoxia and over-expression of Mcl-1 has been shown to protect against hypoxia induced apoptosis. Unlike other Bcl-2 family members, Mcl-1 expression is tightly regulated by ubiquitination mediated degradation.Citation8 One E3 ligase important in Mcl-1 degradation is FBW-7.Citation9 How Mcl-1 expression levels are regulated in glioma cells under hypoxia is currently unknown.
The Bcl-2 19 kilodalton interacting protein 3 (BNIP3) is a pro-cell death Bcl-2 family member that is up-regulated during hypoxia.Citation10 When BNIP3 is upregulated, it induces caspase-independent cell death by localizing to the mitochondria and opening the permeability transition (PT) pore leading to loss of mitochondrial membrane potential (Δψm) and reactive oxygen species (ROS) production.Citation10,11 BNIP3 is directly up-regulated under hypoxic conditions by the transcription factor HIF-1 contributing to hypoxia induced cell death.Citation12-14 Paradoxically, BNIP3 is expressed at high levels in viable cells within hypoxic regions of GBM tumors and has been associated with poor prognosis in many cancers.Citation15 The factors that prevent BNIP3 induced cell death within hypoxic regions of tumors are not well understood.
Herein, we demonstrate that Mcl-1 expression is reduced under hypoxia mediated by FBW7 and EGFR activation increases Mcl-1 expression under hypoxia. Mcl-1 is also able to block BNIP3 and hypoxia induced cell death and co-localizes with BNIP3 in glioma cells under hypoxia.
Results
Bcl-2 family member Mcl-1 expression is reduced under hypoxia
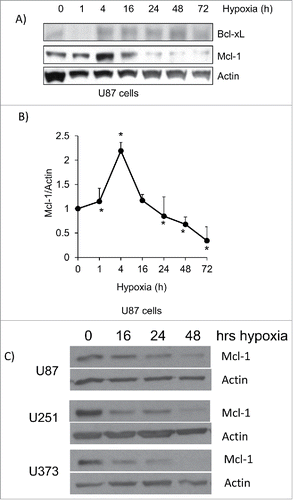
Mcl-1 expression levels in various cancer cells decrease under hypoxia.Citation8,16 We placed glioma cells lines U87 and U373 under hypoxia for a 72 hour time course and determined the amount of cell death. After 72 hours, the amount of cell death increased from 5% to 36% in U87 cells and from 9% to 28% in U373 cells (). During this same time course, the expression of Mcl-1 increased at 4 hours but decreased significantly after 24 hours of hypoxia in U87 cells (). In contrast, Bcl-xL expression remained constant over the 72 hour time course (). This decrease in Mcl-1 expression was also observed in U251 and U373 cells to a similar extent (). These results link lower Mcl-1 expression to increased hypoxia induced cell death.
Figure 1. Hypoxia induces cell death in glioma cells over a 72 hour time course. Glioma cell lines A) U87 and B) U373 were placed under hypoxia for a 72 hour time course. The amount of cell death was determined by trypan blue exclusion assay. Error bars represent standard error of 3 independent experiments and * represents a statistically significant difference between cell death levels in normoxia and hypoxia.
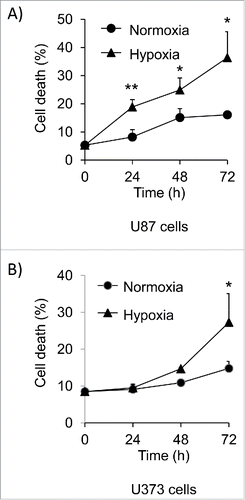
Figure 2. Mcl-1 levels decrease during hypoxia in glioma cells. (A) Western blot analysis of U87 cells was performed following a 72 hour time course under hypoxia. Mcl-1 and Bcl-xL protein levels were determined and actin was used as a loading control. (B) Relative levels of Mcl-1 protein expression confirmed by densitometry. Data represents mean of 3 independent experiments ± standard error. * represents statistically significant differences. (C) U87, U251 and U373 glioma cell lines were placed under hypoxia for a 48 hour time course. The cells were lysed and western blotted for Mcl-1. Actin was used as a loading control.
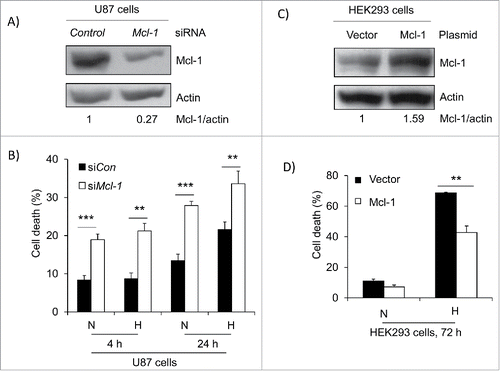
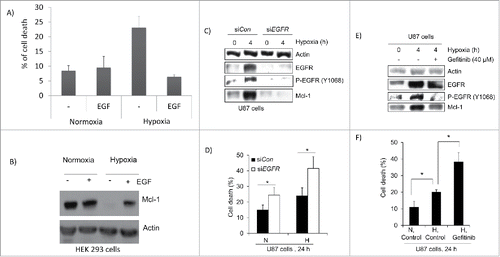
To investigate the role of Mcl-1 in hypoxia induced cell death, we knocked down Mcl-1 in U87 cells with siRNA and placed them under hypoxia for 4 and 24 hours. We found that a reduction in Mcl-1 expression increased cell death under normoxic condition and this cell death was further increased in hypoxia after 24 hours (). Conversely, when Mcl-1 was over-expressed in HEK 293 cells, and placed in hypoxia, the amount of cell death decreased from 70% to 42% after 72 hours (). These findings support that Mcl-1 expression levels regulate hypoxia induced cell death.
Figure 3. Mcl-1 contributes to cell survival under hypoxia. (A) U87 cells were transfected with siRNA control and siRNA against Mcl-1. The cells were then lysed and western blotted for Mcl-1. Actin was used as a loading control. (B) Cells were placed under hypoxia for 4 and 24 hours where N=normoxia and H=hypoxia. Amount of cell death was determined in cells transfected with siRNA control (siCon) and siRNA against Mcl-1 (siMcl-1) using a trypan blue exclusion assay. (C) HEK293 cells were transfected with expression vector alone or with cDNA for Mcl-1. The cells were lysed and western blotted for Mcl-1. Actin was used as a loading control. (D) The transfected cells were placed under hypoxia for 72 hours where N = normoxia and H = hypoxia. The amount of cell death was determined by trypan blue exclusion assay. * represents statistically significant differences between normoxia and hypoxia. Error bars represent standard error of 3 independent experiments.
Mcl-1 expression is reduced under hypoxia through up-regulation of the E3 ligase FBW7
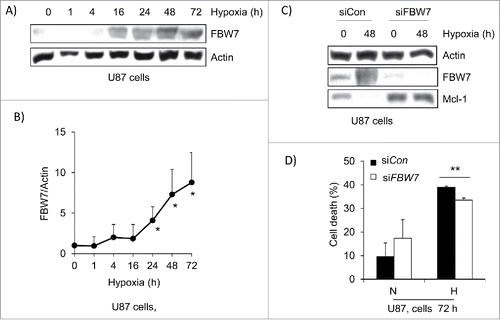
Mcl-1 expression is regulated at the transcriptional level and by protein degradation.Citation8 However, the reduction of Mcl-1 expression level under hypoxia is not controlled at the level of transcription. FBW7 is an E3 ligase that has been implicated in Mcl-1 degradation.Citation9 U87 cells were western blotted for FBW7 levels over a 72 hour hypoxia time course and unlike Mcl-1 expression, we found that its expression increased under hypoxia over time, peaking at 72 hours (). This was further confirmed in a western blot of the invasive GBM cell line BTIC-12 where FBW-7 was upregulated ant MCl-1 was reduced (Fig. S1). FBW7 protein levels were knocked down by siRNA in U87 cells and the amount of Mcl-1 expression and cell death was determined. We found that Mcl-1 expression was increased after 48 hours of hypoxia and the amount of cell death was significantly reduced by 38% after 72 hours (). Our results suggest that Mcl-1 levels are regulated by FBW7 under hypoxia.
Figure 4. E3 ligase FBW7 expression is increased in hypoxia and contributes to Mcl-1 degradation. (A) U87 cells were placed under hypoxia for a 72 hour time course. Cells were lysed and western blotted for FBW7 expression. Actin was used as a loading control. (B) Densitometry was performed on FBW7 and actin to determine the fold increase in expression. (C) U87 cells were transfected with control siRNA (siCon) and siRNA against FBW7 (siFBW7). Cells were placed under hypoxia for 48 hours and lysed. Lysate was western blotted for FBW7 and Mcl-1 levels and actin was used as a loading control. (D) The amount of cell death was determine by trypan blue exclusion assay where N=normoxia and H=hypoxia at 72 hours. * represents statistically significant differences between normoxia and hypoxia. Error bars represent standard error of 3 independent experiments.
EGFR increases Mcl-1 under hypoxia protecting against cell death
EGFR activation increases Mcl-1 expression and blocks hypoxia induced cell death.Citation6,8,17 We first treated HEK 293 cells with epidermal growth factor (EGF) for 24 hours under hypoxia. The amount of cell death was significantly reduced when EGF was present reducing cell death from 23% to 6% (). When cells were lysed and western blotted for Mcl-1, levels of Mcl-1 were elevated under hypoxia in the presence of EGF (). Next, EGFR expression was knocked down in U87 cells and the levels of Mcl-1 were determined. After 4 hours of hypoxia, both EGFR and Mcl-1 levels were increased but after EGFR was knocked down, Mc1–1 levels were reduced to normoxic levels (). The amount of cell death was significantly increased after the knockdown of EGFR in both normoxia and hypoxia (). EGFR activation was further inhibited with the EGFR tyrosine kinase inhibitor gefitinib.Citation18 Treatment of U87 cells with gefitinib reduced EGFR phosphorylation and Mcl-1 expression to normoxic levels (). Gefitinib treatment also significantly increased hypoxia induced cell death (). Taken together, EGFR regulates Mcl-1 expression and prevents hypoxia induced cell death.
Figure 5. EGFR activation increased Mcl-1 under hypoxia and protects against hypoxia induced cell death. (A) HEK293 cells were treated with EGF (1μg/ml) and placed under hypoxia for 48 hours. The amount of cell death was determined by trypan blue exclusion assay. Error bars represent standard error of 3 independent experiments. (B) Cells in the presence or absence of EGF were placed under hypoxia for 24 hours. The cells were lysed and western blotted for Mcl-1 expression. Actin was used as a loading control. (C) U87 cells were transfected with siRNA control (siCon) and siRNA against EGFR (siEGFR) and placed under hypoxia for 4 hours. The cells were lysed and western blotted for EGFR, tyrosine phosphorylated EGFR (Y1068) and Mcl-1. Actin was used as a loading control. (D) U87 cells were placed under hypoxia for 24 hours after transfection with siCon or siEGFR. Cell death was determined by trypan blue exclusion assay. Normoxia is represented by N and hypoxia is represented by H. (E) U87 cells were treated with gefitinib (40mM) and incubated for 4 hours under hypoxia. The cells were then lysed and western blotted for EGFR, tyrosine phosphorylated EGFR and Mcl-1 expression. Actin was a loading control. (F) Cell death was determine by trypan blue exclusion assay where N = nomoxia and H = hypoxia. Error bars represent standard error of 3 independent experiments. * represents statistically significant differences (p < 0.05).
Hypoxia induced cell death involves BNIP3 expression and is blocked by Mcl-1 expression
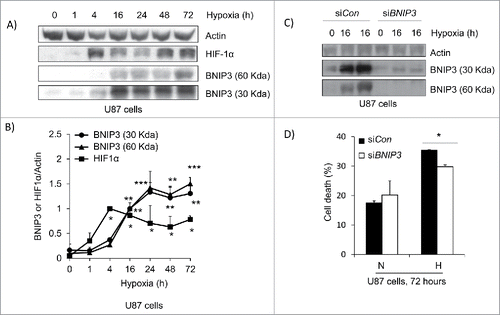
BNIP3 is overexpressed in GBM tumors but induces cell death when over-expressed in glioma cells.Citation19,20 To address this paradox, both astrocytes and mouse embryonic fibroblasts (MEFs) were isolated from mice lacking BNIP3 expression and placed under hypoxia. Western blotting confirmed the lack of expression of BNIP3 in the knockout cells compared to wild type under both normoxic and hypoxic conditions (). The amount of cell death under hypoxia was then determined over a 72 hour time course. In both astrocytes and MEFs, the lack of BNIP3 expression resulted in a delay in the amount of cell death under hypoxia (). In U87 cells, BNIP3 was shown to increase over a 72 hour time course of hypoxia corresponding to an increase in HIF-1α (). This was also similar to the western blot of BTIC-12 cells where BNIP3 expression was elevated after 96 hours (Fig. S1). BNIP3 was also knocked down using siRNA in U87 cells and the cells were placed under hypoxia. The amount of cell death in U87 cells was also significantly reduced after 72 hours of hypoxia ().
Figure 6. Astrocytes and murine embryonic fibroblasts lacking BNIP3 are resistant to hypoxia induced cell death. (A) Wild type and BNIP3 knockout astrocytes were placed under hypoxia for 24 hours. Cells were lysed and western blotted for BNIP3 expression. (B) Wild type and BNIP3 knockout murine embryonic fibroblasts (MEFs) cells were placed under hypoxia for a 48 hour time course. Cells were lysed and western blotted for BNIP3. Actin was used as a loading control. (C) MEF cells were placed under hypoxia for 24 hours. Cells were visualized under a phase contrast microscopy. MEF cells (D) and astrocytes (E) were placed under hypoxia for a 72 hour time course and the amount of cell death was determined by trypan blue exclusion assay. Error bars represent standard error of 3 independent experiments.
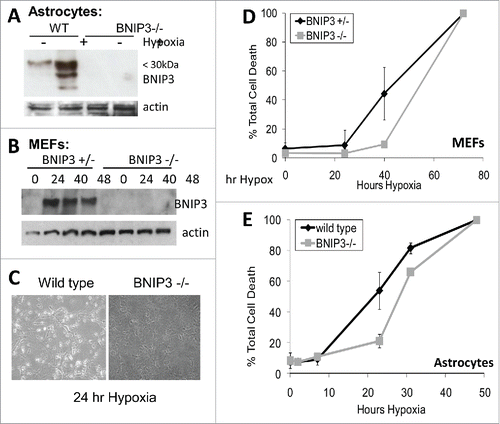
Figure 7. Knockdown of BNIP3 blocks hypoxia induced cell death. (A) U87 cells were placed under hypoxia for a 72 hour time course. The cells were lysed and western blotted for HIF-1α, and BNIP3. (B) Using densitometry, the fold increase in BNIP3 and HIF-1α was determined. (C) U87 cells were transfected by control siRNA (siCon) and siRNA against BNIP3 (siBNIP3). Cells were placed under hypoxia for 16 hours and lysed. The lysate was western blotted for BNIP3 and actin. (D) U87 cells transfected with siCon and siBNIP3 were placed under hypoxia for 72 hours. The amount of cell death was determined by trypan blue exclusion assay. Normoxia is represented by N and hypoxia is represented by H. * represents statistically significant differences (p < 0.05).
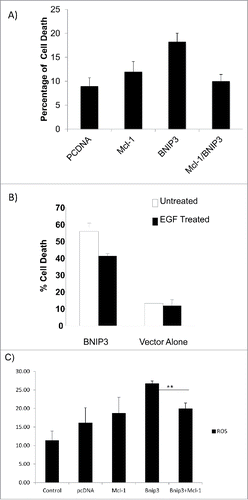
We then determined whether overexpression of Mcl-1 and BNIP3 would be sufficient to block BNIP3 induced cell death. We transfected HEK293 cells with expression vectors for BNIP3 and Mcl-1 (Fig. S2) and determined the amount of cell death. Cells expressing vector and Mcl-1 alone each had approximately 10% cell death whereas BNIP3 over-expressing cells had ∼18% cell death. When both BNIP3 and Mcl-1 were co-expressed, there was 10% cell death after 24 hours (). EGF has been shown to increase Mcl-1 and block hypoxia induced cell death.Citation6 We showed that EGF treatment of cells transfected with BNIP3 expression vector (BNIP3) reduced the ability of BNIP3 in induce cell death (). BNIP3 induces cell death in part by increased ROS production in cells.Citation10 We then determined the amount of reactive oxygen species (ROS) when BNIP3 and Mcl-1 were overexpressed. We found that BNIP3 increased ROS levels that were blocked by Mcl-1 over-expression (). This indicates that BNIP3 plays a role in hypoxia induced cell death that is blocked by Mcl-1 overexpression.
Figure 8. Mcl-1 blocks BNIP3 induced cell death and ROS production. (A) HEK293 cells were transfected with expression vectors for BNIP3 or Mcl-1. The percentage of cell death was determined by trypan blue exclusion assay. Error bars represent standard error. (B) Cells were transfected with expression vector for BNIP3 and treated with EGF. The percentage of cell death was determined by trypan blue exclusion assay. Error bars represent standard error. (C) HEK293 cells were transfected as above and levels of ROS production determined by flow cytometer. Error bars represent standard error. ** represents statistical significance between BNIP3 expression alone and in combination with Mcl-1 (p < 0.05).
Mcl-1 and BNIP3 co-localize in glioma cells
Since BNIP3 expression is elevated in GBM tumors,Citation21 the co-localization of Mcl-1 and BNIP3 in glioma cells, GBM tumors and xenografted tumors was investigated. In U373 cells, Mcl-1 and BNIP3 did not co-localize under normoxic conditions but under hypoxia Mcl-1 and BNIP3 were co-localized in a punctate pattern indicative of mitochondrial localization () This suggests that both BNIP3 and Mcl-1 are localized to the mitochondria since individually they were found localized to mitochondria under hypoxia (data not shown). We also confirmed this finding in U87 cells (Fig. S3).
Figure 9. Mcl-1 and BNIP3 colocalize in glioma cells, GBM tumors and EGFRvIII expressing tumors. (A) U373 cells were placed under hypoxia for 16 hours. Cells were immunostained for Mcl-1, and BNIP3 and DNA was stained with DAPI. Cells were visualized using a confocal microscope. (B) GBM tumors were histochemical stain for BNIP3 and Mcl-1. Staining without primary antibodies was used as negative control. Tumor 1 represents a GBM tumor with high expression for both Mcl-1 and BNIP3. Tumor 2 represents a GBM tumor with low expression for both Mcl-1 and BNIP3. * represents statistically significant differences (p < 0.05).
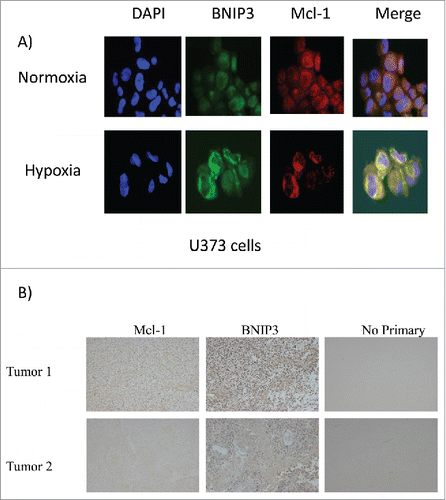
To confirm these results, we obtained GBM tumors from a cohort of 80 GBM patients.Citation22 We found that the tumors with high Mcl-1 were significantly correlated with tumors samples with high BNIP3 expression as determined by immunohistochemistry (, ).
Table 1. Expression levels for Mcl-1 and BNIP3 in GBM tumors
Discussion
Our results indicate that the decrease in Mcl-1 expression after 4 hours is mediated by increased expression of FBW7 under hypoxia. This reduction is concomitant with an increase in BNIP3 expression that contributes to hypoxia induced cell death. EGFR increases the levels of Mcl-1 expression at 4 hours in hypoxia, leading to increased cell survival, whereas using EGFR kinase inhibitors increases cell death. Finally, BNIP3 and Mcl-1 co-localized in glioma cell lines, GBM tumors and xenograft tumors under hypoxia. This suggests that Mcl-1 blocks BNIP3 induced cell death under hypoxia leading to increased BNIP3 expression in the hypoxic regions of tumors.
Mcl-1 is an anti-apoptotic member of the Bcl-2 protein family, which are involved in the mitochondrial-mediated intrinsic pathway of apoptosis.Citation4 Mcl-1 has a very short half-life, indicating that control of expression at both the transcriptional and translational levels is required.Citation4 At the transcriptional level, Mcl-1 is regulated by several transcription factors, including members of the STAT family and Elk-1.Citation4,6 Mcl-1 is also regulated at the translational level by several mechanisms controlling both caspase and proteasomal degradation.Citation4 Post-translational modifications, such as phosphorylation and ubiquitination also allow for tight regulation of Mcl-1 stability and degradation.Citation4 Under hypoxia, Mcl-1 protein levels are decreased. This has been observed by other researchers but the mechanism behind this degradation was unknown. Transcriptional levels for Mcl-1 remain unchanged during hypoxia suggesting Mcl-1 is actively being degraded. We found that the expression of the E3 ligase FBW7 increases under hypoxia and knockdown of FBW7 restores Mcl-1 levels in hypoxia. FBW7 has been shown to be important in the degradation of Mcl-1 through the ubiquitination/proteosome pathway.Citation22 FBW7 has also been shown to be involved in the degradation of HIF-1 Citation23 suggesting it plays a role in eliminating cell survival mechanisms under prolonged hypoxic conditions.
The evidence for the role of BNIP3 in hypoxia is contradictory. Several reports have shown that BNIP3 expression leads to mitophagy under hypoxia that allows damaged mitochondria to be removed from cells and increase cell survival under hypoxia.Citation24 High expression levels of BNIP3 associated with hypoxic regions of solid tumors correlated with lower overall survival of patientsbrain.Citation25 In contrast, over-expression of BNIP3 in glioma cell lines induces cell death and knockdown of BNIP3 renders cells more resistant to hypoxia induced cell death.Citation19 Using astrocytes and MEF cells lacking BNIP3 expression, we showed BNIP3 contributes to hypoxia induced cell death. Furthermore, BNIP3 expression is elevated at times when pro-survival proteins such as Mcl-1 are decreasing. This change in protein levels of BNIP3 and Mcl-1 correlates with cell death under hypoxia. This was also shown in ErbB2 expressing breast tumors where increased expression of both Mcl-1 and BNIP3 was associated with worse prognosis in these patients.Citation26 In addition, BNIP3 could also be localized to the nucleus of glioma cells and GBM tumors where it provides a cell survival function.Citation27 Taken together, this suggests that the paradoxical observation of elevated BNIP3 levels in tumors could be due to EGFR medicated elevated Mcl-1 expression preventing BNIP3 induced cell death.
Using gene expression-based molecular classification of GBM, 4 subtypes of GBM have emerged: classical, mesenchymal, pro-neural, and neural.Citation28 The classical subtype is associated with the gene expression pattern observed in astrocytes and characterized by aberrant EGFR expression. Other subtypes are characterized by PTEN deletions, PDGFR overexpression, mesenchymal markers, and neural markers. All these molecular subtypes demonstrate aggressive biological behavior of GBMs due, in part, to tumor hypoxia. As tumors outgrow their vasculature hypoxic areas swiftly develop.Citation29,30 This leads to resistance to radiation and chemotherapy due to lack of reactive oxygen species production and lack of effective drug delivery.Citation31,32 Tumor hypoxia also selects for gene mutations such as EGFRvIII thus driving the evolution of the cancer cells toward increasing malignancy.Citation33-35 We showed that Mcl-1 driven by EGFR could protect glioma cells from hypoxia induced cells in part by blocking the action of BNIP3. It is conceivable that other subtypes of GBM with PDGFR overexpression or deletion of PTEN could also prevent hypoxia induced cell death by altering Mcl-1 degradation under hypoxia. This is supported by various gene expression datasets showing Mcl-1 expression constantly upregulated in GBM tumors compared to normal brain (Fig. S4). The regulation of this increase in Mcl-1 expression in the context of molecular classifications of GBM remains to be determined.
In conclusion, we have demonstrated for first time that Mcl-1 degradation is regulated by FBW7 under hypoxia. Mcl-1 expression may partly explain why BNIP3 is expressed at high levels in viable cells within GBM tumors. It remains to be determined how to use the degradation of Mcl-1 in hypoxic regions as a therapeutic advantage in GBM tumors. One strategy could be combining BH3-mimetic therapy with kinase inhibitors to sensitize cells to hypoxia induced cell death. This will be the focus of future investigations.
Materials and Methods
Tissue culture
The glioblastoma cell lines U87, U251 and U373 were maintained as described previously.Citation21 The cells were grown in Gibco DMEM/F-12+GlutaMAXTM-1 media (Life Technologies) supplemented with 100 units of penicillin per mL plus 100 µg of streptomycin per mL (Life Technologies) and 5% fetal bovine serum in a humidified 5% CO2, 37°C incubator. HEK293 cells were maintained in DMEM supplemented with 10% bovine calf serum and 100 units of penicillin per mL plus 100 µg of streptomycin per mL. GBM Brain tumor initiating BTIC-12 cells were the kind gift of Dr. Samuel Weiss.Citation36 BTIC-12 was derived from a 59 y old male patient with recurrent GBM. These cells are MGMT unmetheylated, have wild type EGFR and p53 and their PTEN status is mutated with a frameshift and deletion of codon 328. Cells were grown in DMEM/F12 media (Life Technologies) with 5/ FBS to allow growth as a monolayer. Hypoxic treatment of cells has been described previously.Citation19 Briefly, old media was removed under normoxia and cells were put in a hypoxic chamber (<1% O2, 5%; CO2, 37°C) and then media pre-incubated in the hypoxic chamber for 5 d was added to the cells. Cells were then treated under hypoxia as described. When indicated, EGF (Sigma) was added to a final concentration of 1 μg/ml and the reversible EGFR inhibitor Gefitinib (LC laboratories) was added to a final concentration of 40 mM.
Transfection of small interfering RNA (siRNA) and plasmids
The transfection of cells with small interfering RNA (siRNA) was done as described in our previously studies (Santa Cruz). Transfections were done using Lipofectamine 2000 (Life Technologies) as per the manufacturer's instructions.
Measurement of cell death by flow cytometry
Cell death was measured using a trypan blue membrane integrity assay on the flow cytometer as previously described.Citation37 Briefly, trypan blue is excluded from live cells but penetrates dead cells giving a red fluorescent signal that can be quantified by flow cytometry.
Protein lysate preparation and western blotting
Whole cell protein lysates were prepared from cell lines using Nonidet-P40 (NP-40) buffer (20 mM Tris HCl pH 8, 137 mM NaCl, 10% glycerol, 1% nonidet P-40, 2 mM EDTA) supplemented with protease and phosphatase inhibitors (Roche Diagnostics, Mannheim, Germany). For western blots, equal amounts of protein were resolved using SDS/polyacrylamide gel electrophoresis. Afterwards, proteins were transferred onto a nitrocellulose membrane (Biorad) and blocked in Tris buffered saline containing 0.1% Tween-20 and 5% skim milk powder. Membranes were incubated with primary antibody overnight at 4°C and then washed with Tris-buffered saline-Tween 20. Afterwards, membranes were incubated with secondary antibody conjugated with horseradish peroxidase for 1–2 hours at room temperature. After incubation, proteins were visualized onto autoradiography film using enhanced chemiluminescence (Thermo Fisher Scientific, Waltham, MA, USA). Antibodies used for western blot were obtained from the following sources: Bcl-xL, EGFR, pEGFR (Cell Signaling); Mcl-1 (Santa Cruz); beta-Actin, BNIP3 (Sigma); FBW7 (Novus Biologicals); and HIF-1α (Becton Dickinson).
Isolation of astrocytes and embryonic fibroblasts from mice. Protocols were approved by the Bannatyne Campus animal care committee under the auspices if the Canadian Council of Animal Care. Mouse astrocytes were isolated as previously described.Citation21 Mice were obtained from Dr. Dorn, Washington University, St. Louis. Briefly, postnatal mice between P0 and P6 were sacrificed by decapitation. The cortex was removed and the tissue mechanically dissociated. DMEM/F12 media containing glutamine, penicillin/streptomycin and 10% fetal calf serum was added and the cells spun down. Supernatant was removed and the cells resuspended in DMEM/F12 media containing glutamine, penicillin/streptomycin and 10% fetal calf serum with 10ng/ml EGF and then transferred to a flask and incubated at 37°C. These cells were considered passage 0. All experiments were done within the first 5 passages. Mouse embryonic fibroblasts were derived from E12-E14 embryos and incubated in DMEM with 10% FBS. Experiments were performed within the first 8 passages.
Immunofluorescence
Cells were grown on coverslips for 24 hours and then placed in hypoxia for 24 hours before formaldehyde fixation. Immunofluorescence was done as previously described. Anti BNip3 (Sigma) was diluted 1:100 and anti Mcl-1 (Santa Cruz) was diluted 1:100. Signal was amplified using an anti-rabbit Biotinylated secondary antibody at 1:200 (Vector Laboratories) and the tertiary compound was streptavidin conjugated Alexa Fluor 488 (BNIP3) or 633 (Mcl-1). Incubation times in primary antibody were overnight for tissue sections and 2 hours for cultured cells. Images were captured on a FV500 laser scanning confocal microscope (Olympus).
Immunohistochemistry
Immunohistochemistry was done using the Vector Laboratories Vectastain Elite ABC kit and DAB peroxidase substrate kit according to the manufacturer's instructions. Antibodies were used at the following dilutions: Mcl-1 (Santa Cruz) 1:100, EGFR (Cell Signaling) 1:250, and Glut-1 (Millipore) 1:100. After dehydration, slides were mounted using Immunohistomount (Sigma). Images were captured on an Olympus BX51 microscope using Image Pro Plus software. Exposure times between samples were equivalent.
FFPE primary GBM tumor section slides from the Manitoba GBM patient cohort were obtained from the Department of Pathology, Health Sciences Centre in Winnipeg. Expression of BNIP3 and Mcl-1 was also assessed using immunohistochemistry (IHC). Cellular localization of BNIP3 was assessed using both immunofluorescence (IF) and IHC. Slides immunostained against BNIP3 were incubated with a biotinylated anti-rabbit secondary IgG antibody (1:200 dilution, Vector Laboratories Inc.) while slides immunostained against Mcl-1 were incubated with a biotinylated anti-mouse secondary IgG antibody (1:200 dilution, Vector Laboratories Inc.). They were then developed using the Elite ABC and DAB chromogenic substrate kits (Vector). Slide imaging was done using an inverted Nikon Eclipse TE2000-U microscope fitted with 2 digital CCD cameras (Nikon DS-Ri1 and DS-QiMc). Tumors were imaged at multiple fields, the exact number depending on the heterogeneity, and then scored as having none/low (0/+1) versus medium/high (+2/+3) expression. Two observers were blinded for all patient data when scoring protein expression.
Statistical analysis
All data was generated with at least 3 independent experiments. Each experiment in the cell death analysis included 3–6 replicates. The data was represented as the means ± SD (standard deviation) (n ≥ 3). The Student's t-test was performed for statistical analysis with p < 0.05 being considered statistically significant.
Disclosure of Potential Conflicts of Interest
No potential conflicts of interest were disclosed.
Supplemental Material
Supplemental data for this article can be accessed on the publisher's website.
Authors' Contributions
YC carried out the analysis of Mcl-1 and BNIP3 in glioma cell lines by Western blot, immunofluorescence and cell death assays and drafted a portion of the manuscript. TB conducted experiments in (). EH participated in the experiments requiring confocal microscopy. MA participated in the animal experiments and immunohistochemistry and western blotting of isolated tissue (). WX conducted co-localization experiments in (). MQ transfected BNIP3 and Mcl-1 in cell lines and conducted cell death and ROS production experiments. ES and DE conducted the GBM tumor histochemical staining and analysis. SG conceived of the study, wrote the manuscript and participated in its design and coordination. All authors read and approved the final manuscript.
Supplemental Figures 1-4
Download MS Power Point (443.9 KB)Acknowledgments
We would like to thank Niki Vegh for injecting the mice in the xenograft study. The BNIP3-null mouse model was kindly provided by Dr. Gerald Dorn (Washington University School of Medicine). Epsita Shome was funded by an Alberta Cancer Foundation summer studentship. This study is supported by the CancerCare Manitoba Foundation and the Brain Tumor Foundation of Canada. Dr. Spencer Gibson is the Margaret A. Sellers Chair in Cell Biology.
References
- Gurney JG, Kadan-Lottick N. Brain and other central nervous system tumors: rates, trends, and epidemiology. Curr Opin Oncol 2001; 13:160-6; PMID:11307058; http://dx.doi.org/10.1097/00001622-200105000-00005
- Chamberlain MC. Treatment options for glioblastoma. Neurosurg Focus 2006; 20:E2
- Louis DN, Ohgaki H, Wiestler OD, Cavenee WK, Burger PC, Jouvet A, Scheithauer BW, Kleihues P. The 2007 WHO classification of tumours of the central nervous system. Acta Neuropathol 2007; 114:97-109; PMID:17618441; http://dx.doi.org/10.1007/s00401-007-0243-4
- Akgul C. Mcl-1 is a potential therapeutic target in multiple types of cancer. Cell Mol Life Sci 2009; 66:1326-36; PMID:19099185; http://dx.doi.org/10.1007/s00018-008-8637-6
- Ding Q, He X, Xia W, Hsu JM, Chen CT, Li LY, Lee DF, Yang JY, Xie X, Liu JC, et al. Myeloid cell leukemia-1 inversely correlates with glycogen synthase kinase-3beta activity and associates with poor prognosis in human breast cancer. Cancer research 2007; 67:4564-71; PMID:17495324; http://dx.doi.org/10.1158/0008-5472.CAN-06-1788
- Booy EP, Henson ES, Gibson SB. Epidermal growth factor regulates Mcl-1 expression through the MAPK-Elk-1 signalling pathway contributing to cell survival in breast cancer. Oncogene 2011; 30:2367-78; PMID:21258408; http://dx.doi.org/10.1038/onc.2010.616
- Henson ES, Hu X, Gibson SB. Herceptin sensitizes ErbB2-overexpressing cells to apoptosis by reducing antiapoptotic Mcl-1 expression. Clin Cancer Res 2006; 12:845-53; PMID:16467098; http://dx.doi.org/10.1158/1078-0432.CCR-05-0754
- Perciavalle RM, Opferman JT. Delving deeper: MCL-1's contributions to normal and cancer biology. Trends Cell Biol 2013; 23:22-9; PMID:23026029; http://dx.doi.org/10.1016/j.tcb.2012.08.011
- He L, Torres-Lockhart K, Forster N, Ramakrishnan S, Greninger P, Garnett MJ, McDermott U, Rothenberg SM, Benes CH, Ellisen LW. Mcl-1 and FBW7 control a dominant survival pathway underlying HDAC and Bcl-2 inhibitor synergy in squamous cell carcinoma. Cancer Dis 2013; 3:324-37; PMID:23274910; http://dx.doi.org/10.1158/2159-8290.CD-12-0417
- Vande Velde C, Cizeau J, Dubik D, Alimonti J, Brown T, Israels S, Hakem R, Greenberg AH. BNIP3 and genetic control of necrosis-like cell death through the mitochondrial permeability transition pore. Mol Cell Biol 2000; 20:5454-68; PMID:10891486; http://dx.doi.org/10.1128/MCB.20.15.5454-5468.2000
- Kim JY, Cho JJ, Ha J, Park JH. The carboxy terminal C-tail of BNip3 is crucial in induction of mitochondrial permeability transition in isolated mitochondria. Arch Biochem Biophys 2002; 398:147-52; PMID:11831844; http://dx.doi.org/10.1006/abbi.2001.2673
- Kothari S, Cizeau J, McMillan-Ward E, Israels SJ, Bailes M, Ens K, Kirshenbaum LA, Gibson SB. BNIP3 plays a role in hypoxic cell death in human epithelial cells that is inhibited by growth factors EGF and IGF. Oncogene 2003; 22:4734-44; PMID:12879018; http://dx.doi.org/10.1038/sj.onc.1206666
- Bruick RK. Expression of the gene encoding the proapoptotic Nip3 protein is induced by hypoxia. Proc Natl Acad Sci U S A 2000; 97:9082-7; PMID:10922063; http://dx.doi.org/10.1073/pnas.97.16.9082
- Bacon AL, Harris AL. Hypoxia-inducible factors and hypoxic cell death in tumour physiology. Ann Med 2004; 36:530-9; PMID:15513303; http://dx.doi.org/10.1080/07853890410018231
- Sowter HM, Ratcliffe PJ, Watson P, Greenberg AH, Harris AL. HIF-1-dependent regulation of hypoxic induction of the cell death factors BNIP3 and NIX in human tumors. Cancer Res 2001; 61:6669-73; PMID:11559532
- Huelsemann MF, Patz M, Beckmann L, Brinkmann K, Otto T, Fandrey J, Becker HJ, Theurich S, von Bergwelt-Baildon M, Pallasch CP, et al. Hypoxia-induced p38 MAPK activation reduces Mcl-1 expression and facilitates sensitivity towards BH3 mimetics in chronic lymphocytic leukemia. Leukemia 2014; 29:981-984; PMID:25376373
- Brunelle JK, Shroff EH, Perlman H, Strasser A, Moraes CT, Flavell RA, Danial NN, Keith B, Thompson CB, Chandel NS. Loss of Mcl-1 protein and inhibition of electron transport chain together induce anoxic cell death. Mol Cell Biol 2007; 27:1222-35; PMID:17145774; http://dx.doi.org/10.1128/MCB.01535-06
- Berezowska S, Schlegel J. Targeting ErbB Receptors in High-Grade Glioma. Curr Pharm Des 2011; 17(23):2468-87; PMID:21827413
- Azad MB, Chen Y, Henson ES, Cizeau J, McMillan-Ward E, Israels SJ, Gibson SB. Hypoxia induces autophagic cell death in apoptosis-competent cells through a mechanism involving BNIP3. Autophagy 2008; 4:195-204; PMID:18059169; http://dx.doi.org/10.4161/auto.5278
- Bristow N, Burton TR, Henson ES, Ong-Justiniano C, Brown M, Gibson SB. Truncated forms of BNIP3 act as dominant negatives inhibiting hypoxia-induced cell death. Biochimica et biophysica acta 2011; 1812:302-11; PMID:21138765; http://dx.doi.org/10.1016/j.bbadis.2010.11.013
- Burton TR, Eisenstat DD, Gibson SB. BNIP3 (Bcl-2 19 kDa interacting protein) acts as transcriptional repressor of apoptosis-inducing factor expression preventing cell death in human malignant gliomas. J Neurosci 2009; 29:4189-99; PMID:19339613; http://dx.doi.org/10.1523/JNEUROSCI.5747-08.2009
- Pitz MW, Lipson M, Hosseini B, Lambert P, Guilbert K, Lister D, Schroeder G, Jones K, Mihalicioiu C, Eisenstat DD. Extended adjuvant temozolomide with cis-retinoic acid for adult glioblastoma. Curr Oncol 2012; 19:308-14; PMID:23300356; http://dx.doi.org/10.3747/co.19.1151
- Cassavaugh JM, Hale SA, Wellman TL, Howe AK, Wong C, Lounsbury KM. Negative regulation of HIF-1alpha by an FBW7-mediated degradation pathway during hypoxia. J Cell Biochem 2011; 112:3882-90; PMID:21964756; http://dx.doi.org/10.1002/jcb.23321
- Thomas RL, Kubli DA, Gustafsson AB. Bnip3-mediated defects in oxidative phosphorylation promote mitophagy. Autophagy 2011; 7:775-7; PMID:21460627; http://dx.doi.org/10.4161/auto.7.7.15536
- Giatromanolaki A, Koukourakis MI, Sowter HM, Sivridis E, Gibson S, Gatter KC, Harris AL. BNIP3 expression is linked with hypoxia-regulated protein expression and with poor prognosis in non-small cell lung cancer. Clin Cancer Res 2004; 10:5566-71; PMID:15328198; http://dx.doi.org/10.1158/1078-0432.CCR-04-0076
- Petry IB, Fieber E, Schmidt M, Gehrmann M, Gebhard S, Hermes M, Schormann W, Selinski S, Freis E, Schwender H, et al. ERBB2 induces an antiapoptotic expression pattern of Bcl-2 family members in node-negative breast cancer. Clin Cancer Res 2010; 16:451-60; PMID:20068093; http://dx.doi.org/10.1158/1078-0432.CCR-09-1617
- Burton TR, Henson ES, Baijal P, Eisenstat DD, Gibson SB. The pro-cell death Bcl-2 family member, BNIP3, is localized to the nucleus of human glial cells: Implications for glioblastoma multiforme tumor cell survival under hypoxia. Int J Cancer 2006; 118:1660-9; PMID:16217754; http://dx.doi.org/10.1002/ijc.21547
- Brennan CW, Verhaak RG, McKenna A, Campos B, Noushmehr H, Salama SR, Zheng S, Chakravarty D, Sanborn JZ, Berman SH, et al. The somatic genomic landscape of glioblastoma. Cell 2013; 155:462-77; PMID:24120142; http://dx.doi.org/10.1016/j.cell.2013.09.034
- Kayama T, Yoshimoto T, Fujimoto S, Sakurai Y. Intratumoral oxygen pressure in malignant brain tumor. J Neurosurg 1991; 74:55-9; PMID:1984507; http://dx.doi.org/10.3171/jns.1991.74.1.0055
- Sharp FR, Bergeron M, Bernaudin M. Hypoxia-inducible factor in brain. Adv Exp Med Biol 2001; 502:273-91; PMID:11950144; http://dx.doi.org/10.1007/978-1-4757-3401-0_18
- Sannazzari GL, Ricardi U, Filippi AR. Hypoxia and tumor response to irradiation. Rays 2002; 27:175-9; PMID:12696246
- Stupp R, Mason WP, van den Bent MJ, Weller M, Fisher B, Taphoorn MJ, Belanger K, Brandes AA, Marosi C, Bogdahn U, et al. Radiotherapy plus concomitant and adjuvant temozolomide for glioblastoma. N Engl J Med 2005; 352:987-96; PMID:15758009; http://dx.doi.org/10.1056/NEJMoa043330
- Barker FG, 2nd, Simmons ML, Chang SM, Prados MD, Larson DA, Sneed PK, Wara WM, Berger MS, Chen P, Israel MA, et al. EGFR overexpression and radiation response in glioblastoma multiforme. Int J Radiat Oncol Biol Phys 2001; 51:410-8; PMID:11567815; http://dx.doi.org/10.1016/S0360-3016(01)01609-1
- Kleihues P, Ohgaki H. Phenotype vs genotype in the evolution of astrocytic brain tumors. Toxicol Pathol 2000; 28:164-70; PMID:10669004; http://dx.doi.org/10.1177/019262330002800121
- Yu JL, Rak JW, Coomber BL, Hicklin DJ, Kerbel RS. Effect of p53 status on tumor response to antiangiogenic therapy. Science 2002; 295:1526-8; PMID:11859195; http://dx.doi.org/10.1126/science.1068327
- Kelly JJ, Stechishin O, Chojnacki A, Lun X, Sun B, Senger DL, Forsyth P, Auer RN, Dunn JF, Cairncross JG, et al. Proliferation of human glioblastoma stem cells occurs independently of exogenous mitogens. Stem cells 2009; 27:1722-33; PMID:19544433; http://dx.doi.org/10.1002/stem.98
- Chen Y, Azad MB, Gibson SB. Superoxide is the major reactive oxygen species regulating autophagy. Cell Death Differ 2009; 16:1040-52; PMID:19407826; http://dx.doi.org/10.1038/cdd.2009.49