
 ?Mathematical formulae have been encoded as MathML and are displayed in this HTML version using MathJax in order to improve their display. Uncheck the box to turn MathJax off. This feature requires Javascript. Click on a formula to zoom.
ABSTRACT
Oncogenic mutations in BRAF are common in melanoma and thyroid carcinoma and drive constitutive activation of the MAPK pathway. Molecularly targeted therapies of this pathway improves survival compared to chemotherapy; however, responses tend to be short-lived as resistance invariably occursCell line models of melanoma and thyroid carcinoma, +/− BRAFV600E activating mutation, were treated with the MEK inhibitor PD0325901. Treated and naive samples were assayed for expression of key members of the MAPK pathway. Global microRNA expression profiling of naive and resistant cells was performed via next generation sequencingand indicated pluripotency pathways in resistance. Parental cell lines were progressed to holoclones to confirm the miRNA stemness profileMembers of the MIR302/373/374/520 family of embryonic stem cell specific cell cycle regulating (ESCC) microRNAs were identified as differentially expressed between resistant BRAFV600E melanoma and thyroid cell lines. Upregulated expression of gene and protein stemness markers, upregulated expression of MAPK pathway genes and downregulation of the ESCC MIR302 cluster in BRAFV600E melanoma indicated an increased stem-like phenotype in resistant BRAFV600E melanoma. Conversely, downregulated expression of gene and protein stemness markers, downregulated expression of MAPK pathway genes, upregulation of the ESCC MIR520 cluster, reeexpression of cell surface receptors, and induced differentiation-associated morphology in resistant BRAFV600E indicate a differentiated phenotype associated with MEK inhibitor resistance in BRAFV600E thyroid cellsThe differential patterns of resistance observed between BRAFV600E melanoma and thyroid cell lines may reflect tissue type or de novo differentiation, but could have significant impact on the response of primary and metastatic cells to MEK inhibitor treatment. This study provides a basis for the investigation of the cellular differentiation/self-renewal access and its role in resistance to MEK inhibition.
Abbreviations
| ESCC | = | Embryonic Stem cell specific Cell Cycle regulating |
| SMKI | = | Small Molecule Kinase Inhibitors |
| BRIM-3 | = | BRAF in melanoma phase 3 study |
| SNP | = | Single Nucleotide Polymorphism |
| LSCM | = | Laser Scanning Confocal Microscope |
| SAET | = | SOLiD Accuracy Enhancement Tool |
| GO | = | Gene Ontology |
| ECM | = | extracellular matrix ECM |
| CSC | = | Cancer stem cells |
| iPS | = | induced Pluripotent Stem cell |
Introduction
BRAF mutated tumors have been correlated with poor response to traditional chemotherapy and poor prognosis in malignant melanoma and thyroid carcinoma.Citation1,2 Targeted therapies are of great interest for these cancer types as the approach of targeting oncogenic kinases has been successful in the treatment of cancers with activating mutations in the kinase gene that drives their progression.Citation3 BRAFV600E mutated cancers display an oncogenic addiction to the MAPK pathway. There are an estimated 518 kinases encoded in the human genome. Phosphotransfer cascades mediated by kinases are involved in virtually every signal transduction process. This suggests that inhibition of kinase cascades should elicit a real physiological response. As such, small molecule kinase inhibitors (SMKI) are being intensely pursued for the treatment of cancer and many other diseases.
Molecular targeting of BRAFV600E, as exemplified by the BRAFV600E SMKI PLX-4032, has displayed some success for the treatment of malignant melanoma. The landmark BRAF in melanoma phase 3 study (BRIM-3) randomized 675 untreated malignant melanoma patients to either PLX-4032 (Vemurafenib, Plexxicon/Roche) or the standard of care, dacarbazine. The study was terminated early due to an obvious overall survival benefit with PLX-4032 treatment.Citation4 The overall response rate for PLX-4032 was 48% compared with a 5% response rate for dacarbazine. Although this is an excellent response for malignant melanoma, the median progression free survival is approximately 7 months because drug resistant invariably occurs and patients relapse.
PLX-4032 is an elegant example of both the promise of SMKI and the challenge of resistance to targeted therapeutics. Multiple mechanisms of resistance to SMKI-BRAF have been identified including: acquisition of secondary mutations such as NRASQ61K Citation5; upregulation or activation of alternative RAF isoforms Citation6; splice variants of BRAF such as BRAFp61, an inhibitor refractory BRAF truncation Citation7; and increased COT expression that drives resistance via reactivation of the pathway.Citation8 COT reactivates the pathway primarily through MEK- dependent mechanisms that do not require RAF signaling. Additionally, COT expression is associated with de novo resistance in BRAFV600E cultured cell lines and has been implicated in acquired resistance in clinical melanoma cells and tissue obtained from relapsing patients following treatment with BRAF inhibitors.Citation8
As reviewed by Smalley,Citation9 targeting BRAF can lead to pathway reactivation under certain genetic conditions. Thus, it may be of greater benefit to target downstream in the BRAF pathway. Due to the strategic position of the MEK 1/2 kinases in the MAPK pathway it is a very promising target for drug development. Preclinical trials have demonstrated that small molecule MEK 1/2 kinase inhibitors can significantly reduce the proliferation of a variety of cancer cell lines via the induction of apoptosis and cell cycle arrest.Citation10 Thus MEK appears to be a logical target for targeted therapy and is being investigated as a potential therapy for BRAFV600E cancers, both as a single agent and in combination with BRAF-inhibition.Citation9,11-14 Evidence from recent phase III clinical trials of combination MEK and BRAF inhibitors indicates an improvement in progression-free survival by the addition of the MEK inhibitor.Citation15,16
MiRNAs are crucial regulators of gene expression that function by binding their mRNA targets and promoting their degradation or translational repression. The human genome is believed to encode approximately 1,000 miRNAs compared to an estimated 30,000 mRNAs.Citation17 A single miRNA can regulate hundreds of mRNAs and thus have extensive effects on gene expression networks. Variation in the expression of hundreds of mRNA can be captured in the expression patterns of a few miRNAs that regulate them. Profiling of miRNAs can therefore be particularly rich in biological information.
The overall aim of this study was to investigate mechanisms of resistance to MEK inhibitors in cells initially sensitive to treatment, and to identify if these mechanisms are associated with BRAF mutational status. Human cell lines naïve or resistant to MEK inhibitor treatment were analyzed for relative expression of key markers of the MAPK pathway (MEK1/2; ERK1/2: ELK1). Naïve and treated samples were then analyzed via next generation sequencing (SOLiD™ 4 Platform, Applied Biosystems, USA) to detect global expression profiles of miRNAs. Bioinformatic analyses were performed to identify validated gene targets of miRNAs displaying statistically significant differential regulation between naïve and treated samples. Integrative bioinformatic analyses of miRNAs in the context of gene regulatory networksidentified the pluripotency pathway's association with MEK resistance. To validate the stemness microRNA profile, parental cell lines were induced to form holoclones as previously described Citation18 and the microRNAome profiled via next generation sequencing. Key stemness and adhesion markers were assayed in treated and naïve samples to confirm the association with the pluripotency pathway and MEK inhibition.
Materials and methods
Cell lines
The cutaneous malignant melanoma cell lines SK-MEL-28 and SK-MEL-31 (ATCC number HTB-72 and HTB-73) and the acral malignant melanoma cell line SK-Mel-2 (HTB-68) were obtained from the American Tissue Culture Collection (ATCC). The Nthy-ori 3-1 normal adult thyroid tissue transfected with the SV40 large T gene (ECACC number 90011609) and the undifferentiated thyroid carcinoma 8505C thyroid cell line (ECACC number 94090184) were obtained from European Collection of Cell Culture (ECACC).
Maintenance of cell lines
For SK-Mel-28, SK-Mel-2 and 8505C cell lines were maintained in Eagle's Minimum Essential Medium (EMEM) made to complete growth medium by the addition of fetal bovine serum (FBS) to a final concentration of 10% (cEMEM). For SK-Mel-31 the EMEM was made complete with the addition of 15% FBS (cEMEMPLUS). For Nthy-Ori 3-1, the base medium was RPMI-1640 made to complete growth medium by the addition of 10% FBS. All media was supplemented with penicillin-streptomycin at 100units/100mg per ml.
Holoclone derivation using high-salt agar
Holoclones were enduced as previously described.Citation18 Briefly, a 1% molecular grade agarose and 1% NaCl solution was prepared in dH2O and added to hish adherance petri dishes. Once the plates had set, 20 mls of the appropriate media was added as a feeder layer. Feeder layers were seeded with a total of 1×10⁶ cells and incubated at 37°C with 5% CO2. Media was changed every 5 days and spheroids developed embedded in agarose. Average holoclone development was 4 weeks.
Cell proliferation assays (MTT™ assay)
In a 96-well flat-bottomed tissue culture plate100µl/well of cells adjusted to the desired seeding density was added, using 4 technical replicates per sample. A blank standard containing media only was included to measure background. Plates were incubated for 24 hours at 37°C with 5% CO2. MTT labeling reagent (Roche) was added and incubated for 4 hours at 37°C with 5% CO2. MTT Solubilisation Solution (Roche) was added and incubated overnight at 37°C with 5% CO2. The plate was analyzed spectrometrically in an endpoint assay with the test filter wave length set to 570 nm and the reference filter set to a wavelength of 650 nm.
Generation of drug dosage response curves (MTT™ assay)
The MTT assay was employed to create drug dosage curves. Assays were seeded at a predetermined density. The MEK inhibitor PD0325901 (Pfizer) was dissolved in DMSO to 10 mM and stored at −20°C. Serial dilutions of the drug in media were prepared and 100 µl/well added. The assay was then performed in the same manner as above with varying incubation periods (24, 48, 72 or 96 hours) prior to addition of the labeling reagent.).
Nucleic acid preparation and RT-PCR
Macherey Nagel NucleoSpin Tissue Mini Kit™ and the NucleoSpin™ miRNA extraction kit was used for gDNA and RNA extraction respectively, as per manufacturers' supplied protocols. Nucleic acids were quantitated fluorometrically via Quant-iT Broad Range DNA and RNA assays on a Qubit fluorometer. The High Capacity cDNA Reverse Transcription Kit (Applied Biosystems) was used to convert total RNA to single stranded cDNA using 100ng RNA per sample. Predesigned RT-PCR TaqMan® assays GAPDH (Hs03929097_g1), MAP2K1/MEK1 (Hs00983247_g1), MAP2K2/MEK2 (Hs00360961_m1), MAPK3/ERK1 (Hs00385075_m1), MAPK1/ERK2 (Hs01046830_m1), ELK1 (Hs00901849_g1), POU5F1/OCT4A (Hs00999632_g1), NANOG (Hs02387400_g1), ALDH1A1 (Hs00946916_m1), CTNNB1/β-catenin (Hs00355049_m1), CDH1/E-cadherin (Hs01023894_m1) and TSHR (Hs01053846_m1) were performed in 20µl using 1-2µl cDNA template per reaction. All samples were assayed in triplicate on a 7500HT Fast RT-PCR instrument (Applied Biosystems) using a standard ramp rate.
A 40X custom BRAFT1799A TaqMan® SNP Genotyping Assay (5′ CAT GAA GAC CTC ACA GTA AAA ATA GGT GAT 3′ [BRAF-F], 5′ GGA TCC AGA CAA CTG TTC AAA CTG A 3′ [BRAF-R], VIC-5′ CCA TCG AGA TTT CAC TGT AG 3′ [BRAF-PWT], and FAM-5′ CCA TCG AGA TTT CTC TGT AG 3′ [BRAF-PMUT]) was employed as previously described.Citation19 A post-read allelic discrimination assay was run and alleles were autocalled on the 7900 Prism software using a 95% confidence interval.
Western blot analysis
Cell pellets were lysed directly into SDS-PAGE sample buffer (TRIS-HCL pH6.8 50mM, 10% glycerol, 2% SDS, 0.001% bromophenol blue and 100mM dithiothreitol (DTT)). SDS-PAGE and western blotting was performed as previously described.Citation20 Antibodies used were as follows: AbCam anti-PhosphoERK 1/2 (Ab50011) and anti-NANOG (Ab21624); Sigma anti-ALDH1A1 (HPA002123) and anti-ACTIN (A2066); Cell Signal Technology anti-POU5F1 (C52G3), HRP-Anti-Rabbit IgG (7074S) and HRP-Anti-Mouse (IgG7076S).
ImageJ software ( rsbweb.nih.gov/ij/download.html) was used to measure the intensity of bands within Western Blot autoradiographs. Band intensity was measured for target proteins and positive control (actin) and relative density of peaks were calculated by normalization to the actin control. Confocal Microscopy.
Cells were grown and treated in Lab-Tek™ 8-well chamber slides (Nunc), fixed in 4% paraformaldehyde solution (150µl/well) and permeabilised with 0.5% Triton X solution. Actin was stained with Phalloidin-TRITC (Sigma) and primary antibodies were diluted as per manufacturer's recommendation in 1% BSA blocking buffer. Secondary antibodies conjugated to fluorescent probes were diluted in 1% BSA blocking buffer. Fluroshield™ with DAPI (Sigma) was added to each slide and a coverslip (#1.5) was added and sealed with a clear nail varnish top coat. Slides were mounted, inverted, onto a Zeiss 510 Meta Laser Scanning Confocal Microscope (LSCM). Images were captured at x63 magnification and ×1 zoom. Scans were performed at 1 µm interval depths through the fixed cells, and single or merged images are presented either as XY single planes. Antibodies used were as follows: AbCam anti-PhosphoERK 1/2 (Ab50011), anti-Total ERK1/2 (Ab17942), anti-TSHR (Ab6044), Dylight-549 goat anti-mouse IgG (Ab96880), and Invitrogen Alexa-488 goat anti-rabbit IgG (A11008).
Next generation sequencing of small RNAs
Using the SOLiD 4 NGS Platform (Life Technologies), 35 base-pair barcoded short sequence reads were generated from the small RNA fraction of naive and resistant samples. Barcoded libraries were prepared using the Small RNA library reagents and protocol for the Applied Biosystems SOLiD™4 System (Life Technologies). Libraries were quantitated using the Quantitative RT-PCR using the SOLiD™ Library TaqMan® Quantitation kit (Life Technologies) then diluted to 500pM in 1X TE buffer and prepared onto templated beads using reagents and protocol from the manufacturer (Applied Biosystems SOLiD™4 System Templated Bead Preparation Guide). Multiplex fragment sequencing was performed according to the Applied Biosystems SOLiD 4 System Instrument Operation Guide and using the Applied Biosystems SOLiD 4 reagents (Life Technologies) with barcode tag (BC Tag MM10) primers initially, followed by fragment library 35bp read (F3 tag MM35) primers.
The SOLiD sequencing base-call accuracy was verified and enhanced using ABI's proprietary SOLiD Accuracy Enhancement Tool (SAET). Read-mapping was performed using the SHRiMP alignment package. Reads from each input sample were first mapped against sources of potential contamination, to filter out fragments of unwanted RNA species, mitochondrial DNA, and adapter sequences. The remaining reads were then mapped against the collection of human non-coding RNA species, downloaded from ENSEMBL (http://www.ensembl.org/info/data/ftp/index.html).
Gene counting was performed using HTSeq to calculate the number of aligned reads that map to certain genomic features, i.e. a set of genes, and presented values as raw gene counts.Citation21 The list of genes and their corresponding genomic locations was obtained in GTF format from ENSEMBL.
Analysis of NGS data
As there is variability in the amount of total reads between samples, annotated reads were normalized to allow analysis of differential expression across samples.Citation22
MiRNAs shared between resistant and naïve samples were analyzed for each cell line. To increase stringency, any miRNA with ≤3 reads were excluded and the relative fold change of resistant samples was calculated as follows:
A highly statistically significant relative fold change of (+/−) 10-fold was analyzed further. MiRNAs uniquely identified in either treated or naïve samples were considered significant if >10 reads were identified. MiRWalk: The database on predicted and validated microRNA targets Citation23 was used to identify validated mRNA targets of statistically significant miRNAs associated with naïve and resistant samples for each cell line. GOStat was used to identify gene ontology terms significantly associated with the mRNA targets.Citation24
Statistical analysis
Paired samples were assayed by means of a 2-tailed paired Student's T-test. Drug dosage curves used a 95% prediction interval. Allelic discrimination SNP genotyping assays were autocalled using Applied Biosystems software with a 95% confidence interval. Gene expression fold-differences between naïve and treated samples were considered significant with a normalized fold-change of +/− 2 (+/− standard error). For GoStat, a threshold of p < 0.01 was employed.
Results
Custom BRAFT1799A SNP assay confirms BRAF mutational status in cell lines
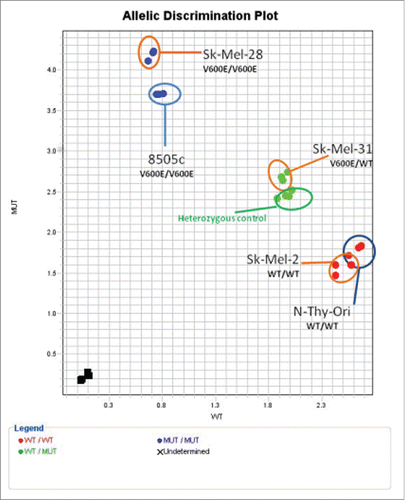
A custom BRAFT1799A SNP TaqMan® assay identified mutational status and allelic discrimination of BRAF mutants in cell lines. Using a 95% confidence interval, all cell lines were confirmed as carrying BRAFT1799A as follows: Thyroid- 8505C homozygous mutant and NThy-Ori homozygous wild-type; Melanoma- SK-MEL-28 homozygous mutant, SK-MEL-31 heterozygous, and SK-MEL-2 homozygous wild-type ().
Figure 1. BRAFT1799A. status of cell lines. Allelic discrimination plot for BRAFT1799A SNP. All samples were auto-called for BRAF status (95% Confidence Interval). X-axis: wild type allele; Y-axis: mutant allele.
Optimisation of MEK inhibition assays
An 8-step dilution of cells ranging from 3× 10⁶/ml to 1× 10³/ml was seeded for 24 hrs. The appropriate seeding density to enable both cytostatic and cytotoxic effects be accounted for downstream was determined to be 1×10⁵ cells/ml for each thyroid cell line and 5×10⁴ cells/ml for each melanoma cell line. These seeding densities were used for all subsequent experiments.
A 12-step 1/5 serial dilution in media of PD0325901 dosage from 2.5mM to 51.2pM was performed to assay for the optimal IC50 PD0325901 dosage per cell line. PD0325901 is soluble in DMSO. As per recommended protocol and consistent with previous studies a stock concentration of PD0325901 was prepared at 10mM in DMSO and stored at −20°C.Citation7,10,25-27 For the serial dilutions, stock concentrations were diluted in media. As DMSO is in itself toxic to cells, a control was included for all assays to ensure the observed drug effect was not due to DMSO toxicity. The DMSO vehicle control was toxic at the first two dosages (equivalent to 25% and 5% DMSO), which was consistent across all cell lines. However, these dosage points were much higher than the IC50s for all cell lines and the remaining range of DMSO dilutions were clearly distinct from the PD0325901 treated cells. Student's paired T-Tests confirm that the effect on cell proliferation is due to PD0325901 treatment and not an artifact of the vehicle control (P < 0.05 for all cell lines, ). PD0325901 treatment was found to have cytotoxic effects independent from the vehicle control for all cell lines (paired Student's T-Test, statistical significance p < 0.05; ). Serial dilutions were exposed to cells for 24, 48, 72 or 96 hours. All assays included media-only positive controls which were used to normalize data (Avg OD test/Avg OD positive control). Optimal conditions for each cell line are summarized in .
Table 1 Optimised Experimental protocols for PD0325901 MEKi Treatment.
Gene expression of key members of the MAPK pathway are differentially expressed in BRAFV600E/V600E MEKi-resistant cells
BRAFV600E and BRAFWT cell lines (8505C, NThy-Ori 3-1, SK-MEL-28, SK-MEL-31, SK-MEL-2) were treated under optimised conditions (). Cells surviving MEKi treatment (resistant) and cells treated with media-alone (naïve) were harvested for total RNA and analyzed for relative gene expression of the MAPK pathway members MAP2K1 (MEK1), MAP2K2 (MEK2), MAPK3 (ERK1), MAPK1 (ERK2) and ELK1. Relative gene expression of MEKi resistant cells were normalized to their paired media-only naïve controls ().
Figure 2. MEKi resistance induces differential gene expression of key members of the MAPK Pathway in BRAFV600E cancer. Cells treated with PD0325901 (resistant) or media-alone (naïve) were analyzed for gene expression. Fold change (RQ) expression in resistant samples was normalized to RQ of paired naïve samples and averaged across biological replicates. Statistical significance (*). Error bars: SEM. X-axis: Cell Line; Y-axis: Log2 (Avg RQ Resistant/RQ Naïve) Confocal analysis for tERK1/2 detects no change between Naïve and Resistant 8505C or NThy-Ori samples. pERK1/2 can be detected in all 3 layers of the cell in naïve samples whereas it is only detected in the apical and midsection in MEKi resistant 8505C samples. Conversely in NThy-Ori: pERK1/2 is only detected in the apical and midsection in naïve samples whereas pERK1/2 can be detected in all 3 layers in MEKi resistant samples. Red staining pERK1/2, green staining total ERK1/2, blue staining nuclear (DAPI).
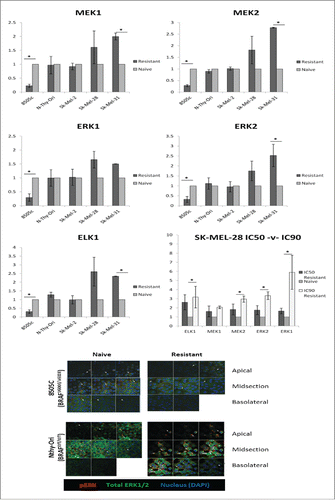
MEKi resistance did not induce significant differential expression in BRAFWT/WT in either thyroid or melanoma cell lines. BRAFV600E/V600E thyroid cell line 8505C resistant cells had statistically significant downregulated expression of MAPK pathway members in both the optimised and sustained treatments. BRAFV600E/WT melanoma SK-MEL-31 resistant samples displayed statistically significant upregulated gene expression in all genes except MAPK3.
BRAFV600E/V600E melanoma SK-MEL-28 resistant samples displayed a trend of upregulated gene expression, however this failed to reach statistical significance. The IC50 for 8505C was 126.7µM compared to just 1.28nM for SK-MEL-28. To investigate if the difference in gene expression patterns witnessed in MEKi resistant cells was due to this magnitude difference, experiments were repeated in SK-MEL-28 cells using the IC90 dosage (153.9µM, R-Sq 85%) and matched naïve samples. The IC90 treated cells followed the same trend as the IC50 treated SK-MEL-28 cells, reaching statistical significance for all genes except MAPK1/MEK1. Thus, altered gene expression pattern between BRAFV600E/V600E thyroid (8505C) and melanoma (SK-MEL-28) cell lines is not due to additional drug burden caused by magnitude IC50 differences.
pERK1/2 localizes to different areas of the cell following MEKi resistance in thyroid cell lines
Confocal analysis was used to detect total ERK1/2 (tERK1/2) and pERK1/2 in the thyroid cell lines. Confocal settings such as intensity and gain were optimised and samples were imaged using identical settings. No difference between resistant and naïve samples was observed for tERK1/2. However, pERK1/2 polarized differently in the cell in resistant samples (). Furthermore, the opposite polarization was induced dependent upon BRAF status. In 8505C naïve cells, pERK1/2 was present in all three layers of the cell (apical, midsection and basolateral), however, in resistant samples pERK1/2 staining was no longer present in the basolateral layer. Conversely, in NThy-Ori naïve cells pERK1/2 staining was evident in apical and midsections but not in the basolateral layer; however, in resistant samples, pERK1/2 staining was detected in all three layers.
Differential miRNA expression profiling indicates pluripotency as a mechanism of resistance to MEK inhibition
Global miRNA expression was analyzed among MEKi resistant and MEKi naïve samples for 8505C; NThy-Ori; SK-MEL-28; and SK-MEL-31 cell lines on the SOLiD™ 4 NGS platform. Differential expression of miRNAs associated with naïve and resistant samples was found between cell lines (). Perhaps the most interesting differential regulation was that of the MIR302 and MIR515/MIR520 clusters between the BRAFV600E/V600E melanoma and thyroid cell lines. The MIR302 cluster was significantly upregulated in naïve SK-MEL-28 samples, whereas the MIR515/MIR520 cluster was significantly upregulated in MEKi resistant samples in 8505C. These clusters are classified as embryonic stem cell-specific cell cycle-regulating (ESCC) miRNA families Citation28,29 and, although located on different chromosomes, are referred to as the MIR302/373/374/520 family.Citation30
Table 2 Significant MIRNAs associated with samples.
The MIRNAs of these clusters are functionally similar and share a 7-mer seed sequence; as such their targeted genes tend to overlap. The miRWalk bioinformatic tool, with p < 0.01, predicted the target genes of the miRNAs from each cluster (with MIR302A excluded as it was shared between groups. The computationally derived gene targets of the differentially expressed miRNAs were examined by Gene Ontology (GO) “biological processes” classifications using GOStat analytical software to identify GO terms statistically overrepresented in each sample (naïve and resistant) for each cell line with significance set to P < 0.01 and multi-variant correction using Benjamini false discovery rate. 24 The top 20 most significantly associated GO terms associated with each of the MIR515/520 cluster target genes identified in the BRAFV600E MEK-inhibitor-resistant thyroid sample and the MIR302 cluster target genes identified in the BRAFV600E MEK-inhibitor-naïve melanoma sample are displayed in . Of these GO terms, 11 were shared within the top 20 between groups, 17 were shared between the top 20 and a significantly associated term (p < 0.01) outside the top 20 and only a single term was not significantly associated with both groups. This was consistent with previous observations about the target homology between these miRNA clusters. This trend of differential regulation of biological processes between BRAFV600E melanoma and BRAFV600E thyroid samples in response to MEK inhibition was reminiscent of that seen in the gene expression analyses.
Table 3 Association between top 20/cluster most significant GO terms.
Differential miRNA expression profiling of holoclones confirms miRNA pluripotency profile
Sk-MEL-28 and 8505C cell lines were progressed to holoclones as previously described. Citation18 Gene expression analysis confirmed an upgregulation of the pluripotency markers NANOG, POU5F (OCT4), and ALDH1 in holoclones compared to parental cell lines (). E-cadherin (CDH1) was not detectable in 8505C holoclones, but was present in the parental cell line. SNAI2 (SLUG), an E-cadherin repressor, was upregulated in 8505C holoclones. Conversely, in SK-MEL-28 cells, E-cadherin was upregulated and SNAI2 recipricolly downregulated in holoclones compared to parental cells. Holoclone RNA was assayed via next generation sequencing as before and microRNAs differentially regulated between holoclones and parental cells were assessed (). The MIR302/373/374/520 family were downregulated in SK-MEL-28 holoclones compared to parental cells. This is consistent with the Sk-MEL-28 MEK-inhibitor treated profile, indicating a stemness population may contribute to resistance to MEK inhibition in BRAFV600E melanoma. In 8505C cells, holoclones demonstrated an upregulation of the MIR520 cluster, consistant with the profile in MEKi resistant cells. However, MIR302A was downregulated in MEKi resistant cells whereas the MIR302 family was upregulated in 8505C holoclones compared to parental cells.
Figure 3. Holoclones have an upregulation of stemness factors. SK-MEL-28 and 8505C holoclones were compared to their parental cell lines for expression of pluripotency and EMT genes. RQ expression in holoclone samples was normalized to RQ of parental samples and averaged across biological replicates. Statistical significance (*). Error bars: SEM. X-axis: Assayed genes; Y-axis: Log2(Avg RQ Resistant/RQ Naïve).
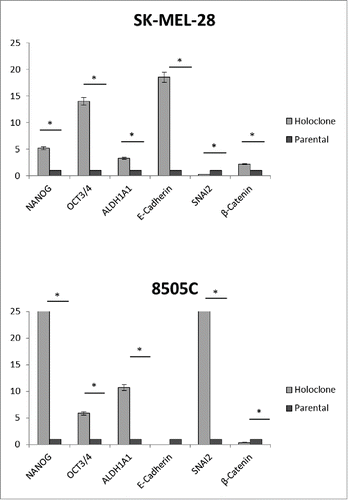
Table 4 MIR302/373/374/520 embryonic stem cell specific cell cycle regulating (ESCC) microRNA family in holoclones compared to parental cells (relative fold change +/−2).
Stemness-associated genes NANOG and POU5F1 are upregulated in MEKi treated in BRAFV600E melanoma but not MEKi treated BRAFV600E thyroid cell lines
As above, cells were assessed for the relative expression of the stemness-associated genes ALDH1A1, NANOG and POU5F1 (OCT4A) and the adhesion associated genes CDH1 (E-cadherin) and CTNNB1 (β-catenin). In the mutated melanoma samples, POU5F1/OCT4 was statistically significantly upregulated in resistant samples and trended toward upregulation of NANOG expression. No statistically significant relative expression in either the BRAFWT/WT melanoma or thyroid resistant cells for either NANOG or OCT4A (). Statistical significance was observed in the expression of adhesion genes in thyroid but not melanoma cell lines: in BRAFV600E/V600E 8505C, E-cadherin (CDH1) was statistically significantly upregulated with reciprocal downregulated of β-catenin (CTNNB1) in MEKi resistant samples. Conversely, in BRAFWT/WT NThy-Ori samples, E-cadherin was significantly downregulated with a non-significant trend toward upregulated expression of β-catenin in resistant samples. The stemness-associated gene ALDH1A1 was significantly upregulated in the NThy-Ori samples and trended toward downregulation in the 8505C samples.
Figure 4. MEKi resistance induces upregulation of stemness-associated genes in BRAFV600E melanoma cell lines. Cells treated with PD0325901 (resistant) or media-alone (naïve) were analyzed for gene expression. RQ expression in resistant samples was normalized to RQ of paired naïve samples and averaged across biological replicates. Statistical significance (*). Error bars: SEM. X-axis: Assayed cell line; Y-axis: Log2(Avg RQ Resistant/RQ Naïve).
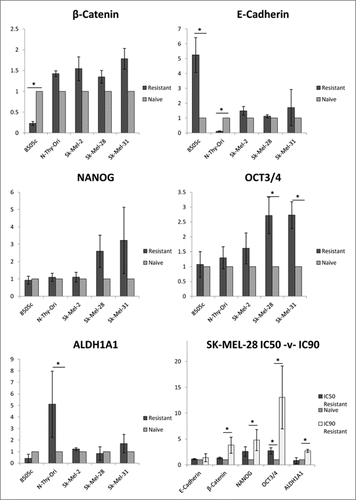
Experiments were repeated in BRAFV600E/V600E melanoma SK-MEL-28 cells using the IC90 dosage (153.9µM, R-Sq 85%). The IC90 treated cells reached statistical significance for all genes except E-cadherin. ALDH1A1, NANOG, OCT4A and β-catenin were all upregulated in SK-MEL-28 IC90 samples compared to matched naïve samples. Again, these results were more pronounced but consistent with the IC50 samples and indicate that altered gene expression between BRAFV600E/V600E thyroid (8505C) and melanoma (SK-MEL-28) cell lines was not due to additional drug burden caused by magnitude IC50 differences.
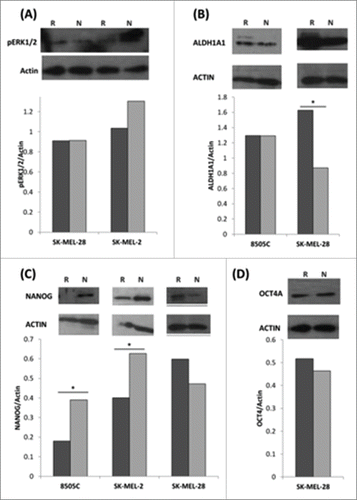
The stemness markers NANOG and ALDH1A1 are differentially expressed at protein level in MEKi-resistant BRAFV600E cells
Protein isolated from MEKi resistant and MEKi naïve samples were probed by Western blot analysis for the expression of phosphorylated ERK1/2 and the stemness markers ALDH1A1, NANOG and OCT4A in the homozygous BRAFV600E and BRAFWT thyroid and melanoma cell lines. Samples were also probed for actin as an endogenous control and densitometry was calculated using imageJ software with normalization to actin. Citation31 A normalized fold change of (+/−) 1.5-fold between naïve and resistant samples was considered statistically significant (). Phosphorylated ERK 1/2 (pERK1/2) was detected in the melanoma cell lines with no significant difference observed between resistant and naïve samples (). ALDH1A1 was identified in the BRAFV600E/V600E melanoma and thyroid samples. No difference in protein expression was evident in 8505C cells; however ALDH1A1 was significantly upregulated in SK-MEL-28 MEKi resistant cells (). NANOG was detected in SK-MEL-2, SK-MEL-28 and 8505C cell lines. The 8505C and SK-MEL-2 cell lines had significantly downregulated levels of NANOG in MEKi resistant cells. SK-MEL-28 had a trend toward an increased NANOG expression in MEKi resistant cells but failed to reach significance (1.3X). OCT4A was only detected in SK-MEL-28 cells and no difference in expression levels was evident between MEKi resistant and naïve samples (). Although not directly reflective of the mRNA results, the protein results do not contradict the pattern found in the mRNA. The upregulated stem cell marker ALDH1A1 was identified in the BRAFV600E/V600E melanoma and NANOG trended toward upregulation in this sample. Conversely, NANOG was downregulated in BRAFV600E/V600E thyroid cells.
Figure 5. Protein expression is differentially regulated in SK-MEL-28 and SK-MEL-2 MEKi resistant protein samples. (A-D) Western blot and autoradiograpgy intensity analysis was performed for PD0325901 resistant and naïve samples. X-axis: Cell Line; Y-axis: Intensity target protein/Intensity Actin.
MEK inhibition induces restoration of Thyroid Stimulating Hormone Receptor (TSHR) expression in an anaplastic thyroid carcinoma cell line
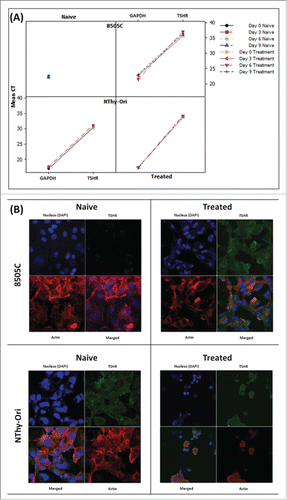
8505c cells were treated with the MEK inhibitor PD0326901 to examine its effect on TSHR expression. RNA samples were extracted at 3 time-points following treatment (day 3 (72 hour exposure to PD0325901), day 6 (2×72 hour consecutive treatments), and day 10 (2× 72 hours plus 1x 96hour consecutive treatments)), and confocal imaging was carried out on cells from days 6 and 10 days. No TSHR gene expression was observed in the samples treated for 3 days. However, 7/15 samples of day 6 cells demonstrated weak expression of TSHR. Similar results were seen in the day 10 samples with 6/18 samples were analyzed demonstrating weak expression of TSHR. A paired student's t-test comparing differences in the RQ values of TSHR expression between the control (naïve) and treated 8505c samples, yielded p-values of 0.17, and 0.078 for cells from day 6 and 10, respectively. Comparison between the RQ values of TSHR expression between 8505c cells from days 6 and 10 yielded a p-value of 0.24 (Students T-Test).
TSHR protein was absent in cells treated with the MEK inhibitor for 6 days. Actin polymerization and production did not appear to be affected in either the naive or treated samples. However TSHR was detected in cells from day 10 treated with the MEK inhibitor. TSHR distribution resembled expression observed in N-Thy-Ori cells, indicating that TSHR expression was restored after MEK inhibition for 10 days (). Treatment with the MEK inhibitor induced a number of changes in the morphology of 8505C and these changes were documented by Brightfield microscopy (data not shown). Actin production and polymerization did not appear to be affected, but demonstrated a different organization pattern than that seen in naïve 8505C cells (). TSHR and its interactions with TSH are essential for normal thyrocyte function. However, in 8505C cells TSHR expression is near-obliterated due to the BRAFV600E mutation (Franco et al, 2011; Durante et al, 2007; Liu et al, 2007). Current treatment of thyroid cancers is based on surgical excision and radioiodine therapy. Loss of TSHR is associated with low to null radioiodine avidity. This data indicates that MEK inhibition prior to radioiodine therapy has the potential to significantly benefit treatment of BRAFV600E carcinomas. Further studies including radioiodine uptake assays in correlation with MEK inhibitor assays should be performed.
Figure 6. MEKi treatment induces reinstatement of TSHR protein in anaplastic thyroid cells (A) Gene expression analysis can detect TSHR expression in 8505C cells only following sustained MEK inhibitor treatment. TSHR is readily detectable in both the naïve and resistant BRAFWT NThy-Ori cell line. (B) Confocal analysis detects expression of the TSHR protein expression in 8505C cells following sustained MEK inhibitor treatment. TSHR protein is readily detectable in both the naïve and resistant BRAFWT NThy-Ori cell line. Confocal Legend: TSHR: Green; Actin: Red; Nucleus: Blue Images (individual color channels and merged) taken on 63X objective lens.
Discussion
MiRNA expression profiling has identified a range of biological processes regulated by miRNAs, including the maintenance of tissue differentiation.Citation29,32,33 Unique patterns of miRNAs have been identified in both human and mouse embryonic stem cells, reinforcing the role of miRNAs in maintaining stemness.Citation29,34-39
Cancer is heterogeneous. A mechanism for the phenotypic heterogeneity evident in cancer may be the existence of cancer stem cells, which have been associated with resistance to chemotherapies and radiation therapies.Citation40-42 The original cancer stem cell model suggests that a rare subpopulation of cells with indefinite potential for self renewal exists within a tumor.Citation43 However, recent evidence suggests that stem-like cancer cells arise de novo from non-stem-like cells.Citation44,45 These concepts are not mutually exclusive and both may cooperate in tumor resistance and response to therapy.
BRAFV600E is commonly mutated in both thyroid and melanoma cancers. Constitutive activation of BRAFV600E results in oncogene addiction and dependency on the MAPK pathway. This allows targeting of the MEK1/2 kinase as a molecularly targeted therapy as the presence of BRAFV600E combined with small molecule inhibition of MEK1/2 results in a synthetic lethal phenotype. MEK inhibitors are currently undergoing clinical trials for the treatment of both melanoma and thyroid carcinomas (http://www.cancer.gov/clinicaltrials). To date, MEK inhibitors have displayed promising but limited success as a single agent therapy in clinical trials.Citation46-49 This highlights the need to better understand the interactions of MEK inhibition in BRAFV600E cells to assist the design of new therapeutic strategies. To this end, MEK inhibition with the potent, selective inhibitor of MEK, PD0325901, was used in conjunction with gene expression analysis, protein analysis and NGS profiling of miRNA to investigate molecular mechanisms associated with resistance to MEK inhibition.
The SMKI used in this study, PD0325901, is an allosteric inhibitor of MEK1 and MEK2. Allosteric inhibitors are non-ATP competitive; rather they bind to a site distinct to the enzyme active site. Allosteric sites typically function to bind a ligand that either positively or negatively regulates activity of the enzyme. These binding sites and their regulatory actions are often unique to that particular kinase, thus allosteric inhibitors exhibit the highest degree of kinase selectivity.Citation50 The specificity of PD0325901 is further enhanced by the unusually specific interaction of MEK1/2 and its downstream target ERK1/2: MEK1/2 are the only confirmed activators of ERK1/2 and ERK1/2 are the only known substrates for MEK1/2.Citation51
In BRAF mutated cancers, MEK is a second class kinase target; that is, inhibition of MEK results in a synthetic-lethal phenotype when paired with BRAFV600E. Synthetic lethality refers to a gene interaction in which single gene defects are compatible with cell viability but the combination of gene effects results in cell death. Inhibition of the products of genes that are synthetic lethal to oncogenic mutations theoretically kill cells that harbour the oncogenic mutation while sparing normal cells. Hard synthetic lethalities are the preferred targets of molecular cancer therapy. Hard synthetic lethal interactions are relatively unaffected by changes in additional genes, whereas soft synthetic lethalities are readily rescued by alterations in other genes.Citation52 Elucidation of the mechanism of resistance of BRAFV600E versus BRAFWT cells to MEK inhibition should greatly aid in determining the extent of synthetic lethal interactions induced by PD0325901.
Cancers are highly heterogenic malignancies that develop through stochastic genetic and epigenetic events. Cancer is a dynamic state and over time genetic instability generates a plethora of alterations and diversity within a cancer. This genetic diversity has led to dramatically different responses to targeted therapies dependent on tumor type. In some cancers targeted therapies have markedly improved survival whereas in others it has led to only modest benefits.Citation53 This has highlighted the importance of adapting targeted therapies for optimum delivery depending on the underlying genotype. Hence, the importance of optimising MEK inhibitor treatment for each cell line used in this study.
Key members of the MAPK pathway were analyzed on the mRNA and protein levels for their relative expression between paired resistant and naïve samples. Acquisition of resistance did not induce statistically significant differential gene expression of any of the MAPK genes analyzed in the BRAFWT/WT thyroid or melanoma cell lines. However, in the BRAFV600E thyroid cell lines, resistance to MEKi was associated with downregulation of all MAPK genes expression; conversely, BRAFV600E melanoma samples trended toward upregulation in MAPK gene expression in resistant samples. This indicates that resistance to MEKi may be induced by activation of alternative pathway(s) in BRAFV600E thyroid cells, whereas reactivation of the pathway may be a mechanism of resistance in BRAFV600E melanoma cells.
The MAPK pathway member ERK1/2 was assayed on the protein level for both tERK1/2 and the activated form pERK1/2 in both naïve and resistant samples. Total ERK was detected in all samples and displayed no difference in expression between naïve and resistant samples in thyroid cell lines. However, tERK1/2 was differentially regulated in melanoma samples dependent on BRAF status: BRAFV600E/V600E had statistically significant increased expression in resistant cells whereas tERK1/2 expression was decreased in the BRAFWT/WT resistant sample. This pattern did not hold for active ERK, as neither melanoma cell line displayed any difference between pERK1/2 expression levels demonstrating that melanoma cells resistance to MEKi have an active MAPK pathway. In line with evidence from the gene expression studies and consistent with previous reports in the literature, this data indicates that reactivation of the MAPK pathway is associated with resistance to MEKi in melanoma cells.Citation8,12
ERK has been well studied in melanoma following inhibition of the MAPK signaling pathway.Citation54,55 However, less is known about its localization in thyroid cancer. Hence, we examined total ERK1/2 and pERk1/2 localization in thyroid cancer following MEK inhibition. It has previously been reported that MEK inhibition induces downregulation of pERK1/2 within hours of treatment but that pERK1/2 levels quickly rebound within 24 hours.Citation27 It is therefore particularly interesting that this study has identified a differential localization of pERK1/2 within the cell following MEKi. The localization of pERK1/2 in BRAFV600E naïve samples reflects the localization in BRAFWT treated samples and vice-versa. Subcellular localization of ERK is now recognized as a physiologically relevant means of regulating ERK activity.Citation56 Spatiotemporal regulation of active ERK has been associated with deregulated ERK signaling.Citation57 In response to extracellular signaling, ERK translocates to the nucleus and then relocalises to the cytoplasm again. The relocalisation of nuclear ERK to the cytoplasm is mediated by a MEK-dependent active transport mechanism.Citation58
The basolateral layer of the cell is the area of the basal lamina, containing the extracellular matrix (ECM) in epithelial cells. Regulation of the MAPK pathway is closely linked with the ECM. ERK1/2 is anchored to the cytoskeleton by MEK1/2.Citation58 Association of ERK1/2 with the cytoskeleton is hypothesized to be involved in the transport of ERK1/2 to other organelles of the cell rather than the nucleus.Citation59 For example, the scaffold protein IQGAP1 interacts with BRAF to recruit MEK1/2 and ERK1/2 to actin filaments, thereby influencing mitogenic, morphological and migratory cell behavior. They can also direct ERK1/2 to influence cytoskeleton reorganisation and cell motility and is believed to be involved in the metastatic potential of BRAFV600E cancers.Citation60,61 Inhibition of MEK in lung cancer cell lines (BRAFWT) has been demonstrated to inhibit invasion via cytoskeleton remodelling.Citation62
MiRNA profiling was performed and validated targets of statistically significant miRNAs (significance associated with naïve or resistant samples) were analyzed for overrepresentation of GO biological processes in each thyroid sample. Cytoskeleton organization, microtubule cytoskeleton organization, ECM organization and actin filament polymerization were overrepresented in 8505C resistant samples (p = 2.28×10−<τβρ>5, 0.00607, 0.00312, and 0.00785 respectively). Cell adhesion was highly overrepresented in 8505C resistant cells and in NThy-Ori naïve cells (p = 1.53×10−<τβρ>8; 8.95×10−<τβρ>6). Consistent with the differential regulation of these terms, expression of CDH1 (E-cadherin), an integral mediator of cytoskeleton signaling and maintenance of tissue architecture in epithelial cells, was also differentially regulated between 8505C (upregulated) and NThy-Ori (downregulated) resistant cells ().
MEK inhibition has an evident differential effect on the MAPK pathway between thyroid cell lines, as evident by gene, protein and miRNA analysis. These differences could be due to BRAF status. However, the patterns of pERK1/2 localization between thyroid cell lines may also be due to the anaplastic nature of 8505C compared to the differentiated phenotype of NThy-Ori. Further investigation into the role of cytoskeleton-related signaling and MEK inhibition in thyroid carcinomas is warranted. The thyroid cell line panel should be expanded to include a greater range of BRAFWT and BRAFV600E cell lines with varying states of cellular differentiation to determine if the polarized effects are associated with BRAF status, the state of cellular differentiation at the start of treatment or both.
Cancer stem cells (CSC) have been known to exist in melanoma populations for over 30 years.Citation63,64 Recent findings demonstrated that cancer stem cells can convert from a non-stem to a cancer stem cell-like state.Citation44,45,65 Tumourigenesis and somatic cell reprogramming share common mechanisms; the factors that drive reprogramming tend to be oncogenes or related to cellular transformation.Citation66 The transcription factor OCT4A (POU5F1) is of particular importance for reprogramming of stem-cells and has been reported to function as a single agent to reprogramme adult neural cells to induced pluripotent stem (iPS) cells.Citation67 OCT4-mediated dedifferentiation has been demonstrated as a mechanism of acquired CSC phenotype.Citation65 Gene expression analysis in this study identified an upregulation of OCT4A in MEK resistant cells in BRAFV600E melanoma cell lines. Furthermore, the CSC markers ALDH1A1 and NANOG were also upregulated in MEKi resistant BRAFV600E melanoma and this upregulation was enhanced with a higher dosage of PD0325901 in SK-MEL-28 cells (). However, this pattern of upregulation was not reflected on the protein level. ALDH1A1 was upregulated on the protein level in resistant SK-MEL-28, but no relative change in protein expression was observed for NANOG or OCT4A in SK-MEL-28, whereas OCT4 and NANOG protein was not detected in either naïve or resistant samples of SK-MEL-31. The differences observed between the gene and protein expression studies may be due to translational regulation by miRNAs.
MiRNAs have been associated with regulation and maintenance of a stem cell phenotype in recent studies of human ESCs.Citation29,34 The regulatory hierarchy involved in regulation of OCT4-medicated reprogramming included direct regulation by the MIR302 cluster of miRNAs. The MIR302 cluster of miRNAs, found on chromosome 4q, was significantly upregulated in naïve samples compared to resistant samples of SK-MEL-28 and, to a lesser extent, SK-MEL-31 melanoma cell lines. The MIR302 cluster has a demonstrated role not only in embryonic stem cells but also in the reprogramming of somatic cells to iPSC.Citation68,69 Recently, Fareh et al, elegantly demonstrated a role for MIR302 cluster in cancer stem cell maintenance by demonstrating a MIR302 family-induced suppression of a stemness gene signature that disrupted the sonic hedgehog (SHH)-NANOG network in glioma cancer cells.Citation70
The molecular mechanisms by which the MIR302 cluster functions is somewhat conflicted in the literature dependent upon its association with human or mouse ESC; iPSC; or CSC.Citation28,29,68,70-73 The majority of embryonic stem cell studies are performed in mice, however, at least some of the regulatory mechanisms of MIR302 in humans are fundamentally different to those in murine ESCs; the MIR302 family promoted transition through G1-S and induced cell proliferation in mice, whereas the MIR302 family repressed G1-S transition and reduced cell proliferation in human ESCs.Citation68 The MIR302 family has also been associated with regulation of epigenetic remodelling involved with OCT4-mediated reprogramming of human somatic cells.Citation69
Our study has provided ample evidence to warrant further investigation into the relationship between the MIR302 family, OCT4-NANOG transcription network and resistance to MEK inhibition. Studies in mice using the 2i/LIF dual kinase inhibitor of MEK and glycogen synthase kinase 3 (GSK3), demonstrated that inhibition of MEK activated Nanog to enable somatic cell reprogramming.Citation74 Interestingly, in the Theunissen study, chemical inhibition of DNA methylation also induced Nanog to enhance reprogramming. The observation that Nanog can induce pluripotency in minimal conditions, including MEK inhibition, has yet to be demonstrated in humans. Considering the significantly increased expression of NANOG in MEKi treated BRAFV600E melanoma observed in the current study, in combination with the differential regulation of OCT4-NANOG network-associated miRNAs, further investigation into the interaction of this network during MEKi resistance is merited.
A theme consistent throughout all analyses was the opposing responses between 8505C and SK-MEL-28 cells. This is clearly seen in the gene expression analysis () where MEKi resistant samples demonstrated downregulation of both the MAPK pathway genes and the stemness markers in 8505C resistant samples. Conversely, the SK-MEL-28 resistant samples trend toward upregulation in both sets of genes. Furthermore, β-catenin (CTNNB1), which has been demonstrated to maintain the undifferentiated state of human ESCs and induced pluripotent stem cells,Citation75 was down regulated in MEKi treated 8505C and upregulated in IC90 MEKi treated SK-MEL-28. It has previously been demonstrated that the MAPK pathway was downregulated upon differentiation.Citation76 Consistent with this is the observed downregulation of the MAPK pathway in resistant 8505C but not SK-MEL-28. The evidence on the protein level was not as clear-cut; however, the stemness marker NANOG was downregulated in 8505C whereas the stemness marker ALDH1A1 was upregulated in SK-MEL-28 (). The polarized pattern was again reflected in the miRNA profiles for each cell line, most notably in regards to the MIR302 and MIR520 clusters. The MIR302 cluster was upregulated in naïve relative to resistant SK-MEL-28 samples whereas the MIR520 cluster was upregulated in MEKi resistant relative to naive 8505C samples. The MIR520 cluster located on chromosome 19 shares a consensus seed sequence (AAGUGC) with the MIR302 cluster (chromosome 4) and their predicted target genes tend to overlap and they display functional similarity.Citation29,30
Gene ontology analysis confirms differential inferred miRNA functions between SK-MEL-28 and 8505C. Many GO terms statistically significantly associated with naïve samples in SK-MEL-28 were significantly associated with resistant samples in 8505C. From the biological association of GO-Terms across cell lines, it can be seen that regulation of transcription, proliferation, apoptosis and cell death were differentially associated between naïve SK-MEL-28 and resistant 8505C samples ().
Most notably within the associated GO terms was the high significance of cell differentiation associated with the MIR515/520 cluster (p = 6.41×10⁻¹¹) and the MIR302 cluster (p = 1.11×10−<τβρ>12). The differential associations with the GO terms supports the hypothesis that treatment with PD0325901 induces the anaplastic cell line 8505C into a more differentiated state, as supported by MEKi-induced reexpression of the TSHR receptor (); whereas SK-MEL-28 was induced into a more stem-like state. Thus, further investigation into the mechanisms of the differential response to MEKi observed between the BRAFV600E thyroid and melanoma cells is merited and an initial investigation into the role of the MIR302/MIR520 clusters in this response should be performed.
Conclusions
In this study, we have identified a gene and miRNA signature differentially regulated by MEK inhibition in thyroid and melanoma BRAFV600E cells. Evidence from the analysis of gene, protein and miRNA expression, has highlighted a central axiom associated with induced differentiation/dedifferentiation that is being alternatively regulated by MEKi in homozygous BRAFV600E thyroid and melanoma cells. A MEKi-associated signature of MAPK and stemness-associated genes was downregulated in the resistant thyroid cell line 8505C but expression trends toward upregulation in the resistant melanoma BRAFV600E cells. This signature was observed in neither thyroid nor melanoma BRAFWT/WT cell lines. Furthermore, differential regulation of ESCC-associated miRNAs was also observed between the BRAFV600E/V600E cell lines. The consensus seed sequence-sharing and functionally similar miRNA clusters MIR302 and MIR520 were associated with naïve SK-MEL-28 samples and resistant 8505C samples respectively. Whether this differential association was due to tissue specificity or the ab initio state of cellular differentiation of the cell models has yet to be elucidated. However, if the polarized effect induced by MEKi was due to the state of cellular differentiation at the start of treatment it could have significant consequences on the combinatorial treatment required for primary and metastatic lesions.
Disclosure of potential conflicts of interest
No potential conflicts of interest were disclosed.
Acknowledgment
Access to Next Generation Sequencing Facility was made possible through a grant from the Emer Casey Foundation.
References
- Houben R, Becker J, Kappel A, Terheyden P, Bröcker E, Goetz R, Rapp U. Constitutive activation of the Ras-Raf signaling pathway in metastatic melanoma is associated with poor prognosis. J Carcinog 2004; 3:6; PMID:15046639; http://dx.doi.org/10.1186/1477-3163-3-6
- Tang K, Lee C. BRAF mutation in papillary thyroid carcinoma: pathogenic role and clinical implications. J Chin Med Assoc 2010; 73:113-28; PMID:20230995; http://dx.doi.org/10.1016/S1726-4901(10)70025-3
- Sawyers C. Targeted cancer therapy. Nature 2004; 432:294-7; PMID:15549090; http://dx.doi.org/10.1038/nature03095
- Chapman PB, Hauschild A, Robert C, Haanen JB, Ascierto P, Larkin J, Dummer R, Garbe C, Testori A, Maio M, et al. Improved survival with vemurafenib in melanoma with BRAF V600E mutation. N Engl J Med 2011; 364:2507-16; PMID:21639808; http://dx.doi.org/10.1056/NEJMoa1103782
- Nazarian R, Shi H, Wang Q, Kong X, Koya RC, Lee H, Chen Z, Lee MK, Attar N, Sazegar H, et al. Melanomas acquire resistance to B-RAF(V600E) inhibition by RTK or N-RAS upregulation. Nature 2010; 468:973-7; PMID:21107323; http://dx.doi.org/10.1038/nature09626
- Montagut C, Sharma S, Shioda T, McDermott U, Ulman M, Ulkus L, Dias-Santagata D, Stubbs H, Lee D, Singh A, et al. Elevated CRAF as a potential mechanism of acquired resistance to BRAF inhibition in melanoma. Cancer Res 2008; 68:4853-61; PMID:18559533; http://dx.doi.org/10.1158/0008-5472.CAN-07-6787
- Poulikakos PI, Persaud Y, Janakiraman M, Kong X, Ng C, Moriceau G, Shi H, Atefi M, Titz B, Gabay MT, et al. RAF inhibitor resistance is mediated by dimerization of aberrantly spliced BRAF(V600E). Nature 2011; 480:387-90; PMID:22113612; http://dx.doi.org/10.1038/nature10662
- Johannessen CM, Boehm JS, Kim SY, Thomas SR, Wardwell L, Johnson LA, Emery CM, Stransky N, Cogdill AP, Barretina J, et al. COT drives resistance to RAF inhibition through MAP kinase pathway reactivation. Nature 2010; 468:968-72; PMID:21107320; http://dx.doi.org/10.1038/nature09627
- Smalley KS, McArthur GA. The current state of targeted therapy in melanoma: this time it's personal. Semin Oncol 2012; 39:204-14; PMID:22484192; http://dx.doi.org/10.1053/j.seminoncol.2012.01.008
- Solit D, Garraway L, Pratilas C, Sawai A, Getz G, Basso A, Ye Q, Lobo J, She Y, Osman I, et al. BRAF mutation predicts sensitivity to MEK inhibition. Nature 2006; 439:358-62; PMID:16273091; http://dx.doi.org/10.1038/nature04304
- Flaherty KT. BRAF inhibitors and melanoma. Cancer J 2011; 17:505-11; PMID:22157295; http://dx.doi.org/10.1097/PPO.0b013e31823e5357
- Villanueva J, Vultur A, Lee JT, Somasundaram R, Fukunaga-Kalabis M, Cipolla AK, Wubbenhorst B, Xu X, Gimotty PA, Kee D, et al. Acquired resistance to BRAF inhibitors mediated by a RAF kinase switch in melanoma can be overcome by cotargeting MEK and IGF-1R/PI3K. Cancer Cell 2010; 18:683-95; PMID:21156289; http://dx.doi.org/10.1016/j.ccr.2010.11.023
- Gopal YN, Deng W, Woodman SE, Komurov K, Ram P, Smith PD, Davies MA. Basal and treatment-induced activation of AKT mediates resistance to cell death by AZD6244 (ARRY-142886) in Braf-mutant human cutaneous melanoma cells. Cancer Res 2010; 70:8736-47; PMID:20959481; http://dx.doi.org/10.1158/0008-5472.CAN-10-0902
- Haass NK, Sproesser K, Nguyen TK, Contractor R, Medina CA, Nathanson KL, Herlyn M, Smalley KS. The mitogen-activated protein/extracellular signal-regulated kinase kinase inhibitor AZD6244 (ARRY-142886) induces growth arrest in melanoma cells and tumor regression when combined with docetaxel. Clin Cancer Res 2008; 14:230-9; PMID:18172275; http://dx.doi.org/10.1158/1078-0432.CCR-07-1440
- Long GV, Stroyakovskiy D, Gogas H, Levchenko E, de Braud F, Larkin J, Garbe C, Jouary T, Hauschild A, Grob JJ, et al. Combined BRAF and MEK Inhibition vs. BRAF Inhibition Alone in Melanoma. N Eng J Med 2014; 371:1877-88; PMID:25265492; http://dx.doi.org/10.1056/NEJMoa1406037
- Larkin J, Ascierto PA, Dréno B, Atkinson V, Liszkay G, Maio M, Mandalà M, Demidov L, Stroyakovskiy D, Thomas L, et al. Combined Vemurafenib and Cobimetinib in BRAF-Mutated Melanoma. N Engl J Med 2014; 371:1867-76; PMID:25265494; http://dx.doi.org/10.1056/NEJMoa1408868
- Pritchard CC, Cheng HH, Tewari M. MicroRNA profiling: approaches and considerations. Nat Rev Genet 2012; 13:358-69; PMID:22510765; http://dx.doi.org/10.1038/nrg3198
- Olszewski WL, Moscicka M, Zolich D, Machowski Z. Human keratinocyte stem cells survive for months in sodium chloride and can be successfully transplanted. Transplantation Proc 2005; 37:525-6; PMID:15808698; http://dx.doi.org/10.1016/j.transproceed.2004.12.174
- Smyth P, Finn S, Cahill S, O'Regan E, Flavin R, O'Leary JJ, Sheils O. ret/PTC and BRAF act as distinct molecular, time-dependant triggers in a sporadic Irish cohort of papillary thyroid carcinoma. Int J Surg Pathol 2005; 13:1-8; PMID:15735849; http://dx.doi.org/10.1177/106689690501300101
- Freeley M, O'Dowd F, Paul T, Kashanin D, Davies A, Kelleher D, Long A. L-plastin regulates polarization and migration in chemokine-stimulated human T lymphocytes. J Immunol 2012; 188:6357-70; PMID:22581862; http://dx.doi.org/10.4049/jimmunol.1103242
- Anders S, Huber W. Differential expression analysis for sequence count data. Genome Biol 2010; 11:R106; http://dx.doi.org/10.1186/gb-2010-11-10-r106
- Li S, Wang H, Qi Y, Tu J, Bai Y, Tian T, Huang N, Wang Y, Xiong F, Lu Z, et al. Assessment of nanomaterial cytotoxicity with SOLiD sequencing-based microRNA expression profiling. Biomaterials 2011; 32:9021-30; PMID:21889204; http://dx.doi.org/10.1016/j.biomaterials.2011.08.033
- Dweep H, Sticht C, Pandey P, Gretz N. miRWalk–database: prediction of possible miRNA binding sites by “walking” the genes of three genomes. J Biomed Inform 2011; 44:839-47; PMID:21605702; http://dx.doi.org/10.1016/j.jbi.2011.05.002
- Beissbarth T, Speed TP. GOstat: find statistically overrepresented Gene Ontologies within a group of genes. Bioinformatics 2004; 20:1464-5; PMID:14962934; http://dx.doi.org/10.1093/bioinformatics/bth088
- Xing J, Liu R, Xing M, Trink B. The BRAFT1799A mutation confers sensitivity of thyroid cancer cells to the BRAFV600E inhibitor PLX4032 (RG7204). Biochem Biophys Res Commun 2011; 404:958-62; PMID:21185263; http://dx.doi.org/10.1016/j.bbrc.2010.12.088
- Henderson YC, Chen Y, Frederick MJ, Lai SY, Clayman GL. MEK inhibitor PD0325901 significantly reduces the growth of papillary thyroid carcinoma cells in vitro and in vivo. Mol Cancer Ther 2010; 9:1968-76; PMID:20587665; http://dx.doi.org/10.1158/1535-7163.MCT-10-0062
- Leboeuf R, Baumgartner JE, Benezra M, Malaguarnera R, Solit D, Pratilas CA, Rosen N, Knauf JA, Fagin JA. BRAFV600E mutation is associated with preferential sensitivity to mitogen-activated protein kinase kinase inhibition in thyroid cancer cell lines. J Clin Endocrinol Metab 2008; 93:2194-201; PMID:18381570; http://dx.doi.org/10.1210/jc.2007-2825
- Subramanyam D, Lamouille S, Judson RL, Liu JY, Bucay N, Derynck R, Blelloch R. Multiple targets of miR-302 and miR-372 promote reprogramming of human fibroblasts to induced pluripotent stem cells. Nat Biotechnol 2011; 29:443-8; PMID:21490602; http://dx.doi.org/10.1038/nbt.1862
- Ren J, Jin P, Wang E, Marincola FM, Stroncek DF. MicroRNA and gene expression patterns in the differentiation of human embryonic stem cells. J Transl Med 2009; 7:20; PMID:19309508; http://dx.doi.org/10.1186/1479-5876-7-20
- Mazda M, Nishi K, Naito Y, Ui-Tei K. E-cadherin is transcriptionally activated via suppression of ZEB1 transcriptional repressor by small RNA-mediated gene silencing. PLoS One 2011; 6:e28688; PMID:22205962; http://dx.doi.org/10.1371/journal.pone.0028688
- Schneider CA, Rasband WS, Eliceiri KW. NIH Image to ImageJ: 25 years of image analysis. Nat Methods 2012; 9:671-5; PMID:22930834; http://dx.doi.org/10.1038/nmeth.2089
- Wienholds E, Plasterk RH. MicroRNA function in animal development. FEBS Lett 2005; 579:5911-22; PMID:16111679; http://dx.doi.org/10.1016/j.febslet.2005.07.070
- Alvarez-Garcia I, Miska EA. MicroRNA functions in animal development and human disease. Development 2005; 132:4653-62; PMID:16224045; http://dx.doi.org/10.1242/dev.02073
- Morin RD, O'Connor MD, Griffith M, Kuchenbauer F, Delaney A, Prabhu AL, Zhao Y, McDonald H, Zeng T, Hirst M, et al. Application of massively parallel sequencing to microRNA profiling and discovery in human embryonic stem cells. Genome Res 2008; 18:610-21; PMID:18285502; http://dx.doi.org/10.1101/gr.7179508
- Lakshmipathy U, Love B, Goff LA, Jörnsten R, Graichen R, Hart RP, Chesnut JD. MicroRNA expression pattern of undifferentiated and differentiated human embryonic stem cells. Stem Cells Dev 2007; 16:1003-16; PMID:18004940; http://dx.doi.org/10.1089/scd.2007.0026
- Suh MR, Lee Y, Kim JY, Kim SK, Moon SH, Lee JY, Cha KY, Chung HM, Yoon HS, Moon SY, et al. Human embryonic stem cells express a unique set of microRNAs. Dev Biol 2004; 270:488-98; PMID:15183728; http://dx.doi.org/10.1016/j.ydbio.2004.02.019
- Chen C, Ridzon D, Lee CT, Blake J, Sun Y, Strauss WM. Defining embryonic stem cell identity using differentiation-related microRNAs and their potential targets. Mamm Genome 2007; 18:316-27; PMID:17610011; http://dx.doi.org/10.1007/s00335-007-9032-6
- Tang F, Hajkova P, Barton SC, Lao K, Surani MA. MicroRNA expression profiling of single whole embryonic stem cells. Nucleic Acids Res 2006; 34:e9; PMID:16434699; http://dx.doi.org/10.1093/nar/gnj009
- Houbaviy HB, Murray MF, Sharp PA. Embryonic stem cell-specific MicroRNAs. Dev Cell 2003; 5:351-8; PMID:12919684; http://dx.doi.org/10.1016/S1534-5807(03)00227-2
- Liu G, Yuan X, Zeng Z, Tunici P, Ng H, Abdulkadir IR, Lu L, Irvin D, Black KL, Yu JS. Analysis of gene expression and chemoresistance of CD133+ cancer stem cells in glioblastoma. Mol Cancer 2006; 5:67; PMID:17140455; http://dx.doi.org/10.1186/1476-4598-5-67
- Li S, Li D. Stem cell and kinase activity-independent pathway in resistance of leukaemia to BCR-ABL kinase inhibitors. J Cell Mol Med 2007; 11:1251-62; PMID:18205699; http://dx.doi.org/10.1111/j.1582-4934.2007.00108.x
- Dean M, Fojo T, Bates S. Tumour stem cells and drug resistance. Nat Rev Cancer 2005; 5:275-84; PMID:15803154; http://dx.doi.org/10.1038/nrc1590
- Reya T, Morrison SJ, Clarke MF, Weissman IL. Stem cells, cancer, and cancer stem cells. Nature 2001; 414:105-11; PMID:11689955; http://dx.doi.org/10.1038/35102167
- Gupta PB, Fillmore CM, Jiang G, Shapira SD, Tao K, Kuperwasser C, Lander ES. Stochastic state transitions give rise to phenotypic equilibrium in populations of cancer cells. Cell 2011; 146:633-44; PMID:21854987; http://dx.doi.org/10.1016/j.cell.2011.07.026
- Chaffer CL, Brueckmann I, Scheel C, Kaestli AJ, Wiggins PA, Rodrigues LO, Brooks M, Reinhardt F, Su Y, Polyak K, et al. Normal and neoplastic nonstem cells can spontaneously convert to a stem-like state. Proc Natl Acad Sci U S A 2011; 108:7950-5; PMID:21498687; http://dx.doi.org/10.1073/pnas.1102454108
- Flaherty KT, Robert C, Hersey P, Nathan P, Garbe C, Milhem M, Demidov LV, Hassel JC, Rutkowski P, Mohr P, et al. Improved survival with MEK inhibition in BRAF-mutated melanoma. N Engl J Med 2012; 367:107-14; PMID:22663011; http://dx.doi.org/10.1056/NEJMoa1203421
- Kirkwood JM, Bastholt L, Robert C, Sosman J, Larkin J, Hersey P, Middleton M, Cantarini M, Zazulina V, Kemsley K, et al. Phase II, open-label, randomized trial of the MEK1/2 inhibitor selumetinib as monotherapy versus temozolomide in patients with advanced melanoma. Clin Cancer Res 2012; 18:555-67; PMID:22048237; http://dx.doi.org/10.1158/1078-0432.CCR-11-1491
- Smalley KS, Flaherty KT. Integrating BRAF/MEK inhibitors into combination therapy for melanoma. Br J Cancer 2009; 100:431-5; PMID:19156138; http://dx.doi.org/10.1038/sj.bjc.6604891
- Adjei AA, Cohen RB, Franklin W, Morris C, Wilson D, Molina JR, Hanson LJ, Gore L, Chow L, Leong S, et al. Phase I Pharmacokinetic and Pharmacodynamic Study of the Oral, Small-Molecule Mitogen-Activated Protein Kinase Kinase 1/2 Inhibitor AZD6244 (ARRY-142886) in Patients With Advanced Cancers. J Clin Oncol 2008; 26:2139-46; PMID:18390968; http://dx.doi.org/10.1200/JCO.2007.14.4956
- Zhang J, Yang PL, Gray NS. Targeting cancer with small molecule kinase inhibitors. Nat Rev Cancer 2009; 9:28-39; PMID:19104514; http://dx.doi.org/10.1038/nrc2559
- English JM, Cobb MH. Pharmacological inhibitors of MAPK pathways. Trends Pharmacol Sci 2002; 23:40-5; PMID:11804650; http://dx.doi.org/10.1016/S0165-6147(00)01865-4
- Ashworth A, Lord CJ, Reis-Filho JS. Genetic interactions in cancer progression and treatment. Cell 2011; 145:30-8; PMID:21458666; http://dx.doi.org/10.1016/j.cell.2011.03.020
- Turner NC, Reis-Filho JS. Genetic heterogeneity and cancer drug resistance. Lancet Oncol 2012; 13:e178-85; PMID:22469128; http://dx.doi.org/10.1016/S1470-2045(11)70335-7
- Bollag G, Hirth P, Tsai J, Zhang J, Ibrahim PN, Cho H, Spevak W, Zhang C, Zhang Y, Habets G, et al. Clinical efficacy of a RAF inhibitor needs broad target blockade in BRAF-mutant melanoma. Nature 2010; 467:596-9; PMID:20823850; http://dx.doi.org/10.1038/nature09454
- Girotti Maria R, Lopes F, Preece N, Niculescu-Duvaz D, Zambon A, Davies L, Whittaker S, Saturno G, Viros A, Pedersen M, et al. Paradox-Breaking RAF Inhibitors that Also Target SRC Are Effective in Drug-Resistant BRAF Mutant Melanoma. Cancer Cell 2015; 27:85-96; PMID:25500121; http://dx.doi.org/10.1016/j.ccell.2014.11.006
- Aplin AE, Stewart SA, Assoian RK, Juliano RL. Integrin-mediated adhesion regulates ERK nuclear translocation and phosphorylation of Elk-1. J Cell Biol 2001; 153:273-82; PMID:11309409; http://dx.doi.org/10.1083/jcb.153.2.273
- Bharadwaj S, Vasanth G, Masuelli L, Thanawala R, Prasad G. Inhibition of Nuclear Accumulation of Phosphorylated ERK by Tropomyosin-1–Mediated Cytoskeletal Reorganization. J Cancer Mol 2008; 4:139-44
- Adachi M, Fukuda M, Nishida E. Nuclear export of MAP kinase (ERK) involves a MAP kinase kinase (MEK)-dependent active transport mechanism. J Cell Biol 2000; 148:849-56; PMID:10704436; http://dx.doi.org/10.1083/jcb.148.5.849
- Wortzel I, Seger R. The ERK Cascade: Distinct Functions within Various Subcellular Organelles. Genes Cancer 2011; 2:195-209; PMID:21779493; http://dx.doi.org/10.1177/1947601911407328
- White CD, Brown MD, Sacks DB. IQGAPs in cancer: a family of scaffold proteins underlying tumorigenesis. FEBS Lett 2009; 583:1817-24; PMID:19433088; http://dx.doi.org/10.1016/j.febslet.2009.05.007
- Ren JG, Li Z, Sacks DB. IQGAP1 modulates activation of B-Raf. Proc Natl Acad Sci U S A 2007; 104:10465-9; PMID:17563371; http://dx.doi.org/10.1073/pnas.0611308104
- Niu J, Mo Q, Wang H, Li M, Cui J, Li Z. Invasion inhibition by a MEK inhibitor correlates with the actin-based cytoskeleton in lung cancer A549 cells. Biochem Biophys Res Commun 2012; 422:80-4; PMID:22560902; http://dx.doi.org/10.1016/j.bbrc.2012.04.109
- Pierce GB. Neoplastic stem cells. Adv Pathobiol 1977; 6:141-52; PMID:899956
- Salmon SE. Applications of the human tumor stem cell assay to new drug evaluation and screening. Prog Clin Biol Res 1980; 48:291-312; PMID:7193873
- Kumar SM, Liu S, Lu H, Zhang H, Zhang PJ, Gimotty PA, Guerra M, Guo W, Xu X. Acquired cancer stem cell phenotypes through Oct4-mediated dedifferentiation. Oncogene 2012; 31(47):4898-911
- Daley GQ. Common themes of dedifferentiation in somatic cell reprogramming and cancer. Cold Spring Harb Symp Quant Biol 2008; 73:171-4; PMID:19150965; http://dx.doi.org/10.1101/sqb.2008.73.041
- Kim JB, Greber B, Araúzo-Bravo MJ, Meyer J, Park KI, Zaehres H, Schöler HR. Direct reprogramming of human neural stem cells by OCT4. Nature 2009; 461:649-3; PMID:19718018; http://dx.doi.org/10.1038/nature08436
- Lin SL, Chang DC, Ying SY, Leu D, Wu DT. MicroRNA miR-302 inhibits the tumorigenecity of human pluripotent stem cells by coordinate suppression of the CDK2 and CDK4/6 cell cycle pathways. Cancer Res 2010; 70:9473-82; PMID:21062975; http://dx.doi.org/10.1158/0008-5472.CAN-10-2746
- Lin SL, Chang DC, Lin CH, Ying SY, Leu D, Wu DT. Regulation of somatic cell reprogramming through inducible mir-302 expression. Nucleic Acids Res 2011; 39:1054-65; PMID:20870751; http://dx.doi.org/10.1093/nar/gkq850
- Fareh M, Turchi L, Virolle V, Debruyne D, Almairac F, de-la-Forest Divonne S, Paquis P, Preynat-Seauve O, Krause KH, Chneiweiss H, et al. The miR 302-367 cluster drastically affects self-renewal and infiltration properties of glioma-initiating cells through CXCR4 repression and consequent disruption of the SHH-GLI-NANOG network. Cell Death Differ 2012; 19:232-44; http://dx.doi.org/10.1038/cdd.2011.89
- Bourguignon LY, Wong G, Earle C, Chen L. Hyaluronan-CD44v3 interaction with Oct4/Sox2/Nanog promotes miR-302 expression leading to self-renewal, clonal formation and cisplatin resistance in cancer stem cells from head and neck squamous cell carcinoma. J Biol Chem 2012; 287(39):32800-24; PMID:22847005; http://dx.doi.org/10.1074/jbc.M111.308528
- Lipchina I, Elkabetz Y, Hafner M, Sheridan R, Mihailovic A, Tuschl T, Sander C, Studer L, Betel D. Genome-wide identification of microRNA targets in human ES cells reveals a role for miR-302 in modulating BMP response. Genes Dev 2011; 25:2173-86; PMID:22012620; http://dx.doi.org/10.1101/gad.17221311
- Judson RL, Babiarz JE, Venere M, Blelloch R. Embryonic stem cell-specific microRNAs promote induced pluripotency. Nat Biotechnol 2009; 27:459-61; PMID:19363475; http://dx.doi.org/10.1038/nbt.1535
- Theunissen TW, van Oosten AL, Castelo-Branco G, Hall J, Smith A, Silva JC. Nanog overcomes reprogramming barriers and induces pluripotency in minimal conditions. Curr Biol 2011; 21:65-71; PMID:21194951; http://dx.doi.org/10.1016/j.cub.2010.11.074
- Ding VM, Ling L, Natarajan S, Yap MG, Cool SM, Choo AB. FGF-2 modulates Wnt signaling in undifferentiated hESC and iPS cells through activated PI3-K/GSK3beta signaling. J Cell Physiol 2010; 225:417-28; PMID:20506199; http://dx.doi.org/10.1002/jcp.22214
- Armstrong L, Hughes O, Yung S, Hyslop L, Stewart R, Wappler I, Peters H, Walter T, Stojkovic P, Evans J, et al. The role of PI3K/AKT, MAPK/ERK and NFkappabeta signalling in the maintenance of human embryonic stem cell pluripotency and viability highlighted by transcriptional profiling and functional analysis. Hum Mol Genet 2006; 15:1894-913; http://dx.doi.org/10.1093/hmg/ddl112