
ABSTRACT
Drug resistance has always been the main problem in osteosarcoma treatment, and hypoxia seems to be one of the many causes for drug resistance. Therefore, in this study, we investigated how hypoxia triggers chemotherapy resistance in osteosarcoma. We first screened hypoxia- and normoxia- cultured osteosarcoma cells in silico to identify the differentially expressed genes specifically related to drug resistance. This led to the identification of spindle and kinetochore associated complex subunit 1 (SKA1) as a probable gene of interest. SKA1 was further overexpressed by a lentiviral vector into an osteosarcoma cell line to study its role in chemoresistance. Our data revealed that SKA1 overexpression reduced the expression of some multidrug resistance genes, and enhanced the sensitivity of two common chemotherapeutic drugs used in osteosarcoma patients, epirubicin (EPI) and ifosfamide (IFO). In addition, we also confirmed the role of SKA1 in EPI drug sensitivity in vivo. Taken together, our study indicated that hypoxia mediated downregulation of SKA1 expression increased the chemotherapy resistance in human osteosarcoma cells.
Abbreviations
| SKA1 | = | spindle and kinetochore associated complex subunit 1 |
| INSR | = | insulin receptor |
| ABCB1 | = | ATP-binding cassette sub-family B member 1 |
| ABCC2 | = | ATP-binding cassette sub-family C member 2 |
| GSTP1 | = | glutathione S-transferase pi 1 |
| MDR1 | = | multidrug resistance protein 1 |
| MRP2 | = | multidrug resistance-associated protein 2 |
| EPI | = | epirubicin |
| IFO | = | ifosfamide |
| GO | = | Gene ontology |
| qRT-PCR | = | quantitative real-time polymerase chain reaction |
| MOI | = | multiplicity of infection |
| CCK8 | = | Cell Counting Kit-8 |
| IC50 | = | half maximal inhibitory concentration |
Introduction
Osteosarcoma is the most common malignant bone tumor in the adolescent age group and has very low 5-year and 10-year survival rates.Citation1,2 Although the combination of surgery and neoadjuvant chemotherapy has improved the survival rate and the quality of life for osteosarcoma patients, the issue of chemoresistance development has sustained and pose a great challenge.Citation3,4 When a tumor shows resistance to multiple drugs at the same time, it is usually termed as multidrug resistance (MDR).Citation5 Presently, MDR has become the major challenge for osteosarcoma therapy. Therefore, a deep understanding of the mechanism of drug resistance development will lead to the design of more effective therapies for osteosarcoma patients.
Among the many factors that contribute to the development of chemoresistance, hypoxia is generally believed to play an important role, especially in solid tumors, such as colon cancer, breast cancer, osteosarcoma, and others. Hypoxia-inducible factor 1-α (HIF-1α), which is the most important and highly specific transcriptional regulator and is elevated during the hypoxic adaptive response, has been shown to be correlated with a poor prognosis and the development of chemotherapy resistance.Citation6-8 In a hypoxic environment, HIF-1α is stabilized and forms a dimer with HIF-1β (another subunit of HIF-1), and then translocates to the nucleus to regulate the transcription of over 100 target genes, many of which are directly or indirectly involved in drug resistance.Citation9 However, the exact mechanism of how hypoxia exerts its biologic functions is not very clear. Therefore, the aim of the present study was to examine how hypoxia contributes to the development of chemoresistance in human osteosarcoma cells and to identify which downstream genes are involved in its regulation.
Materials and methods
Cell line and hypoxia treatment
The human osteosarcoma cell line SOSP-9607 was established and maintained as described previously by the Othopaedic Oncology Laboratory of Tangdu Hospital, Xi'an, China.Citation10 The human osteosarcoma cell line MG63 and SaOS-2 were obtained from Chinese Academy of Sciences (Shanghai, China) and grown in DMEM medium (SH3022.01B, HyClone) containing 10% fetal bovine serum (SV30087.02, HyClone). Hypoxic tumor cells were obtained by culturing them in a pre-set (1% O2, 5% CO2, and 94% N2) multi-gas incubator (SANYO, Japan) at 37 °C. Normoxic tumor cells were obtained by culturing them in another incubator (THERMO, USA) at 37 °C under a humidified 21% O2 and 5% CO2 atmosphere.
Microarray analysis
Cells were grown under hypoxic or normoxic conditions for 96 hrs, respectively, in triplicate. Total RNA was then extracted using Trizol reagent (15596026, Invitrogen), quantified with a NanoDrop ND-2000 instrument (Thermo Scientific), and the purity was tested by an Agilent Bioanalyzer 2100 (Agilent Technologies). The array hybridization was performed using the Human V2, G4845A/26652 gene array (Agilent). Gene ontology (GO) software was used to generate the molecular function profile and to identify the cellular components of the genes and the biologic processes in which these genes are involved. Pathway analysis was accomplished using the KEGG database. Bioinformatics was used to select the candidate genes. Later, further validation of the identified genes was performed by quantitative real-time polymerase chain reaction (qRT-PCR).
Lentiviral infection
Lentiviral vectors containing the green fluorescent protein gene were used to individually clone hypoxia-inducible factor 1 α (HIF-1α) - cDNA (LV- HIF-1α-GFP), spindle and kinetochore associated complex subunit 1 (SKA1) - cDNA (LV-SKA1-GFP) and scrambled control (LV-GFP) by Genechem Company (Genechem, China), and later the lentiviral particles were generated using these vectors. Next, a total of 1.5 × 10⁵ tumor cells, grown under normoxia or hypoxia conditions for 24 hrs were seeded into 6-well plates in a complete RPMI 1640 medium without antibiotics. Upon reaching 30% confluence after 24 hrs, these cells were infected with LV- HIF-1α-GFP or LV-SKA1-GFP containing lentiviral particles at a multiplicity of infection of 50 plaque-forming units per cell (MOI = 50). The LV-GFP (negative control group) infected cells or noninfected group (NC) cells were both used as controls. Subsequently, the infected cells were selected in the presence of 2 μg/mL of puromycin (58–60–6, Sigma) for 2 weeks and then maintained in complete medium containing 1 μg/mL puromycin to create stable HIF-1α and SKA1 -overexpressing cells. Finally, the stable cells were analyzed by qRT-PCR and western blot analysis to validate the overexpression.
qRT-PCR
Total RNA was extracted from the cells with Trizol reagent (15596026, Invitrogen) and reverse transcribed with the PrimeScript RT Reagent Kit (Takara, Japan), according to the manufacturers' instructions. The qRT-PCR was then performed using the ABI PRISM® 7900HT real-time PCR system. The β-actin gene was used as an internal control. The following primer sequences were used for gene amplification:
HIF-1α, 5′-ATCTCCATCTCCTACCCACATACA-3′ (sense)and 5′-CCTACTGCTTGAAAAAGTGAACCA-3′ (antisense);
SKA1, 5′-ATGAAGAAACGAAGGATACCAAAG-3′ (sense) and 5′-CCTCGGACCTCTGATAGCC-3′ (antisense);
ATP-binding cassette sub-family B member 1 (ABCB1), 5′-CCCATCATTGCAATAGCAGG-3′ (sense) and 5′-GTTCAAACTTCTGCTCCTGA-3′ (antisense);
ATP-binding cassette sub-family C member 2 (ABCC2), 5′-GACAATTCTAATCTAGCCTACTCC-3′ (sense) and 5′-CATCAACTTCCCAGACATCC-3′ (antisense);
glutathione S-transferase pi 1 (GSTP1), 5′-GTCCAATACCATCCTGCGTCAC-3′ (sense) and 5′-CATCCTTGCCCGCCTCATAG-3′ (antisense);
β-actin, 5′-GGCGGCACCACCATGTACCCT-3′ (sense) and 5′-AGGGGCCGGACTCGTCATACT-3′ (antisense). All amplifications were performed in triplicate. The differential expression levels of mRNAs were calculated using the 2−ΔΔCT method: CT = (CTtarget − CTcontrol)Sample 2 − (CTtarget − CTcontrol)Sample 1.Citation11 Finally, the results were analyzed using the ABI 7900HT software system (Applied Biosystems, USA).
Western blot analysis
Cells were washed with phosphate-buffered saline 3 times and then lysed using RIPA lysis buffer (R0278, Sigma) with a protease inhibitor cocktail (04693116001, Roche Life Science). Total proteins were quantified with the BCA Protein Assay Kit (23227, Thermo Scientific), and equal amounts of protein samples (25 μg) were separated by polyacrylamide gel electrophoresis. Next, the proteins were transferred onto PVDF membranes (IPVH00010, Millipore), and these membranes were then incubated overnight with primary antibodies against HIF-1α (dilution: 1:1000, ab16066), SKA1 (dilution: 1:1000, ab118586), multidrug resistance protein 1 (MDR1) (dilution: 1:1000, ab170904), multidrug resistance-associated protein 2 (MRP2) (dilution: 1: 50, ab3373), and glutathione S-transferase pi 1(GSTP1) (dilution: 1:1000, ab153949), which were all purchased from Abcam Company. The monoclonal β-actin antibody (dilution: 1:1000, 66009–1-Ig), obtained from Proteintech Group Inc., was used as a housekeeping control gene. Later, these membranes were washed with Tris-buffered saline containing Tween 20 and then incubated with horseradish peroxidase-conjugated secondary antibody (1:1000 dilution, sc-2005, sc-2004, Santa Cruz) for 1 hr at 37 °C. The specific protein signals were detected using a chemiluminescence detection system (32106, Pierce), according to the manufacturer's instructions, and quantified by Quantity One software (Bio-Rad, USA).
Chemotherapeutic sensitivity assay
The proliferation of control and SKA1-overexpressing SOSP-9607 cells, under hypoxic and normoxic conditions, respectively, was evaluated by Cell Counting Kit-8 (CCK8) assays, according to the manufacturer's instructions. A total of 1.7 × 10⁴ cells were seeded into each well of a 96-well plate in 100 μL of RPMI 1640 medium. Epirubicin (EPI) and ifosfamide (IFO) were then added at gradient concentrations in normal growth medium after 24 hrs of plating. The cells were cultured for another 48 hrs, then 10 μL of CCK8 reagent was added, and the cells were again cultured for an additional 3 hrs. Finally, the absorbance at 450 nm was measured with a multiscan reader (Thermo, USA). Each experiment was performed in triplicate, and the drug resistance index was analyzed by calculating the half maximal inhibitory concentration (IC50).
Tumor xenograft assay
Four-week-old female nude mice, provided by the Animal Center of Fourth Military Medical University, were subcutaneously injected with 1 × 10⁶ NC cells, GFP cells, or SKA1-overexpressing cells, in the right flank region. Each group contained 6 animals. The treatment regimen began when the tumors reached a volume of 50 mm3. EPI (10 mg/kg body weight) was given once a week by intraperitoneal injection. The tumor volume (V) was calculated every week by measuring the length (L) and width (W) of the tumor by the following formula: V = [W × L × (W + L)/2] × 0.52.Citation12 The animals were euthanatized at 6 weeks after tumor cell injection due to the large tumor burden. The two representative animals in each killed group were pictured, and the tumor weights were recorded. All animal operations were strictly performed by the rules provided by the Declaration of Helsinki of 1975 and approved by the Ethics Committee of the Fourth Military Medical University.
Immunohistochemistry
Paraffin-embedded specimens were collected from 30 osteosarcoma patients (15 male and 15 female; mean age, 19 y old; age range, 9–36 y old) who underwent chemotherapy and then surgery in Tangdu Hospital, Fourth Military Medical University (Xi'an, China) between May 2010 and January 2015. Specimens were sub-classified as fibroblastic (n = 5), small round cell tumor (n = 6), osteoblastic (n = 9), telangiectatic (n = 7) and general type (n = 3). All studies were approved by the Ethics Committee of the Fourth Military Medical University, and written informed consents were provided by patients or their relatives.
Immunohistochemical staining was performed following the instructions provided by Abcam Company (Abcam, USA). The 1:100 dilution of the SKA1 antibody (ab118586, Abcam) was used for staining. In negative control staining, the primary antibody was replaced by PBS, and as a positive control A549 cells were used as suggested by the antibody manufacturer. After staining with SKA1 antibody, the 3 fields under each magnification were randomly selected and captured for every tissue and cell line specimens. The final expression of SKA1 was scored as negative (-), weak positive (+), moderate positive (++) and strong positive (+++), according to the percentage and intensity of staining by 2 pathologists independently. Subsequently, tumor specimens scored as “–“ or “+” were classified as low expression, while score of “++” or “+++” indicated high expression.
Statistical analysis
If not specified otherwise, each data point consisted of at least 3 replicates, and statistically significant differences between the data were determined by SPSS 20.0 (Chicago, IL, USA) or GraphPad Prism software (Science Inc., San Diego, CA, USA), using the Student's t test or one-way analysis of variance. A P value of < 0.05 was considered to be statistically significant.
Results
Hypoxia induced HIF-1α expression in human osteosarcoma cells
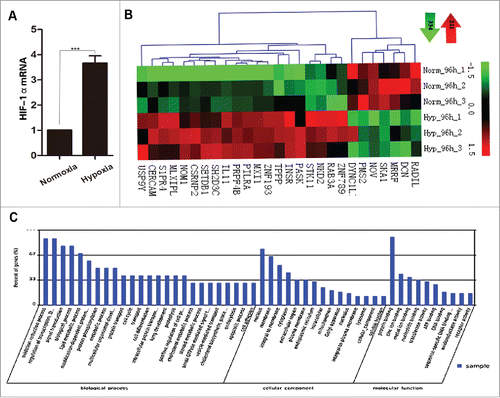
The expression of HIF-1α, a marker of hypoxia was examined in the osteosarcoma cells, by treating SOSP-9607 cells with different concentrations of oxygen. The qRT-PCR analysis showed that the expression of HIF-1α mRNA was significantly elevated in hypoxia-induced cells, with an average elevation of 3.66-fold (P = 0.000338) compared with the control cells (normoxia) ( P < 0.001).
Figure 1. Analysis of HIF-1α mRNA expression under hypoxic and normoxic conditions and microarray analysis. (A) qRT-PCR-based detection of HIF-1α mRNA expression in SOSP-9607 osteosarcoma cells under hypoxic (1% O2) and normoxic (21% O2) conditions. β-actin was used as an internal control. Experiments were performed in 3 biologic replicates, and the fold changes were calculated by the 2−ΔΔCT method (P < 0.05). (B) The heatmap of the microarray data derived from hypoxia- and normoxia- treated SOSP-9607 osteosarcoma cells. The green color represented downregulation, and the red color represented upregulation of gene expression. A total of 545 genes that were altered significantly under hypoxic conditions were identified (P < 0.05). (C) The categorization of genes based on GO enrichment. *P < 0.05, **P < 0.01, ***P < 0.001.
Microarray analysis of genes induced by hypoxia
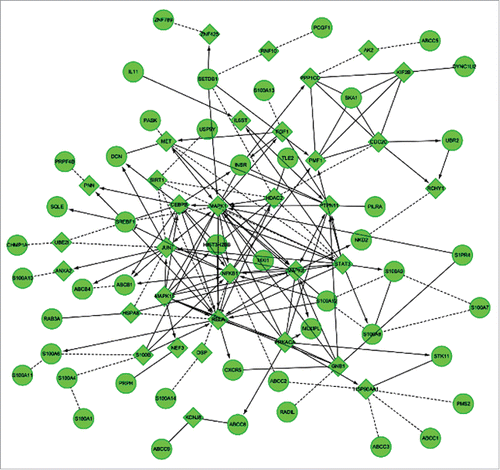
Next, to identify the genes that might be regulated as a result of hypoxia induction in osteosarcoma cells, we performed a microarray analysis. Cells cultured both under 1% O2 (hypoxia) and under 21% O2 (normoxia) for 96 hrs were used for microarray analysis. Based on this analysis, 545 differentially expressed genes, whose expression was either significantly up- or down- regulated (P < 0.05), were identified (). Further categorization of these genes according to their molecular function and biologic processes resulted in the identification of 60 genes that might participate in chemoresistance (). The top 30 genes are shown in . Bioinformatics analysis allowed us to construct a gene-network that displays the relationship between these identified genes and their correlation with downstream genes that related to chemoresistance (). Based on this network and literature review, we selected spindle and kinetochore associated complex subunit 1 (SKA1) and insulin receptor (INSR) as the most suspected genes that might play a pivotal role in the process of chemoresistance of human osteosarcoma. According to our microarray analysis, the SKA1 gene expression was downregulated by 3.67-fold in hypoxic conditions, while INSR expression was upregulated by 2.41-fold (P < 0.05). To further validate these microarray results independently, we performed qRT-PCR analysis and observed that the expression of the SKA1 gene was decreased by 2.59-fold, while INSR expression was decreased by 2.10-fold, instead of the increased expression observed in the microarray data of hypoxia-cultured osteosarcoma cells. Thus, this independent verification of the microarray data only confirmed the SKA1 expression; therefore, we focused our attention on the SKA1 gene as a possible downstream target of HIF-1α, and might be involved in chemoresistance regulation of osteosarcoma cells.
Table 1. Top 30 genes up- or downregulated in human osteosarcoma cells SOSP-9607 under hypoxic conditions.
Figure 2. Construction of the gene network based on bioinformatics analysis. Arrows represented increasing expression, T-arrows represented inhibition, and dotted lines represented predicted related genes. Genes in the circles showed differentially expression, which was greater than 2-fold and P < 0.05. Genes in the rhombus were linker genes that were added by the computer system.
Analysis of the direct correlation between HIF-1α and SKA1 gene expression in multiple osteosarcoma cell lines
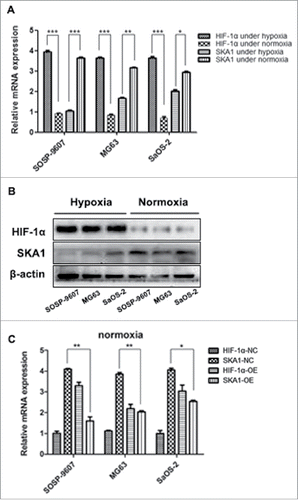
As we identified that SKA1 gene to be the probable central player under hypoxic conditions, we further analyzed its correlation with HIF-1α gene expression in multiple human osteosarcoma cell lines: SOSP-9607, MG63, and SaOS-2. The expression analysis of both these genes was performed in parallel at the mRNA and protein levels, under hypoxia (1% O2) and normoxia (21% O2) for 96 hrs. Our results displayed increased HIF-1α mRNA expression and reduced SKA1 mRNA expression in all 3 cell lines under hypoxic conditions. However, this trend reversed under normoxia, where SKA1 mRNA level showed higher expression than HIF-1α (). Similar trends of HIF-1α and SKA1 expression were observed at the protein level (). To further confirm the direct correlation between HIF-1α and SKA1 expression, we overexpressed HIF1α protein using lentiviral vector in osteosarcoma cells under normoxia condition. Our results indicated that HIF1α overexpression led to a significant reduction in the SKA1 mRNA expression in all 3 tumor cell lines (). Interestingly, the osteosarcoma cell line, SOSP-9607 showed much sharper decrease in SKA1 mRNA expression compared with other 2 cell lines. Therefore, this cell line was subsequently selected to perform further experiments.
Figure 3. Analysis of HIF-1α and SKA1 expression in 3 human osteosarcoma cell lines. (A) mRNA expression of HIF-1α and SKA1 in SOSP-9607, MG63, and SaOS-2 cells under 1% O2 and 21% O2 for 96 hrs respectively as measured by qRT-PCR. (B) Protein expression of HIF-1α and SKA1 under hypoxic and normoxic conditions, as measured by western blot. (C) HIF-1α was overexpressed in 3 human osteosarcoma cell lines under normoxia, and the expression of HIF-1α and SKA1 were both measured by qRT-PCR. HIF-1α-NC and SKA1-NC represented HIF-1α and SKA1 expression under normoxia, respectively; HIF-1α-OE and SKA1-OE represented HIF-1α and SKA1 expression under normoxia in HIF-1α overexpressing cells, respectively. Both qRT-PCR and western blot analyses results were normalized with β-actin.*P < 0.05, **P < 0.01, ***P < 0.001.
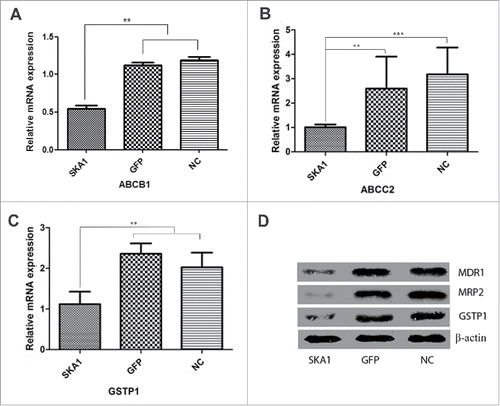
SKA1 overexpression significantly reduced the expression of MDR-related genes
To understand the link between SKA1 overexpression and chemoresistance, we first overexpressed SKA1 by lentiviral vector in osteosarcoma cell line SOSP-9607. We observed a significant increase in the levels of SKA1, both at the mRNA ( P < 0.001) and protein () levels, compared with only GFP vector-infected cells or noninfected cells. Next, we analyzed the expression of the most represented MDR-related genes, such as ABCB1 (also known as MDR1), ABCC2 (also known as MRP2), and GSTP1 in SKA1-overexpressing cells. The qRT-PCR analysis showed that the SKA1-overexpressing cells had decreased expression of ABCB1, ABCC2, and GSTP1 mRNA, compared with the cells from the GFP vector or NC group ( and P < 0.01). Similarly, SKA1-overexpressing cells also exhibited reduced protein expression of these multidrug resistant genes as seen in .
Figure 4. Analysis of SKA1 expression in osteosarcoma SOSP-9607 cells infected with LV-SKA1-GFP, LV-GFP and NC cells. (A) mRNA expression of SKA1 in human osteosarcoma SOSP-9607 cells infected with LV-SKA1-GFP, LV-GFP and NC cells, as measured by qRT-PCR. (B) SKA1 protein expression as measured by western blot. Both qRT-PCR and western blot analyses results were normalized with β-actin. *P < 0.05, **P < 0.01, ***P < 0.001.
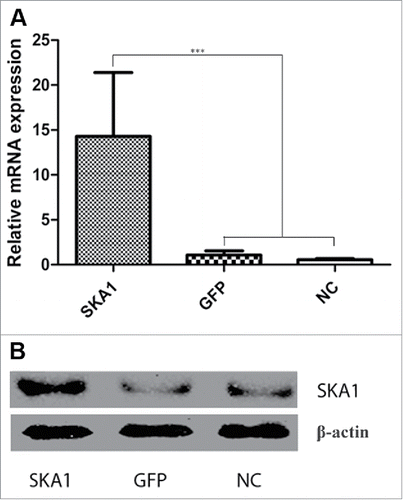
Figure 5. Analysis of ABCB1, ABCC2, and GSTP1 expression in SOSP-9607 osteosarcoma cells overexpressing SKA1 under hypoxia. The mRNA expression of ABCB1 (A), ABCC2 (B), and GSTP1 (C) in human osteosarcoma SOSP-9607 cells infected with LV-SKA1-GFP, LV-GFP and uninfected NC cells under 1% O2, as measured by qRT-PCR. (D) Protein expression of MDR1, MRP2, and GSTP1 in infected SOSP-9607 cells under 1% O2 as measured by western blot. Both qRT-PCR and western blot analyses results were normalized with β-actin. *P < 0.05, **P < 0.01, ***P < 0.001.
SKA1 overexpression reversed the drug resistance in human osteosarcoma cells
Next, to understand the role of SKA1 in drug resistance, we studied its effect on the drug sensitivity of 2 chemotherapeutic drugs, EPI and IFO, commonly used for osteosarcoma at clinic in the orthopedic Department of Tangdu Hospital (Xi'an, China), by performing CCK8 assay. Our data revealed that the sensitivity of SKA1-overexpressing osteosarcoma cells to EPI and IFO increased to varying degrees compared with the GFP or NC group, especially under hypoxic conditions (). Thus, this data demonstrated that overexpression of SKA1 significantly decreased the IC50 values for EPI and IFO in osteosarcoma (P < 0.05).
Table 2. IC50 values for anticancer drugs in human osteosarcoma SOSP-9607 cells.
SKA1 overexpression increased in vivo drug sensitivity
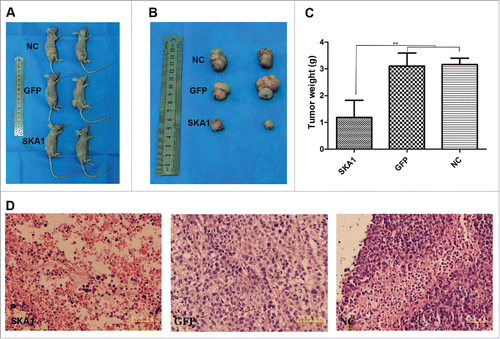
Finally, to verify the effects of SKA1 overexpression on the in vivo drug sensitivity, we injected stable SKA1-overexpressing cells, vector cells, and noninfected cells into nude mice subcutaneously. After the tumors reached a certain size, EPI was administered to the mice once a week. At day 7 after cells injection, we measured the tumor volumes in all 3 groups, which were 43.79 mm3, 46.41 mm3,and 45.49 mm3, respectively, and there was no significant difference in tumor volumes before drug treatment. However, after EPI treatment of 7 days, the tumors from the different groups started to exhibit a noticeable difference in their volumes. Finally, 5 weeks after chemotherapy, the growth of the SKA1-overexpressed tumor cells was remarkably inhibited as compared with the vector or NC cells treated with EPI ( and ). Later, the tumors were excised and their weights were measured. The mean tumor weights of the SKA1, GFP, and NC groups were 1.18 g, 3.11 g, and 3.17 g, respectively ( P < 0.01). Histopathological examination of the dissected tissues revealed that there was more necrosis in the tumors from the SKA1 group than the GFP and NC groups (), demonstrating that chemotherapy was more effective in the SKA1 group.
Figure 6. Analysis of SKA1 drug-sensitizing effects using xenograft model. SOSP-9607 osteosarcoma cells stably infected with LV-SKA1-GFP (lower row) or LV-GFP (middle row), or NC cells without infection (upper row) were injected into the right flanks of nude mice, and epirubicin was administered subcutaneously. (A) Representative mice killed at 6 weeks after tumor cell injection, (B) Excised tumors, (C) Average tumor weights from 3 groups, and (D) Hematoxylin and eosin staining of dissected tumor tissues from the 3 groups (SKA1, left; GFP, middle; NC, right). Among these, the SKA1 group (left panel) showed more necrosis. Bar, 50 µM, Magnification, ×400. *P < 0.05, **P < 0.01, ***P < 0.001.
Osteosarcoma patients displayed low SKA1 protein expression
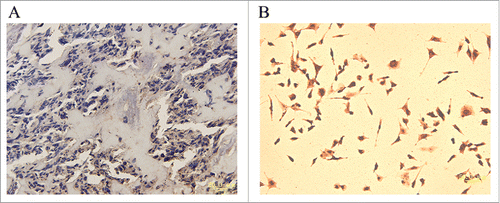
Finally, we also tested SKA1 expression in 30 human tissue specimens derived from osteosarcoma patients who were given chemotherapy before surgery operation. Our immunohistochemical analysis data revealed that overall there was low SKA1 expression among all 30 analyzed patient specimens. More specifically, 13 specimens showed very low or negative expression, while other 17 displayed weak positive expression. However, positive control consisting of A549 cells showed strong positive signal ().
Figure 7. Analysis of SKA1 expression in human osteosarcoma specimens. (A) Weak positive staining of SKA1 in human osteosarcoma. Magnification, ×400. (B) SKA1 staining in positive control, A549 cells. Magnification, ×200.
Discussion
The microenvironment of solid tumors is usually characterized by hypoxia, which is widely believed to contribute to chemotherapy resistance. However, the mechanism of the hypoxia contribution to chemoresistance is not very clear. In this study, we revealed that SKA1 downregulation significantly contributed to chemoresistance under conditions of oxygen deprivation, while its overexpression significantly increased the drug sensitivity of osteosarcoma cells.
SKA1 protein has been shown to be a necessary mitotic component for accurate chromosomal segregation and cell division, which promotes the binding of kinetochore and tubulin.Citation13-16 It has been reported to track depolymerizing microtubules, bind to curved protofilaments, and promote centriole overduplication and centrosome amplification.Citation17 Recently, SKA1 has attracted much attention in the field of cancer research due to its important role in the cell growth of gastric and hepatocellular carcinomas and acting as a biomarker in some other cancers.Citation18-20 However, the role of SKA1 in mediating the osteosarcoma chemoreisitance is still vague. In our study, we simulated the hypoxic environment using a multi-gas incubator and found that the expression of SKA1 was significantly decreased in the osteosarcoma cells cultured under 1% O2, compared with those cultured under 21% O2. In addition, the GO software suggested that this gene might be related to chemotherapy resistance.
Since hypoxia resulted in a reduced expression of SKA1, we established an overexpression system using a lentiviral vector to overexpress SKA1 to study its role in chemoresistance. Our results suggested that SKA1 overexpression resulted in a significant reduction in the expression of 3 drug-resistance related genes: ABCB1, ABCC2, and GSTP1, both at the mRNA and protein levels. In addition, SKA1 overexpression also resulted in enhanced sensitivity to the drugs EPI and IFO, especially under hypoxic conditions. The sensitivity of osteosarcoma cells SOSP-9607 to EPI and IFO also slightly increased under normoxic conditions compared with hypoxic conditions, probably because the expression level of SKA1 was already high under normoxia, and further overexpression of SKA1 might not had that significant effect as it did under hypoxia condition. The rationale of focusing on these 2 drugs was due to their frequent use in the clinic and easy availability. The effect of SKA1 overexpression on the sensitivity of EPI was further validated by an in vivo study. In addition, the expression of SKA1 was also analyzed in human osteosarcoma specimens, which displayed negative or weak positive expression in all 30 tissue samples. All these observations suggested that SKA1 was indeed important in osteosarcoma, which typically has low oxygen environment inside. These results are significant because the development of chemotherapy resistance has been a big obstacle for cancer patients. For solid tumors, many scientists have proven the relationship between hypoxia and drug resistance.Citation21-23 ABCB1 (MDR1), ABCC2 (MRP2), and GSTP1 are widely reported drug resistance genes, which help tumor cells to efflux the drugs out of the cells. Based on our study, we hypothesized that tumor cells, due to hypoxia, have a high expression of HIF1-α and a low expression of SKA1 and that the loss of SKA1 gene expression fails to suppress the expression of these MDR genes. Therefore, these genes allow the tumor cells to efflux the chemotherapy drugs, thus leading to the development of drug resistance.
In conclusion, our study made an attempt to identify the downstream target genes that are altered in the hypoxia-cultured osteosarcoma cell line SOSP-9607 by microarray analysis. We demonstrated that the expression of SKA1 was significantly decreased in a hypoxic environment. We further showed that SKA1 overexpression reduced the expression of MDR genes, ABCB1 (MDR1), ABCC2 (MRP2), and GSTP1, which could increase the sensitivity of chemotherapeutic drugs both in vitro and in vivo. Our study also suggested that SKA1 may function as a chemosensitizer in osteosarcoma, and a strategy to enhance its expression may prove to be beneficial for the treatment of osteosarcoma. Future studies are required to be undertaken to further investigate the mechanism of SKA1 gene mediated regulation of chemoresistance genes.
Ethical approval
All procedures performed in animal studies were according to guidelines suggested by Detailed Rules for Administration of Animal Experiments for Medical Research Purposes, issued by the Ministry of Health of the People's Republic of China. This study is in accordance with the 1964 Helsinki Declaration and its later amendments or comparable ethical standards and was approved by the Ethics Committee of Tangdu Hospital at the Fourth Military Medical University (permission number:2015036).
Disclosure of potential conflicts of interest
No potential conflicts of interest were disclosed.
Funding
This work was funded by the National Natural Science Foundation of China (NSFC, Grant No. 81201633, 81372297 and 81272441).
References
- Rejniak KA, Lloyd MC, Reed DR, Bui MM. Diagnostic assessment of osteosarcoma chemoresistance based on virtual clinical trials. Med Hypotheses 2015; 85:348-54; PMID:26130106; http://dx.doi.org/10.1016/j.mehy.2015.06.015
- Joseph CG, Hwang H, Jiao Y, Wood LD, Kinde I, Wu J, Mandahl N, Luo J, Hruban RH, Diaz LJ, et al. Exomic analysis of myxoid liposarcomas, synovial sarcomas, and osteosarcomas. Genes Chromosomes Cancer 2014; 53:15-24; PMID:24190505; http://dx.doi.org/10.1002/gcc.22114
- Jeon DG, Cho WH, Song WS, Kong CB, Cho SH, Lee JW, Lee SY. Correlation between fluid-fluid levels on initial mri and the response to chemotherapy in stage iib osteosarcoma. Ann Surg Oncol 2014; 21:1956-62; PMID:24577812; http://dx.doi.org/10.1245/s10434-014-3603-z
- Habel N, Hamidouche Z, Girault I, Patino-Garcia A, Lecanda F, Marie PJ, Fromigue O. Zinc chelation: a metallothionein 2a's mechanism of action involved in osteosarcoma cell death and chemotherapy resistance. Cell Death Dis 2013; 4:e874; PMID:24157868; http://dx.doi.org/10.1038/cddis.2013.405
- Xu Y, Qiu L. Nonspecifically enhanced therapeutic effects of vincristine on multidrug-resistant cancers when coencapsulated with quinine in liposomes. Int J Nanomedicine 2015; 10:4225-37; PMID:26170660; http://dx.doi.org/10.2147/IJN.S84555
- Roncuzzi L, Pancotti F, Baldini N. Involvement of hif-1alpha activation in the doxorubicin resistance of human osteosarcoma cells. Oncol Rep 2014; 32:389-94; PMID:24840054; http://dx.doi.org//10.3892/or.2014.3181
- Chen J, Ding Z, Peng Y, Pan F, Li J, Zou L, Zhang Y, Liang H. Hif-1alpha inhibition reverses multidrug resistance in colon cancer cells via downregulation of mdr1/p-glycoprotein. Plus One 2014; 9:e98882; PMID:26063960; http://dx.doi.org/10.1371/journal.pone.0098882
- Lin SC, Liao WL, Lee JC, Tsai SJ. Hypoxia-regulated gene network in drug resistance and cancer progression. Exp Biol Med (Maywood) 2014; 239:779-92; PMID:24812122; http://dx.doi.org/10.1177/1535370214532755
- Maxwell PH, Wiesener MS, Chang GW, Clifford SC, Vaux EC, Cockman ME, Wykoff CC, Pugh CW, Maher ER, Ratcliffe PJ. The tumour suppressor protein vhl targets hypoxia-inducible factors for oxygen-dependent proteolysis. Nature 1999; 399:271-5; PMID: 10353251; http://dx.doi.org/10.1038/20459
- Chen X, Yang TT, Wang W, Sun HH, Ma BA, Li CX, Ma Q, Yu Z, Fan QY. Establishment and characterization of human osteosarcoma cell lines with different pulmonary metastatic potentials. Cytotechnology 2009; 61:37-44; PMID: 20016965; http://dx.doi.org/10.1007/s10616-009-9239-3
- Livak KJ, Schmittgen TD. Analysis of relative gene expression data using real-time quantitative pcr and the 2(-delta delta c(t)) method. Methods 2001; 25:402-8; PMID: 11846609; http://dx.doi.org/10.1006/meth.2001.1262
- Rocha GZ, Dias MM, Ropelle ER, Osorio-Costa F, Rossato FA, Vercesi AE, Saad MJ, Carvalheira JB. Metformin amplifies chemotherapy-induced ampk activation and antitumoral growth. Clin Cancer Res 2011; 17:3993-4005; PMID: 21543517; http://dx.doi.org/10.1158/1078-0432.CCR-10-2243
- Schmidt JC, Arthanari H, Boeszoermenyi A, Dashkevich NM, Wilson-Kubalek EM, Monnier N, Markus M, Oberer M, Milligan RA, Bathe M, et al. The kinetochore-bound ska1 complex tracks depolymerizing microtubules and binds to curved protofilaments. Dev Cell 2012; 23:968-80; PMID: 23085020; http://dx.doi.org/10.1016/j.devcel.2012.09.012
- Guimaraes GJ, Deluca JG. Connecting with ska, a key complex at the kinetochore-microtubule interface. EMBO J 2009; 28:1375-7; PMID: 19458608; http://dx.doi.org/10.1038/emboj.2009.124
- Hanisch A, Sillje HH, Nigg EA. Timely anaphase onset requires a novel spindle and kinetochore complex comprising ska1 and ska2. EMBO J 2006; 25:5504-15; PMID: 17093495; http://dx.doi.org/10.1038/sj.emboj.7601426
- Jeyaprakash AA, Santamaria A, Jayachandran U, Chan YW, Benda C, Nigg EA, Conti E. Structural and functional organization of the ska complex, a key component of the kinetochore-microtubule interface. Mol Cell 2012; 46:274-86; PMID: 22483620; http://dx.doi.org/10.1016/j.molcel.2012.03.005
- Li J, Xuan JW, Khatamianfar V, Valiyeva F, Moussa M, Sadek A, Yang BB, Dong BJ, Huang YR, Gao WQ. Ska1 over-expression promotes centriole over-duplication, centrosome amplification and prostate tumourigenesis. J Pathol 2014; 234:178-89; PMID: 24827423; http://dx.doi.org/10.1002/path.4407
- Dong C, Wang XL, Ma BL. Expression of spindle and kinetochore-associated protein 1 is associated with poor prognosis in papillary thyroid carcinoma. Dis Markers 2015; 2015:616541; PMID:26063960; http://dx.doi.org/10.1155/2015/616541
- Sun W, Yao L, Jiang B, Guo L, Wang Q. Spindle and kinetochore-associated protein 1 is overexpressed in gastric cancer and modulates cell growth. Mol Cell Biochem 2014; 391:167-74; PMID: 24627241; http://dx.doi.org/10.1007/s11010-014-1999-1
- Qin X, Yuan B, Xu X, Huang H, Liu Y. Effects of short interfering rna-mediated gene silencing of ska1 on proliferation of hepatocellular carcinoma cells. Scand J Gastroenterol 2013; 48:1324-32; PMID: 24010405; http://dx.doi.org/10.3109/00365521.2013.828774
- Roncuzzi L, Pancotti F, Baldini N. Involvement of hif-1alpha activation in the doxorubicin resistance of human osteosarcoma cells. Oncol Rep 2014; 32:389-94; PMID:24840054; http://dx.doi.org/10.3892/or.2014.3181
- Li S, Sun W, Wang H, Zuo D, Hua Y, Cai Z. Research progress on the multidrug resistance mechanisms of osteosarcoma chemotherapy and reversal. Tumour Biol 2015; 36:1329-38; PMID:25666750; http://dx.doi.org/10.1007/s13277-015-3181-0
- Lv Y, Zhao S, Han J, Zheng L, Yang Z, Zhao L. Hypoxia-inducible factor-1alpha induces multidrug resistance protein in colon cancer. Onco Targets Ther 2015; 8:1941-8; PMID:26251616; http://dx.doi.org/10.2147/OTT.S82835