
ABSTRACT
Background: To investigate the expression of endothelin receptors in liver diseases and discuss its role in the process of liver cirrhosis and liver cancer.
Research design and methods: We examined the expressions of ETAR, ETBR and α-SMA in tissue samples using western blotting analysis. Furthermore, immunofluorescence was used to locate ETAR expression in hepatic stellate cells (HSCs) and hepatic sinusoidal endothelial cells (HSECs), we calculated the percentage of positive cells and then analyzed its relation with clinical indexes.
Results: According to the western blotting analysis, the expression of ETAR was high in hepatic hemangioma and liver cancer tissues and ETBR was highly expressed in cirrhosis tissues. The immunofluorescence results demonstrated that the expression of ETAR was elevated in hepatic hemangioma and liver cancer tissues. Moreover, ETAR expression was found in both HSCs and HSECs. Finally, the statistical analysis revealed that the number of positive ETAR cells was correlated with the clinical index platelets (PLT), alanine transaminase (ALT) and diameter of portal vein.
Conclusion: Endothelin receptors express differently in liver cirrhosis and liver cancer tissues and play a role in hepatic diseases by affecting HSCs and HSECs.
Abbreviations
| AFP | = | α fetoprotein |
| ALT | = | alanine transaminase |
| ETR | = | endothelin receptor |
| GGY | = | glutamyltranspeptidase |
| HSCs | = | hepatic stellate cells |
| HSECs | = | hepatic sinusoidal endothelial cells |
| HV | = | hepatitis virus |
| PLT | = | platelets |
| TBIL | = | total bilirubin |
Introduction
Liver cancer is cancer initialized in the liver, and can also be identified as hepatic carcinoma or primary hepatic carcinoma.Citation1 Primary liver cancer was the second highest cause of mortality and the sixth most severe cancer in 2014 around the world.Citation2 Liver cancer symptoms include pain in the right side of the chest, abdomen swelling, yellowish skin and weight loss. The main cause of liver cancer is cirrhosis due to either alcohol, the hepatitis C virus (HCV) or the hepatitis B virus (HBV).Citation3 While liver cancer is the last hit to the patients, cirrhosis is the beginning of the nightmare. In fact, cirrhosis is the fourth highest causes of death in central Europe and the fourteenth highest worldwide.Citation4 Due to the long-term damage caused by cirrhosis, the liver continuously remains in a dangerous status. This damage is characterized by the substitute of normal liver tissue by scar tissue.Citation5 Hepatic hemangioma is another disease which can lead to liver cancer. Hepatic hemangioma is a benign liver tumor which causes tangled blood vessels however, it typically does not cause any symptoms or require treatment.Citation6
Endothelin-1 (ET-1) was first isolated from porcine aortic endothelial cells by Yanagisawa in 1988.Citation7 Related studies have demonstrated that the endothelin peptide works by interacting with membrane receptors (ETAR, ETBR).Citation8 These receptors are present in all kinds of tissues including vascular smooth muscle, heart, brain and liver.Citation9 The ubiquitous distribution of endothelin peptides and receptors indicates its involvement in a wide variety of physiologic and pathological processes in the body.Citation10 Endothelin dysregulation is the cause of numerous diseases, one of which is liver cancer.Citation11 In addition, several clinical trials have evidenced that ET-1 receptor antagonism can affect liver function and has the potential to improve liver disease treatment.Citation12 In recent years, not many clinical studies have been conducted on the endothelin receptor. This is why we start our study at the expression of ETAR in liver cirrhosis and liver cancer.
Some studies have indicated that endothelins were related with hepatic stellate cells (HSCs).Citation13 Stellate cells are considered to be in a quiescent state in a normal liver and quiescent stellate cells account for 5–8% of liver cells.Citation14 The stellate cell plays an important role in liver fibrosis by forming scar tissue to treat liver damage.Citation15 To uncover the pathology of liver diseases, scientists found a relationship between liver cancer and hepatic stellate cells which were known as perisinusoidal cells in the perisinusoidal space of the liver cells.Citation16 Recent evidence demonstrates that stellate cells are liver-resident antigen-presenting cells and play a part in providing lipid antigens and increasing the amount of NKT cells. Stellate cells become active when the liver is damaged and these activated stellate cells can be characterized by proliferation, contractility and chemotaxis.Citation17 The related study shows that activated stellate cells can secrete collagen scar tissues and lead to cirrhosis.Citation18 Other studies have revealed that activated hepatic stellate cells can cause liver fibrosis in vivo.Citation19 All in all, HSC is closely related to liver disease and this has sparked research interest in the molecular function of activated HSCs.
In our study, we detected the expression of ETAR in tissue samples. Moreover, we investigated the positive expression of ETAR in HSCs and hepatic sinusoidal endothelial cells (HSECs). The relationships between ETAR, HSCs and HSECs were comprehensively analyzed, recorded and integrated with the clinical data. Finally, the correlation between ETAR and liver cirrhosis and liver cancer was uncovered.
Method and materials
Clinical data and sample collection
All samples were obtained from Tongji Hospital, Tongji Medical College of Huazhong University of Science and Technology. The primary hepatoma and para-carcinoma tissue samples were collected from 15 patients after liver cancer resection. We obtained the hepatic hemangioma tissue from 13 hepatic cavernous hemangioma patients. And the liver biopsy samples of 15 early liver cirrhosis patients were obtained as required: 1) diagnosed as positive HbsAg for over 6 months; 2) did not receive antiviral therapy and has positive HBV-DNA; 3) aged from 18 to 60; 4) obtained a Ishak score ≥ F5 within the last 6 months without anti-hepatic fibrosis or antiviral drugs; 5) has a Child-Pugh score < 7 (A grade); 6) voluntary basis.
We obtained the clinical data of 70 patients after liver cancer resection, 13 patients after hepatic hemangioma resection and 50 liver cirrhosis patients after liver biopsy. Specific statistical indexes were displayed including age, gender, alanine transaminase (ALT), total bilirubin (TBIL), glutamyltranspeptidase (GGY), α fetoprotein (AFP), chronic hepatitis b, liver cirrhosis, TNM, pathology type and tumor differentiation ().
Table 1. The clinical data of liver cancer patient.
Table 2. The clinical data of compensated cirrhosis patients.
Table 3. The clinical data of hepatic hemangioma patients.
Western blotting analysis
The liver tissue samples were treated with lysis solution containing PMSF (dilution 1:100), cocktail (dilution 1:1000) and phosphorylated protease inhibitor (dilution 1:100). After homogenizing, the proteins extracted from liver tissues samples were quantified using the Bradford method. These protein samples were then separated using SDS-PAGE under a 250mA current for 0.5hrs and transferred onto a PVDF membrane. Once the transferred membranes were blocked in 5% skim milk for 2hrs, blots were incubated for 2hrs with primary antibodies (ETAR (dilution 1:5000), ETBR (dilution 1:1000) and α-SMA (dilution 1:200)) diluted with 5% skim milk overnight. After the transferred membranes were blocked with TBST, blots were re-incubated for 45 minutes with second antibodies (1:2000) diluted with 5% skim milk. Subsequently, sections were blocked with TBST, treated with ECL plus, exposed to a Bio-Rad exposure meter and analyzed using the image-laboratory. System results were analyzed from gel images scanned by the imaging system.
Immunofluorescence
Representative sections of formalin-fixed, paraffin-embedded liver tissue were incubated with sodium borohydride (0.1%) for 10 minutes and with sudan black (0.5%) for 5 minutes. After being treated with 5% BSA blocking buffer for 30 minutes, liver tissue representative sections were incubated with the following primary antibodies: ETAR (dilution 1:2000), ETBR (dilution 1:100), CD31 and α-SMA at 4°C overnight. Subsequently, the sections were re-incubated with the following secondary antibodies: Goat Alexa 488 marked Anti-rabbit IgG and Cy3 marked Goat Anti-Mouse IgG for 50 minutes. Afterwards, the sections were washed with PBS, stained with 4',6-diamidino-2-phenylindole (DAPI), incubated in the dark for 8 minutes and sealed with glycerin. Finally, sections were observed through a Zeiss 710 Confocal Microscope.
Statistical analysis
Statistical analysis was conducted using the GraphPad Prism 5.0 software. All data are represented as mean ± standard deviation. Normality and homoscedasticity of the data distribution was verified before analysis. Comparisons made between groups were examined via variance analysis. Correlation analysis was performed using the correlation-linear method (P < 0.05 was considered statistically significant).
Results
Clinical index statistics
As seen in , the clinical indexes revealed that most liver cancer patients were chronic hepatitis B patients and in TNM Stage 1–2. Most liver cirrhosis patients had a Ishak score = F6 and a spleen thickness > 4.0 cm. The one way analysis of variance demonstrated that the mean age among the 3 groups ranged from 40 to 45 (P > 0.05). In addition, the value of AFP in the liver cancer group (12498.31 ± 25445.52) was significantly higher than in the liver cirrhosis (6.21 ± 3.89) and hepatic hemangioma groups (7.83 ± 5.83) (P<0.05). In regards to the internal portal vein diameter, the value in the liver cirrhosis group (1.23 ± 0.14) was higher than in the liver cancer (1.00 ± 0.18) and hepatic hemangioma groups (1.15 ± 0.16) (P < 0.05).
Expression of endothelin receptors in tissue samples
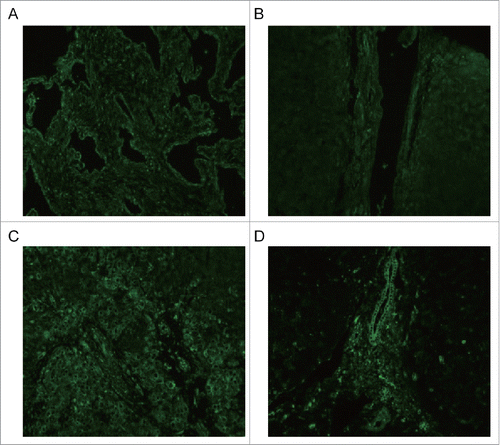
The tissue samples from 4 groups, hepatic hemangioma (X), liver cirrhosis (LC), liver cancer (C) and para-carcinoma (P), were measured for ETAR, ETBR and α-SMA expression through western blot assay. The results showed that ETAR was significantly expressed in hepatic hemangioma and liver cancer tissues while it had a low expression in liver cirrhosis and para-carcinoma tissues (). There was an obvious expression of ETBR in liver cirrhosis tissues, however, ETBR had almost no expression in other tissues (). The expression of α-SMA displayed a similar outcome as ETAR (). We found that α-SMA (a HSCs activation marker) had a connection with ETAR. Therefore, ETAR may participate in the formation of liver cirrhosis by affecting HSC. The immunofluorescence results also revealed that ETAR expression presents a green fluorescence on liver cancer cells membranes. These results were consistent with the western blotting results ().
Figure 1. Representative western blot of relative protein expression from tissue samples. X: hepatic hemangioma; LC: liver cirrhosis; C: liver cancer; P: pra-carcinoma.
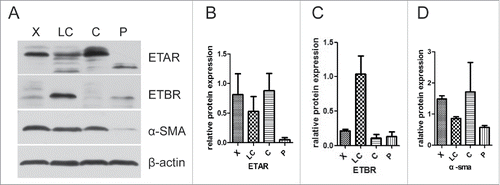
Figure 2. ETAR expression from tissue samples was visualized and localized by confocal microscopy. X: hepatic hemangioma; LC: liver cirrhosis; C: liver cancer; P: para-carcinoma.
ETAR expression in HSCs and HSECs
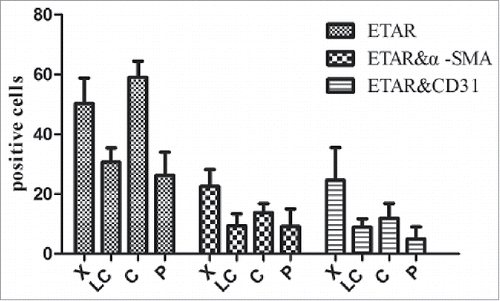
In the immunofluorescence experiment a green fluorescence represents ETAR, a red fluorescence represents α-SMA and CD31 (hepatic sinusoidal endothelial cells marker) and a yellow fluorescence represents both ETAR and α-SMA or CD31 (, ). ETAR on HSCs and endothelial cells could be located according to the position of the yellow fluorescence. The number of positive ETAR cells were counted and the statistical results were charted (). The results showed that the number of ETAR positive cells was significantly higher in the X and C group than in the LC and P group (P < 0.05). The number of ETAR and α-SMA positive cells was higher in the X group than in the other 3 groups (P < 0.05). There was not statistical difference in the number of ETAR and CD31 positive cells among 4 groups (P > 0.05).
Figure 3. ETAR expressions in HSCs. α-SMA was a positive control for HSCs. White arrowheads indicate dual staining and/or close proximity of α-SMA and ETAR expression which could be visualized in merged images. X: hepatic hemangioma; LC: liver cirrhosis; C: liver cancer; P: para-carcinoma.
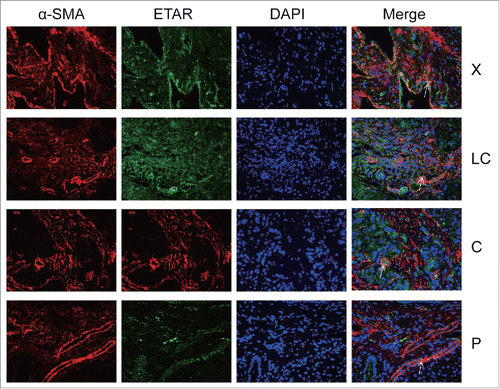
Figure 4. ETAR expressions in HSECs. CD31 was a positive control for HSECs. White arrowheads indicated dual staining and/or close proximity of α-SMA and ETAR expression which could be visualized in merged images. X: hepatic hemangioma; LC: liver cirrhosis; C: liver cancer; P: para-carcinoma.
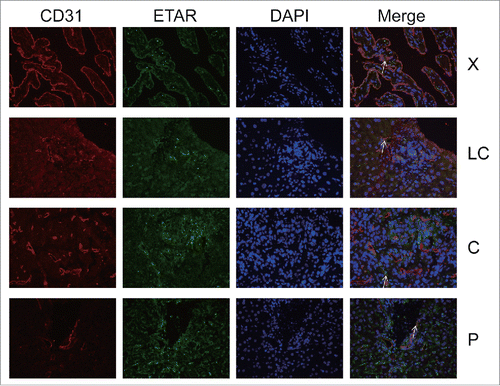
Figure 5. ETAR positive cells in liver tissue. X: hepatic hemangioma; LC: liver cirrhosis; C: liver cancer; P: para-carcinoma.
Correlation analysis between ETAR expression and clinical indexes
We measured the correlation between positive cells (ETAR, ETARandα-SMA, ETAR&CD31) and clinical indexes such as PLT, ALT, TBIL, GGT and portal vein diameter. The results demonstrated that ETAR positive cells were positively correlated with PLT (P = 0.035, Pearson = 0.473) and negatively correlated with portal vein diameter (P = 0.008, Pearson = −0.573) (, ). ETAR/α-SMA positive cells were negatively correlated with ALT (P = 0.047, Pearson = −0.449) (, ). ETAR/CD31 positive cells were negatively correlated with portal vein diameter (P = 0.032, Pearson = −0.339) (, ).
Figure 6. Correlation analysis of ETAR positive cells and clinical indexes. Liver function index included alanine transaminase (ALT), α fetoprotein (AFP), and platelet count (PLT).
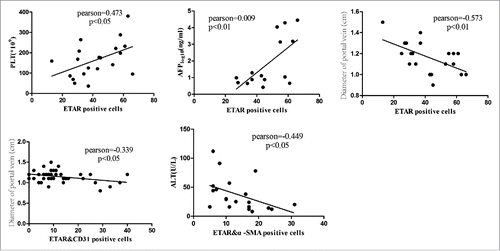
Table 4. The analysis of relationship between fluorescent staining results and clinical data.
Discussion
Liver cancer has drawn more and more attention over the last few years.Citation20 Liver cirrhosis caused by hepatic fibrosis is considered as an early symptom of liver cancer.Citation4 Some studies have shown that hepatic fibrogenesis was a comprehensive system which involved several liver cells such as hepatic stellate and Kupffer cells.Citation21 In liver injury, HSCs proliferate and acquire the characteristics of contractile cells.Citation22
Endothelin-1 (ET-1) is an effective endothelium-derived vasoactive peptide which has a large role in adjusting the vascular tone and other important processes such as stimulating cellular proliferation, growth, and tissue fibrogenesis.Citation22 Related studies have demonstrated that the endothelin peptide functions by interacting with its membrane receptors (ETAR, ETBR).Citation8 ET-1 and its receptors are positively regulated in the fibrotic liver and their expressions are related to disease severity.Citation23 In our study, ETAR was significantly expressed in hepatic hemangioma and liver cancer tissues, while only having a low expression in liver cirrhosis and para-carcinoma tissue samples. In addition, we found that α-SMA was highly expressed in liver disease tissues such as liver cancer and hepatic hemangioma. Some studies also evidenced that α-SMA was a marker of activated HSCs, therefore, activated HSCs are closely related to liver diseases.Citation24 Similar results were also found in other researches which suggested that α-SMA was overexpressed in rat hepatic stellate cells.Citation25 HSCs were revealed to express endothelin receptors.Citation23 Activated HSCs are the main source of ET-1 and ET-1 has a distinct contractile effect on stellate cells when the liver is damaged.Citation26 Therefore, endothelin receptors may have an indirect role in hepatic diseases through HSCs.
The western blotting and immunofluorescence results demonstrated that ETAR was overexpressed in liver diseases tissue, especially in liver cancer and hepatic hemangioma. The results also highlighted the relationship between activated HSCs and ETAR. Our study supports the theory that activated HSCs are a primary source of ETAR. Similar results were also seen in periodontal ligament cells.Citation27 The expression of ET-1 is scattered in primate PDL endothelial cells.Citation28 HSCs are activated when the liver is seriously injured, resulting in the overexpression of ETAR in HSCs as a response.
The correlation analysis highlighted the relationship between ETAR and liver cirrhosis. PLT, ALT, TBIL and portal vein diameter are major indexes of liver cirrhosis portal hypertension and are the early identifiers of liver disease. When the liver is injured, the number of white blood cells, PLT and portal vein diameter changes.Citation29 Our study showed that ETAR was positively correlated with PLT and portal vein diameter and negatively correlated with ALT. This suggests that ETAR is positively correlated with liver cirrhosis portal hypertension. The ETAR and liver cirrhosis correlation analysis proved that ETAR was a symbol of liver cirrhosis. We further demonstrated that ALT had a negative correlation to liver disease deterioration and that GGT was positively correlated with liver disease deterioration. These 2 results suggest that ETAR is positively correlated with the deterioration of liver diseases. Moreover, ETAR is negatively related to portal vein diameter. In future studies, it is important to systematically relate liver disease with different measurements of liver tissue ETAR levels to determine whether ETAR can serve as an early detector of liver diseases such as liver cirrhosis.
However, we acknowledge that our sample size is small and we require a greater amount of clinical data to prove our conclusions. In addition, the correlations we observed still require further research to ensure there were no omissions. In this study the protein signaling pathway was not studied and this leaves a question concerning the mechanism behind the way ETAR effects liver diseases. Future studies should focus on the signaling pathway and how ETAR influences liver diseases.
In conclusion, our results revealed that ETAR is expressed abnormally in liver cancer and cirrhosis. We also demonstrated that ETAR may influence liver cancer and cirrhosis through HSCs. In addition, we evidenced that ETAR is related to clinical data such as PLT, portal vein diameter and ALT. Moving forward, other channels in which ETAR affects liver cancer should be investigated.
Disclosure of potential conflicts of interest
The authors report no conflict of interest.
Acknowledgments
Schistosomiasis Control Project in Hubei Province; National Science and Technology Major Project.
Funding
This work was supported by the Schistosomiasis Control Project in Hubei Province under Grant No. XF2010–15, XF2012–17; the National Science and Technology Major Project under Grant No. 2014ZX10005001.
References
- Feher J, Lengyel G. Silymarin in the prevention and treatment of liver diseases and primary liver cancer. Curr Pharm Biotechnol. 2012; 13: 210-7. doi:10.2174/138920112798868818. PMID:21466434
- Nault JC. Reports from the International Liver Cancer Association (ILCA) congress 2014. J Hepatol. 2015;62:477-82. doi:10.1016/j.jhep.2014.11.015. PMID:25463542
- Jemal A, Bray F, Center MM, Ferlay J, Ward E, Forman D. Global cancer statistics. CA Cancer J Clin. 2011;61:69-90. doi:10.3322/caac.20107. PMID:21296855
- Sun B., Karin M. Obesity, inflammation, and liver cancer. J Hepatol. 2012;56:704-13. doi:10.1016/j.jhep.2011.09.020. PMID:22120206
- Mortality GBD. Causes of Death C. Global, regional, and national age-sex specific all-cause and cause-specific mortality for 240 causes of death, 1990–2013: A systematic analysis for the Global Burden of Disease Study 2013. Lancet. 2015;385:117-71. doi:10.1016/S0140-6736(14)61682-2. PMID:25530442
- Gnarra M, Behr G, Kitajewski A, Wu JK, Anupindi S A, Shawber CJ, Zavras N, Schizas D, Salakos C, Economopoulos KP. History of the infantile hepatic hemangioma: From imaging to generating a differential diagnosis. World J Clin Pediatr. 2016;5:273-80. doi:10.5409/wjcp.v5.i3.273. PMID:27610342
- Yanagisawa M, Kurihara H, Kimura S, Tomobe Y, Kobayashi M, Mitsui Y, Yazaki Y, Goto K, Masaki T. A novel potent vasoconstrictor peptide produced by vascular endothelial cells. Nature. 1988;332:411-5. doi:10.1038/332411a0. PMID:2451132
- Takashimizu S, Kojima S, Nishizaki Y, Kagawa T, Shiraishi K, Mine T, Watanabe N. Effect of endothelin A receptor antagonist on hepatic hemodynamics in cirrhotic rats. Implications for endothelin-1 in portal hypertension. Tokai J Exp Clin Med. 2011;36:37-43. PMID:21769771
- Li JJ, Wu LH, Cao Q, Yuan Y, Yang L, Guo ZY, Kaur C, Sivakumar V, Ling EA, Wu CY. Endothelins-1/3 and endothelin-A/B receptors expressing glial cells with special reference to activated microglia in experimentally induced cerebral ischemia in the adult rats. Neuroscience. 2010;167:665-77. doi:10.1016/j.neuroscience.2010.02.062. PMID:20206236
- Schinelli S. Pharmacology and physiopathology of the brain endothelin system: an overview. Curr Med Chem. 2006;13:627-38. doi:10.2174/092986706776055652. PMID:16529555
- Bagnato A, Rosano L. The endothelin axis in cancer. Int J Biochem Cell Biol. 2008;40:1443-51. doi:10.1016/j.biocel.2008.01.022. PMID:18325824
- Ling L, Kuc RE, Maguire JJ, Davie NJ, Webb DJ, Gibbs P, Alexander GJ, Davenport AP. Comparison of endothelin receptors in normal versus cirrhotic human liver and in the liver from endothelial cell-specific ETB knockout mice. Life Sci. 2012;91:716-22. doi:10.1016/j.lfs.2012.02.003. PMID:22365955
- Guo CY, Wu JY, Wu YB, Zhong MZ, Lu HM. Effects of endothelin-1 on hepatic stellate cell proliferation, collagen synthesis and secretion, intracellular free calcium concentration. World J Gastroenterol. 2004;10:2697-700. doi:10.3748/wjg.v10.i18.2697. PMID:15309721
- Geerts A. History, heterogeneity, developmental biology, and functions of quiescent hepatic stellate cells. Semin Liver Dis. 2001;21:311-35. doi:10.1055/s-2001-17550. PMID:11586463
- Kong X, Feng D, Wang H, Hong F, Bertola A, Wang FS, Gao B. Interleukin-22 induces hepatic stellate cell senescence and restricts liver fibrosis in mice. Hepatology. 2012;56:1150-9. doi:10.1002/hep.25744. PMID:22473749
- Stanciu A, Cotutiu C, Amalinei C. [New data about ITO cells]. Rev Med Chir Soc Med Nat Iasi. 2002;107:235-9. PMID:12638266
- Amann T, Bataille F, Spruss T, Muhlbauer M, Gabele E, Scholmerich J, Kiefer P, Bosserhoff AK, Hellerbrand C. Activated hepatic stellate cells promote tumorigenicity of hepatocellular carcinoma. Cancer Sci. 2009;100:646-53. doi:10.1111/j.1349-7006.2009.01087.x. PMID:19175606
- Ogawa T, Enomoto M, Fujii H, Sekiya Y, Yoshizato K, Ikeda K, Kawada N. MicroRNA-221/222 upregulation indicates the activation of stellate cells and the progression of liver fibrosis. Gut. 2012;61:1600-9. doi:10.1136/gutjnl-2011-300717. PMID:22267590
- Zhao W, Zhang L, Xu Y, Zhang Z, Ren G, Tang K, Kuang P, Zhao B, Yin Z, Wang X. Hepatic stellate cells promote tumor progression by enhancement of immunosuppressive cells in an orthotopic liver tumor mouse model. Lab Invest. 2014;94:182-91. doi:10.1038/labinvest.2013.139. PMID:24296878
- Munker G. [Proceedings: Effect of pregnancy on the resistance of the Eustachian tube]. Arch Klin Exp Ohren Nasen Kehlkopfheilkd. 1973;205:157-61. PMID:4785485
- Munshi MK, Uddin MN, Glaser SS. The role of the renin-angiotensin system in liver fibrosis. Exp Biol Med (Maywood). 2011;236:557-66. doi:10.1258/ebm.2011.010375. PMID:21508249
- Nabeshima Y, Tazuma S, Kanno K, Hyogo H, Iwai M, Horiuchi M, Chayama K. Anti-fibrogenic function of angiotensin II type 2 receptor in CCl4-induced liver fibrosis. Biochem Biophys Res Commun. 2006;346:658-64. doi:10.1016/j.bbrc.2006.05.183. PMID:16774739
- Pinzani M, Milani S, De Franco R, Grappone C, Caligiuri A, Gentilini A, Tosti-Guerra C, Maggi M, Failli P, Ruocco C, et al. Endothelin 1 is overexpressed in human cirrhotic liver and exerts multiple effects on activated hepatic stellate cells. Gastroenterology. 1996;110:534-48. doi:10.1053/gast.1996.v110.pm8566602. PMID:8566602
- Yang KL, Chang WT, Hong MY, Hung KC, Chuang CC. Prevention of TGF-beta-induced early liver fibrosis by a maleic acid derivative anti-oxidant through suppression of ROS, inflammation and hepatic stellate cells activation. PLoS One. 2017;12:e0174008. doi:10.1371/journal.pone.0174008. PMID:28384213
- Abergel A, Sapin V, Dif N, Chassard C, Darcha C, Marcand-Sauvant J, Gaillard-Martinie B, Rock E, Dechelotte P, Sauvant P. Growth arrest and decrease of alpha-SMA and type I collagen expression by palmitic acid in the rat hepatic stellate cell line PAV-1. Dig Dis Sci. 2006;51:986-95. doi:10.1007/s10620-005-9031-y. PMID:16642426
- Bahrami AJ, Gunaje JJ, Hayes BJ, Riehle KJ, Kenerson HL, Yeung RS, Stempien-Otero AS, Campbell JS, Mahoney WM Jr. Regulator of G-protein signaling-5 is a marker of hepatic stellate cells and expression mediates response to liver injury. PLoS One. 2014;9:e108505. doi:10.1371/journal.pone.0108505. PMID:25290689
- Sims M. R., Ashworth J. F., Sampson WJ. Upregulation of immunoreactivity of endothelin-1 and alpha-SMA in PDL microvasculature following acute tooth loading: an immunohistochemical study in the marmoset. Orthod Craniofac Res. 2003;6:74-82. PMID:12809268
- Sims MR. Endothelin-1 expression in the microvasculature of normal and 3-hour continuously loaded rat molar periodontal ligament. Eur J Orthod. 2001;23:647-62. doi:10.1093/ejo/23.6.647. PMID:11890061
- Lee YJ, Lee HR, Shim JY, Moon BS, Lee JH, Kim JK. Relationship between white blood cell count and nonalcoholic fatty liver disease. Dig Liver Dis. 2010;42:888-94. doi:10.1016/j.dld.2010.04.005. PMID:20472517