
ABSTRACT
Classical anti-inflammatory cytokines are known to play a role in both cancer progression as well as cancer elimination. We evaluated the anti-inflammatory cytokines IL-10 and TGF-β in patients with colon adenocarcinoma and metastatic colon adenocarcinoma using immunohistochemical assays to determine the expression of the cytokines between various malignant tissues. We found tissues stained with TGF-β showed no significant upregulation within malignant tumors when compared with normal tissue controls. We observed high levels of TGF-β presence in most tissues similar to GAPDH expression. Within both colon adenocarcinoma and metastatic carcinomas there was a significant variability among patients in the expression of IL-10. While some patients experienced insignificant increases in the cytokine compared with controls, other patients had a clear upregulation of the protein within their tissue. In addition, there was an increase in the number of patients positive for IL-10 upregulation within metastatic tumors when compared with primary tumors. These data indicate that there is substantial variability between patients in regards to IL-10 expression, which may further aid in characterizing tumors and evaluating metastatic potential.
Abbreviations
| M/F | = | Male/Female Ratio |
| GV | = | average overall gray value of tissues |
Introduction
Globally, colorectal cancer (CRC) is the third most prevalent cancer and comprises approximately 10% of diagnosed cancers.Citation1 The majority of individuals at high risk for CRC development are over 50 y of age, as incidence rates increase 50 fold in patients ages 60–79 when compared with patients younger than 40.Citation2 While there has been noteworthy improvements in early screening and combinatorial treatment development, in the United States 49,190 individuals died of the disease in 2016.Citation3 As colon cancer grows, mutates, and evolves within patients, it is important to understand the unique environment surrounding tumor growth and development, and its ability to evade immune detection.Citation4,Citation5
As the primary form of communication between cells, cytokines have a powerful impact on regulating both proliferation and immune responses in the tumor microenvironment.Citation6,Citation7 Cytokine profiles can induce anti-tumor responses, which often lead to a favorable prognosis, but can also result in supporting malignancy in conditions of chronic inflammation.Citation8 These cytokine profiles are assessed by measuring the concentration of both pro- and anti-inflammatory cytokines and evaluating their expression within malignant cells.Citation9 Cytokines within the tumor microenvironment are produced by both cancer cells and immune cells that are recruited to the malignant site.Citation10 Tumors will often skew cytokine profiles to support growth and proliferation by influencing surrounding cells to secrete potent pro-inflammatory cytokines such as TNF-α, IL-8, IL-6, and IL-1β.Citation10-Citation12 Cancer cells rely on a pro-inflammatory environment to activate signaling pathways, such as NF-κB and Ap-1, responsible for supporting cell survival.Citation12 To combat this, several anti-inflammatory drugs have been tested for efficacy in preventing or treating CRC, such as nonsteroidal anti-inflammatory drugs (NSAIDs), to reduce inflammation at the tumor site.Citation10,Citation13
Known to be widely expressed within most somatic tissue, transforming growth factor β (TGF-β) is a cytokine known for its induction of peripheral tolerance and anti-inflammatory responses. TGF-β is shown to have a tumor suppressive role within cancers, as it functions to inhibit cell proliferation, induce apoptosis, and inhibit cell immortalization.Citation14 Yet, as cancer progresses within some patients, there is an increase in TGF-β levels which leads to the inhibition of cell adhesion and promotion of angiogenesis, supporting immunosuppression in the tumor microenvironment, and the degradation of the extracellular matrix.Citation14,Citation15 These factors contribute to the success of a tumor to metastasize.Citation16 As a result, TGF-β has been implicated as a factor involved in promoting metastasis. To further clarify the role of TGF-β in colon adenocarcinoma we investigated its levels within primary tumors and metastatic tumors to determine whether cancer had an increased ability to metastasize when TGF-β was highly expressed.
Interleukin-10 (IL-10) is a potent anti-inflammatory cytokine secreted primarily from Th2 cells. While inhibiting antigen presenting cells, IL-10 is also responsible for suppressing the production of pro-inflammatory cytokines.Citation6 It has been shown that upon transferring the IL-10 gene into tumors, there was an observed decrease in metastatic ability and an increase in protective immunity against the tumor.Citation17-Citation19 Yet, other sources claim that secreting IL-10 promotes the suppression of antitumor immune responses and protects the tumor against immune attack within CRC cells.Citation18 These conflicting results exemplify the pleiotropic nature of IL-10, especially within the tumor microenvironment, and the alternative roles it can play within cancer progression.
While there has been extensive investigation into the nature of pro-inflammatory cytokines within tumor tissue, the expression of these anti-inflammatory cytokines within CRC tumors is not as well characterized. Specifically, there remains a need to determine anti-inflammatory cytokine production within metastatic CRC tumors to evaluate whether cells undergo transcriptional changes in cytokine gene expression when relocating to an alternative environment within the body. The purpose of this study is to evaluate both IL-10 and TGF-β expression within CRC patients with both colon adenocarcinoma as well as metastatic colon adenocarcinoma to investigate variability of these anti-inflammatory cytokines within CRC tumors.
Results
IL-10 has a significant upregulation in 20% of patients with colon adenocarcinoma
When tissues were stained for IL-10, there was a significant upregulation of the cytokine that occurred within a fifth of the patients when compared with normal controls (). To aid in distinguishing this variability, tissues were separated into ‘Adenocarcinoma IL-10 Low’, representing patients with insignificant IL-10 expression, and ‘Adenocarcinoma IL-10 High’, representing patients with significant IL-10 expression (). On average, the gray staining intensity of IL-10 in Adenocarcinoma IL-10 Low patients was 125.51, while the average staining intensity in Adenocarcinoma IL-10 High patients was 111.46 (). As lower gray values indicated more antigen binding, this difference was statistically significant (p<0.0001) and showed that there was a clear divide among patients in regards to the presence of IL-10 within their tumors.
Figure 1. Statistical analysis of IL-10 expression within colon cancer tissue. (A) Expression of IL-10 within all tissue types shows statistically significant increases in the cytokine within cancer tissue when compared with controls. ‘Adenocarcinoma IL-10 High’ tissue indicates tissues who had significant Il-10 expression and ‘Adenocarcinoma IL-10 Low’ tissue indicates tissue who had insignificant IL-10 expression. This same nomenclature is applied to the metastatic tissues. (B) All tissues [Adenocarcinoma IL-10 Low and Adenocarcinoma Il-10 High] were combined to determine the overall IL-10 expression within cancer grades. Overall, IL-10 expression had a significant increase in expression in Grade III tissue. (C) We found no statistically significant changes in IL-10 production between genders.
![Figure 1. Statistical analysis of IL-10 expression within colon cancer tissue. (A) Expression of IL-10 within all tissue types shows statistically significant increases in the cytokine within cancer tissue when compared with controls. ‘Adenocarcinoma IL-10 High’ tissue indicates tissues who had significant Il-10 expression and ‘Adenocarcinoma IL-10 Low’ tissue indicates tissue who had insignificant IL-10 expression. This same nomenclature is applied to the metastatic tissues. (B) All tissues [Adenocarcinoma IL-10 Low and Adenocarcinoma Il-10 High] were combined to determine the overall IL-10 expression within cancer grades. Overall, IL-10 expression had a significant increase in expression in Grade III tissue. (C) We found no statistically significant changes in IL-10 production between genders.](/cms/asset/b3253dda-9d13-4af0-8704-34e1b4855286/kcbt_a_1360453_f0001_oc.jpg)
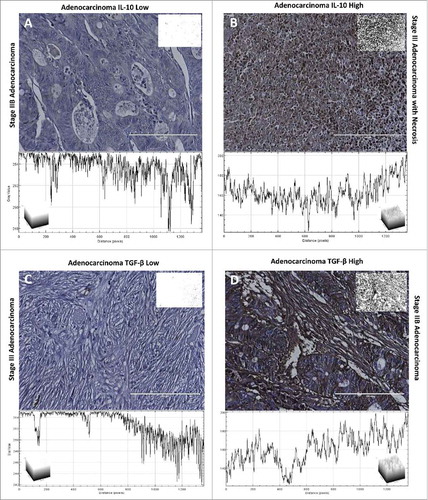
Figure 2. IL-10 and TGF-β staining of colon adenocarcinoma tissue. Each tissue is displayed with the gray scale image, with an applied threshold, in the top right corner of the image. Below each image is the intensity map of the tissue with the gray values on the Y-axis. Within each of the intensity maps is a graphical representation of the level of gray staining. The scale bar indicates a magnification of 200. (A) Tissue from a 66-year-old female with Stage IIB colon adenocarcinoma who showed minimal levels of IL-10 expression characteristic of approximately 80% of patients. (B) Tissue from a 78-year-old female with stage III adenocarcinoma who experienced a significant upregulation of IL-10 within her tumor, which was characteristic of approximately 20% of the patients. (C) Tissue from a 64-year old male with stage III adenocarcinoma. This individual was rare among the samples analyzed as he had no visible staining of TGF-β. (D) Tissue from a 71-year old male with stage IIB adenocarcinoma, who had significant levels of TGF-β characteristic of only 13% of the tissues.
Further analysis revealed there was a significant increase (p = 0.0049) in IL-10 expression within Grade III tumors when compared with Grade II tumors (). These data indicate IL-10 expression may be linked to the differentiation of the cancer cell, as cells that are poorly differentiated have an increased expression of IL-10. We also evaluated the differences between sexes and found no statistically significant (p = 0.8778) relationship between IL-10 production and sex ().
Patients with metastatic colorectal adenocarcinoma have an increased proportion of IL-10 upregulation
As with colon adenocarcinomas, metastatic cancer samples had a similar divide between patients that experienced a significant expression of IL-10 and those that did not. This difference between patients was skewed in the opposite direction of colon adenocarcinoma tissue: instead of having most patients with no significant IL-10 expression, most metastatic samples were positive for IL-10. While 20% of patients with colon adenocarcinoma were positive for expression, 53% of patients with metastatic adenocarcinoma had elevated levels of IL-10 (). These results indicate that IL-10 may be an important factor contributing to metastasis and the ability of a metastatic cell to survive.
Figure 3. Statistical analysis of IL-10 expression within metastatic adenocarcinoma. (A) Within metastatic tissue there was no statistically significant increase in IL-10 presence with changes in grade. (B) While there were positive tissues within both adenocarcinoma and metastatic adenocarcinoma, patients with metastatic adenocarcinoma had a more prevalent presence of IL-10. (C) Along with an increase in the amount of patients with elevated IL-10 expression, the average stain intensity of patients with metastatic adenocarcinoma was significantly higher than patients with adenocarcinoma.
Tissue samples were similarly split into ‘Metastatic IL-10 Low’ and ‘Metastatic IL-10 High’ samples (). The average staining intensity of Metastatic IL-10 Low samples was 119.95, while the average staining of Metastatic IL-10 High samples was 106.42 (). This difference was statistically significant (p<0.0001) and indicates a clear divide between patients regarding IL-10 production, as lower values indicate more IL-10 within the tissue. In addition, the average intensity of Metastatic IL-10 High samples was significantly darker than Adenocarcinoma IL-10 High (p = 0.027), indicating a higher expression of IL-10 within metastatic malignant cells ().
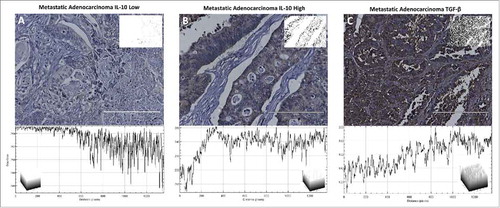
Figure 4. IL-10 and TGF-β expression within metastatic adenocarcinomas. Each tissue is displayed with the gray scale image, with an applied threshold, in the top right corner of the image. Below each image is the intensity map of the tissue with the gray values on the Y-axis. Within each of the intensity maps is a graphical representation of the level of gray staining. The scale bar indicates a magnification of 200. (A) Tissue from a 43-year-old male with grade 2 metastatic adenocarcinoma from the colon had minimal levels of IL-10 expression representative of 44% of patients. (B) Tissue from a 51-year-old female with metastatic adenocarcinoma who had significantly upregulated expression of IL-10 representative of 55% of tissue evaluated. (C) Tissue from a 58-year-old male with metastatic adenocarcinoma stained with TGF-β. All metastatic tissues exhibited this same level of TGF-β staining. This level of staining was consistent through all of the tissue types.
While there was a statistically significant difference within colon adenocarcinoma samples in regards to grade, there was no statistically significant change in IL-10 expression within metastatic adenocarcinomas when considering grade (). As metastatic tumors are very commonly poorly differentiated, we expected to see no clear divide between any determined grades.
To determine whether the observed IL-10 increase in metastatic tumors was also seen within individual patients upon metastasis we examined a small cohort (n = 13) of individuals with expression data from both primary tumor sites and matching metastatic tumor sites. Within this small cohort there was no statistically significant difference in overall IL-10 expression between primary tumors and metastatic tumors. However, one patient had a significantly elevated expression of IL-10 within their metastatic tumor when compared with their primary tumor (). Additionally, we analyzed IL-10 expression data in a larger set of metastatic tumors to determine the general distribution of the cytokine within metastasis. We found that there were generally low levels of the cytokine as observed within tissue. However, the expression profile showed a right skewed pattern with a small fraction of patients showing considerably highly elevation of IL-10, and several other patients who had a general upregulation (). For patients who experience this upregulation, it may be beneficial to target IL-10 to reduce metastatic potential.
Figure 5. IL-10 and TGF-β expression profiles in patients from TCGA. (A) 396 metastatic tumors were analyzed for IL-10 expression. The number of patients is plotted against the Expression profile in transcripts per million. (B) IL-10 expression within primary and metastatic tumors was plotted to show differences within the same individual. On patient experienced significantly elevated IL-10 and is shown in green. This same cohort was used to also evaluate (C) TGF-β expression between primary and metastatic tumors.
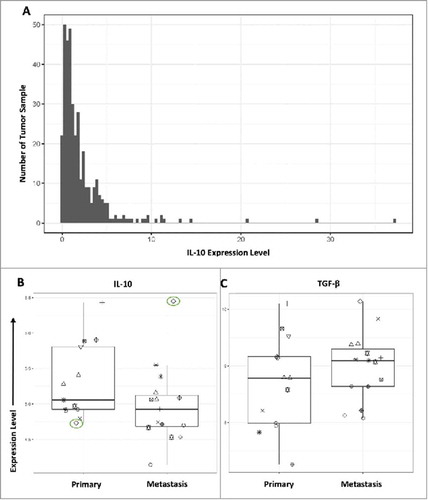
Figure 6. Statistical analysis of TGF-β expression within colon cancer tissue. (A) TGF-β showed a consistent level of expression across all tissue types, including normal tissue, with the exception of 4 patients who had insignificant levels of TGF-β expression. (B) Number of patients with positive expression of TGF-β and negative levels of TGF-β. There was a small proportion of patients that had no TGF-β expression. (C) There was no significant difference in TGF-β expression between tissue grades in colon adenocarcinoma samples or metastatic adenocarcinoma samples.
TGF-β expression is generally consistent throughout all patient tissue
While IL-10 showed variable expression within tumors when compared with normal controls, there was no significant changes in expression within tissue stained for TGF-β (). Four patients experienced very low levels of TGF-β uncharacteristic of any other tissue samples ( and ). These patients had an average staining intensity of 110.95, which is significant (p<0.0001) when compared with both cancerous tissue and normal tissue, which had an average staining intensity of 87.82 (). These patients represented a fraction of the samples, and the unusual lack of expression may be used as an additional tool for characterizing individual tumors and mutations within patients.
The expression of TGF-β did not experience any changes in staining intensity between metastatic adenocarcinomas or colon adenocarcinomas. ( and ) In addition, while analyzing a small cohort of patients with both primary tumor and metastatic tumor samples, there was no statistically significant difference between the 2 sites in regards to TGF-β expression ().
Discussion
These results show that immunosuppressive cytokine levels of IL-10 have variable expression within different colon adenocarcinoma tumors and may provide insights into the strategies tumors utilize to avoid immune detection. Both anti-inflammatory cytokines as well as pro-inflammatory cytokines are known to be involved in contributing to positive and negative patient outcome and help to establish the complexity of the tumor microenvironment.
The complexity of the tumor microenvironment is supported by the cytokines secreted within the tumor site, and is often protective for cancer cells and provides an atmosphere optimal for cancer cell growth. This supportive environment is no longer present as individual metastatic cancer cells break off from the primary tumor to invade other tissue. Instead of being nurtured by a very well organized, structured tumor site, metastatic cells are faced with several challenges where they often have to alter gene expression to survive.
A critical target for IL-10 is the inhibition of antigen presenting cells. IL-10 functions to downregulated MHC expression and co-stimulatory molecules critical for the activation of effector T cells.Citation20-Citation22 In addition, IL-10 contributes to the expression of Foxp3 and TGF-β, which sustain Treg populations.Citation20,Citation23 Tregs are influential in the success of a tumor to metastasize as they aid in tumor cell survival within the circulation.Citation24 Because cancer cells are escaping from a well-established environment, a vast majority of cells released do not successfully establish metastatic sites. Those cells that successfully avoid destruction within circulation make changes to the transcriptional control of genes to promote an environment that supports immune evasion.Citation25 These transcriptional changes often involve increasing levels of IL-10 to elevate the number of Tregs within the surrounding environment. By increasing Treg differentiation, metastatic cells can increase their chance of survival when breaking away from the primary tumor. Our results show that within metastatic tumors there is a significant increase in the number of patients with elevated IL-10 when compared with primary tumors. This indicates that IL-10 may play a role in promoting metastasis and controlling the immune environment to support metastatic tumor cell escape.
Within the primary tumor site, IL-10 production can both support and interfere with cancer cell survival, which may explain why the levels of IL-10 are so variable between CRC patients. IL-10 can function to stimulate the immune system by increasing the frequency of cytotoxic CD8+ T cells and natural killer cells depending on the other cytokines present within the tumor microenvironment (IL-2 for T cell activation and IL-19 for Natural killer cell activation).Citation26,Citation27 The anti-tumor effects of IL-10 are also demonstrated as IL-10 modifies and efficiently regulates the quality of antigen presentation.Citation20 The effects of IL-10 within the primary tumor are modulated by the surrounding cytokine profile and expression of the protein can provide insights into approaches the tumor takes to skew the immune response to either anti-inflammatory or pro-inflammatory.
We did not find a significant increase in TGF-β when comparing metastatic tumors to endogenous tumors. Our results show that the levels of TGF-β do not vary significantly between normal colon tissue and malignant colon tissue, indicating its role within cellular maintenance is essential for all tissue. Yet, we did observe tissue from 4 patients with insignificant levels of TGF-β which may provide physicians with a targeted treatment of those individuals who lack the protein, as this phenomenon was only experienced within patients with malignant tissue.
Classical anti-inflammatory cytokines exhibit complex effects on tumor growth and development. The presence of these cytokines within malignant tissue can provide key insights into strategies elicited by the tumor to promote growth. Within each individual patient there is a unique cytokine profile which determines the microenvironment surrounding the tumor and the strategies tumors utilize to survive and adapt. We have shown that IL-10 is extremely variable among patients and could provide physicians with additional tools for characterizing individual patient tumors.
While this study examines IL-10 and TGF-β levels within a small cohort of individuals, there is need for an analysis within an extrinsic data set with more patients. Further investigation will need to be conducted in the future to determine the source of IL-10 and TGF-β within these tumors. Understanding the composition of cells that secrete these cytokines will provide additional insights into ways to potentially reduce their expression within the tumor microenvironment.
Materials and methods
Chemicals
DIVA antigen retrieval solution, Background Sniper blocking agent, Universal negative, Mach 4 HRP antibodies, DAB Peroxidase, and Hematoxylin were all purchased from Biocare Medical. IL-10 and TGF-β antibodies were purchased from Thermo Fisher Scientific. GAPDH polyclonal antibody was purchased from cell signaling.
Patients
Colorectal Adenocarcinoma Tissue Microarrays were obtained from Biomax. Each microarray contains 30 cases of colon adenocarcinoma (grade 1–3), 30 cases of Metastatic adenocarcinoma from the colon (grade 2–3), 10 cases of tubular adenoma, 20 samples of cancer adjacent normal tissue, and 10 samples from normal colon tissue. Adenocarcinoma tissue was assessed for TMN grading and stage. Patient ages ranged from 29 -81 for malignant samples. Sex was also variable between samples ().
Table 1. Distribution of malignant colon tissue and controls.
All procedures performed in studies involving human participants were in accordance with the ethical standards of the institutional and/or national research committee and with the 1964 Helsinki declaration and its later amendments or comparable ethical standards.
Immunohistochemistry
Tissues were incubated in Histoclear and rehydrated with a series of ethanol washes. Tissues were incubated with a DIVA solution for 30 minutes before treatment with a Background Sniper block. Block was administered for 30 minutes before tissues were washed and treated with primary antibodies at a 1:100 dilution. Following primary antibody treatment overnight at 4°C, tissues were washed and treated with Mach 4 HRP antibodies for 20 minutes at room temperature. After several washes, a DAB Peroxidase solution is added to the tissues. Areas of antibody binding will convert the colorless substrate to a brown product to highlight regions of antibody binding. Then, tissues are treated with a hematoxylin solution to show cell nuclei. Along with IL-10 and TGF-β treatment, GAPDH was used as a positive control and a universal negative was used as a negative control for expression.
Tissue quantification
Following tissue imaging, all tissue was analyzed using ImageJ software. Briefly, tissue images were each placed under an ‘IHC toolbox’ program with a selected “more DAB” option to discard areas of the sample without sufficient DAB staining. Following this, tissue images were converted to a gray scale and then placed under a threshold. To avoid incorporating bias from negative space within the image, a threshold was applied to the image to measure only areas of staining. The threshold applied for these samples was 50–150 and was determined using GAPDH and the universal negative samples as guides. Samples with an average gray intensity of less than 115 were considered positive for cytokine expression (“High”) and samples with an average gray intensity above 115 were considered negative for cytokine expression (“Low”). Once the threshold was applied to all images, they were assessed for average gray intensity. Low gray values are indicative of darkly stained tissue, and high gray values are indicative of not staining. Following this evaluation, the images were also analyzed using plot surfaces to quantify the levels of gray intensity throughout the sample.
Bioinformatic analysis
We evaluated differences in expression levels of the IL-10 and TGF-β1 genes between primary tumors (n = 13) and metastases (n = 15) in datqa published by Vignot, et at.Citation28 These data had been generated using one-color Agilent microarrays. We preprocessed and normalized the data using the limma software package (v.3.30.13), using settings recommended in the limma User's Guide. To plot the data, we used the ggplot2 package (v.2.2.1). These software packages are implemented for the R statistical software.
Next we evaluated RNA-Sequencing data from The Cancer Genome Atlas (TCGA) for metastatic melanoma patients (n = 367). These data had previously been prepared using the featureCounts algorithm and summarized to transcripts-per-million values. We used the ggplot2 package (v.2.2.1) to plot these data.
Statistical analysis
Comparison between tissue samples was conducted using ANOVA statistical analysis with the multiple comparison method. In addition, 2-way ANOVA tests were performed to compare the mean expression of each antibody between colon adenocarcinoma and metastatic carcinoma tissues. Finally, t tests were used in conjunction to confirm statistical significance. All statistical analysis was evaluated using GraphPad Prism 7 software. Differences were considered significant when the p value was < 0.05.
Disclosure of potential conflicts of interest
No potential conflict of interest were disclosed.
Funding
This work was funded by the Simmons Center for Cancer Research at Brigham Young University
References
- Plewka D, Kowalczyk AE, Jakubiec-Bartnik B, Morek M, Bogunia E, Kmiec A, Wierzbicki PM, Plewka A, Mocellin S, Panelli MC, et al. Colorectal cancer epidemiology: Incidence, mortality, survival, and risk factors. Res Vet Sci. 2006;52(5 A):191-7.
- Society AC. Colorectal cancer facts & figures 2014–2016. Color Cancer Facts Fig. 2014;1-32.
- Siegel RL, Miller KD, Jemal A. Cancer statistics. CA Cancer J Clin. 2016;66(1):7-30. doi:10.3322/caac.21332. PMID:26742998
- Nowell PC. Linked references are available on JSTOR for this article: The clonal evolution of tumor cell populations. Science. (80-). 1976;194(4260):23-8. doi:10.1126/science.959840. PMID:959840
- Dunn GP, Old LJ, Schreiber RD. The immunobiology of cancer immunosurveillance and immunoediting. Immunity. 2004;21(2):137-48. doi:10.1016/j.immuni.2004.07.017. PMID:15308095
- Landskron G, Fuente M De, Thuwajit P, Thuwajit C, Hermoso MA. Review article chronic inflammation and cytokines in the tumor microenvironment. J Immunol Res. 2014;2014:14918. doi:10.1155/2014/149185. PMID:24901008
- Kryczek I, Wei S, Zou L, Altuwaijri S, Szeliga W, Kolls J, Chang A, Zou W. Cutting edge: Th17 and regulatory T cell dynamics and the regulation by IL-2 in the tumor microenvironment. J Immunol. 2007;178:6730-3. doi:10.4049/jimmunol.178.11.6730. PMID:17513719
- Coussens LM, Werb Z. Inflammation and cancer. Nature. 2002;420(6917):860-7. doi:10.1038/nature01322. PMID:12490959
- Whiteside TL. The tumor microenvironment and its role in promoting tumor growth. Oncogene. 2008;27(45):5904-12. doi:10.1038/onc.2008.271. PMID:18836471
- Klampfer L. Cytokines, inflammation and colon cancer. Curr Cancer Drug Targets. 2011;11(4):451-64. doi:10.2174/156800911795538066. PMID:21247378
- Lewis AM, Varghese S, Xu H, Alexander HR. Interleukin-1 and cancer progression: the emerging role of interleukin-1 receptor antagonist as a novel therapeutic agent in cancer treatment. J Transl Med. 2006;4(1):48. doi:10.1186/1479-5876-4-48. PMID:17096856
- Balkwill F. TNF-?? in promotion and progression of cancer. Cancer Metastasis Rev. 2006;25(3):409-16. doi:10.1007/s10555-006-9005-3. PMID:16951987
- Lundholm K, Gelin J, Hyltander A, Lonnroth C, Sandstrom R, Svaninger G, Korner U, Gulich M, Karrefors I, Norli B. Anti-inflammatory treatment may prolong survival in undernourished patients with metastatic solid tumors. Cancer Res. 1994;54(21):5602-6. PMID:7923204
- Lebrun J-J. The dual role of TGFβ in human cancer: From tumor suppression to cancer metastasis. ISRN Mol Biol. 2012;2012:381428. doi:10.5402/2012/381428. PMID:27340590
- Calon A, Tauriello DVF, Batlle E. TGF-beta in CAF-mediated tumor growth and metastasis. Semin Cancer Biol. 2014;25:15-22. doi:10.1016/j.semcancer.2013.12.008. PMID:24412104
- Mantovani A. Cancer: Inflaming metastasis. Nature. 2009;457(7225):36-7. doi:10.1038/457036b. PMID:19122629
- Rosenblum IY, Dayan AD. Carcinogenicity testing of IL-10: Principles and practicalities. Hum Exp Toxicol. 2002;21(7):347-58. doi:10.1191/0960327102ht275oa. PMID:12269696
- Kawamura K, Bahar R, Natsume W, Sakiyama S, Tagawa M. Secretion of interleukin-10 from murine colon carcinoma cells suppresses systemic antitumor immunity and impairs protective immunity induced against the tumors. Cancer Gene Ther. 2002;9(1):109-15. doi:10.1038/sj.cgt.7700418. PMID:11916240
- Kundu N, Fulton AM. Interleukin-10 inhibits tumor metastasis, downregulates MHC Class I, and enhances NK lysis. 1997;61(180):55-61.
- Dennis KL, Blatner NR, Gounari F, Khazaie K. Current status of interleukin-10 and regulatory T-cells in cancer. Curr Opin Oncol. 2013;25(6):637-45. doi:10.1097/CCO.0000000000000006. PMID:24076584
- Buer J, Lanoue A, Franzke A, Garcia C, von Boehmer H, Sarukhan A. Interleukin 10 secretion and impaired effector function of major histocompatibility complex class II-restricted T cells anergized in vivo. J Exp Med. 1998;187(2):177-83. doi:10.1084/jem.187.2.177. PMID:9432975
- Moore KW, de Waal Malefyt R, Coffman RL, O'Garra A. Interleukin -10 and the I Nterleukin -10 R Eceptor. Annu Rev Immunol. 2001;19(1):683-765. doi:10.1146/annurev.immunol.19.1.683. PMID:11244051
- Muto G, Kotani H, Kondo T, Morita R, Tsuruta S, Kobayashi T, Luche H, Fehling HJ, Walsh M, Choi Y, et al. TRAF6 is essential for maintenance of regulatory T cells that suppress Th2 type autoimmunity. PLoS One. 2013;8(9):1-12. doi:10.1371/journal.pone.0074639
- Caudle AS, Yang WT, Mittendorf EA, Kuerer HM. JAMA surgery. 2016;150(2):137-43.
- Badalà F, Nouri-mahdavi K, Raoof DA. NIH Public Access. Computer (Long Beach Calif). 2008;144(5):724-32.
- Baglaenko Y, Manion KP, Chang NH, Gracey E, Loh C, Wither JE. IL-10 production is critical for sustaining the expansion of CD5+ B and NKT cells and restraining autoantibody production in congenic lupus-prone mice. PLoS One. 2016;11(3):1-16. doi:10.1371/journal.pone.0150515
- Chen W, Zlotnik A. IL-10: A novel cytotoxic T cell differentiation factor. J Immunol. 1991;147(2):528–534.
- Vignot S, Lefebvre C, Frampton GM, Meurice G, Yelensky R, Palmer G, Capron F, Lazar V, Hannoun L, Miller VA, et al. Comparative analysis of primary tumour and matched metastases in colorectal cancer patients: Evaluation of concordance between genomic and transcriptional profiles. Eur J Cancer. 2015;51(7):791-9. doi:10.1016/j.ejca.2015.02.012. PMID:25797355