
ABSTRACT
Stem cell microenvironments decrease the invasiveness of cancer cells, and elucidating the mechanisms associated with disease regression could further the development of targeted therapies for aggressive cancer subtypes. To this end, we applied an emerging technology, TRanscriptional Activity CEll aRray (TRACER), to investigate the reprogramming of triple-negative breast cancer (TNBC) cells in conditions that promoted a less aggressive phenotype. The repressive environment was established through exposure to mouse embryonic stem cell conditioned media (mESC CM). Assessment of carcinogenic phenotypes indicated that mESC CM exposure decreased proliferation, invasion, migration, and stemness in TNBC cells. Protein expression analysis revealed that mESC CM exposure increased expression of the epithelial protein E-cadherin and decreased the mesenchymal protein MMP9. Gene expression analysis showed that mESC CM decreased epithelial to mesenchymal transition (EMT) markers fibronectin, vimentin, and Snail. Over a period of 6 d, TRACER quantified changes in activity of 11 transcription factors (TFs) associated with oncogenic progression. The EMT profile was decreased in association with the activity of 7 TFs (Smad3, NF-κΒ, MEF2, GATA, Hif1, Sp1, and RXR). Further examination of Smad3 and GATA expression and phosphorylation revealed that mESC CM exposure decreased noncanonical Smad3 phosphorylation and Smad3-mediated gene expression, increased GATA3 expression and phosphorylation, and resulted in a synergistic decrease in migration of GATA3 overexpressing MDA-MB-231 cells. Collectively, the application of TRACER to examine TF activity associated with the transition of cancer cells to a less aggressive phenotype, as directed by mESC CM, identified novel mechanistic events linking the embryonic microenvironment to both favorable changes and cellular plasticity in TNBC cell phenotypes.
Abbreviations
| 2D | = | two-dimensional |
| 3D | = | three-dimensional |
| BCSC | = | breast cancer stem cell |
| CSC | = | cancer stem cell |
| EMT | = | epithelial-mesenchymal transition |
| hMSC | = | human mesenchymal stem cell |
| MFE | = | mammosphere forming efficiency |
| MSR | = | mammosphere self-renewal |
| mESC | = | mouse embryonic stem cell |
| mEF | = | mouse embryonic fibroblast |
| MSC | = | mesenchymal stem cell |
| TRACER | = | transcriptional activity cell array |
| TF | = | transcription factor |
| TFr | = | transcription factor reporter |
| TNBC | = | triple-negative breast cancer |
Introduction
Breast cancer metastases are a leading cause of cancer mortality, with over 40,000 estimated deaths in 2016, and an estimated 26% 5–y survival rate following the diagnosis of distant disease.Citation1 Standard treatments, such as chemotherapy and radiation, function largely on the premise that cancers are composed of primarily homogenous cell populations with a relatively uniform oncogenic capacity.Citation2 However, this concept does not account for intrinsic cell heterogeneity or acquired resistance via active, passive, or genetic mutation-driven mechanisms.Citation3,Citation4 Furthermore, evidence supports that treatment resistance, cancer re-initiation, and metastatic dissemination may be driven by distinct cell populations, such as cancer stem cells (CSCs)Citation5–Citation8 which have been identified in solid tumors of the breast as biologically similar to stem cells through analogous regulation of miRNA.Citation9,Citation10 Elucidating the underlying mechanisms that control cancer cell fate and aggression is necessary to direct future interventions that target the aggressive tumor cell populations responsible for resistance and metastasis.
One key variable in cancer cell fate and progression is cell sensing of the proximal microenvironment,Citation11 which exerts multi-faceted control over cell growth, differentiation, and death.Citation12 Similarly, the stem cell microenvironment is fundamental in pluripotent cell fates.Citation13 This complements the belief that stem cells and CSCs share some common regulatory signaling pathways that manifest as similar cellular properties including unlimited proliferative potential, resistance to apoptosis, and plasticity.Citation14 To this end, a stem cell microenvironment may contain a complex milieu of cues that can control or reprogram the fate of cancer cells.Citation15 The mechanisms involved in facilitating this reprograming have yet to be fully characterized, due in part to the dynamic nature of reprogramming.Citation16,Citation17 Thus, a real-time or dynamic analysis of the reprogramming may provide mechanistic insights that are challenging to acquire through end-point analyses.
Capture of secreted factors in conditioned media (CM)Citation18 is a common approach to differentiate the influence of soluble and insoluble factors on cell fate. This technique has shown that embryonic stem cell (ESC) CM can inhibit cancer cell aggression and promote differentiation, which is conserved across melanoma, breast, ovary, and prostate cancer cells.Citation19–Citation23 Furthermore, a similar influence has been observed in mesenchymal stem cell (MSC) secretions, which exhibit an inhibitory effect on cancer cell proliferation in glioma, sarcoma, hepatoma, and triple-negative breast cancer (TNBC) cells.Citation19,Citation24-Citation26 Collectively, these studies suggest that stem cell microenvironments affect cancer cell phenotypes through secreted factors. However, questions remain about the dynamics of secreted factor reprogramming, the reprogramming value of individual versus combined secreted factors, and the potential utility of stem cell secretions from other sources. Therefore, tumor cell reprogramming with CM from unexplored stem cell sources would complement existing data that utilizes ESC and MSC secreted factors.
As a result, we sought to dynamically track the reprogramming of aggressive cancer cells to a more benign phenotype following exposure to secreted factors from an unexplored stem cell source. To track the reprogramming, we employed a TRanscriptional Activity CEll aRray (TRACER) in 3D cultureCitation27–Citation29 to investigate the dynamics of DNA sequence specific transcription factors (TFs) that play a critical role in fate determination of stem cells, as well as the epithelial to mesenchymal transition (EMT) process, in cancer cells.Citation30,Citation31 The stem cell CM was derived from mouse ESCs (mESC CM), which was then used to treat human MDA-MB-231 breast cancer cells (231s). This stem cell source and cross-species paradigm was studied following preliminary observations of mESC CM cell culture resulting in decreased invasion of MDA-MB-231 cells, as compared to control media and mouse embryonic fibroblast CM. This finding was provocative given the differences between human and mouse ESCs.Citation32,Citation33 We focused on MDA-MB-231 cells as these cells lack expression of the estrogen, progesterone, and,HER2/neu receptors, are invasive in vitro, and have a stem/progenitor-like phenotype.Citation34 Additionally, we validated TRACER analyses and phenotypic changes through qRT-PCR, immunoblotting, and overexpression studies. Collectively, this work demonstrates the favorable influence of mESC CM on aggressive cancer cells and expands the utility of TRACER to dynamically track the reprogramming of cancer cells during their transition to a less aggressive and less stem-like phenotype.
Results
mESC CM treatment reduced proliferation, invasion, migration of MDA-MB-231 cells
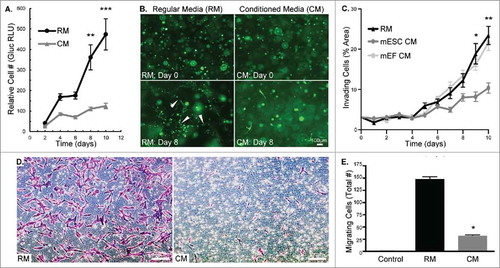
We first set out to examine the influence of mESC CM on MDA-MB-231 cell phenotypic changes to determine the feasibility of dynamically studying the decrease in cancer cell aggression. Cell number was quantified through the expression of a bioluminescent reporter gene, and we observed that mESC CM significantly decreased the proliferation of MDA-MB-231 cells relative to control, regular media (RM) over the course of 10 d (). We subsequently investigated cell invasion in a 3D Matrigel substrate in response to mESC CM. In RM, the MDA-MB-231 cells develop into distinct tubular structures, as seen at Day 8 (, white arrows), which is consistent with their ability to invade the matrix. Conversely, mESC CM treated cells had morphology at Day 8 that resembled their original morphology at Day 0. Treatment with mESC CM significantly decreased invasion of MDA-MB-231 cells (defined as the percentage of area invaded) relative to RM treated samples and to an additional control, mouse embryonic fibroblasts (mEF) CM (). Importantly, the mEF CM control was examined in this initial phenotypic analysis to confirm that the difference we observed was related to the mESC's conditioning and not due to a general response to embryonic or mouse cell secreted factors. Lastly, we studied the impact of pre-treatment with mESC CM on the migratory potential of MDA-MB-231 cells. Similar to cell invasion, mESC CM significantly reduced MDA-MB-231 cell migration compared to RM treated cells after 24 hrs (). Collectively, these morphological and phenotypic analyses show the diminished aggression of MDA-MB-231 cells treated with mESC CM.
Figure 1. MDA-MB-231 cells treated with mESC CM display decreased proliferation, invasion, and migration. (A) MDA-MB-231-Gluc cells were cultured in 2D for 10 d in either RM or CM with media change and Gluc measurement occurring every 2 d to quantify proliferation. (B) MDA-MB-231-GFP cells were embedded in Matrigel and treated with RM or CM over a period of 10 d. Images were captured every 2 d to monitor morphological differences. White arrows indicate tubular structures. (C) Cell invasion was compared between RM, mESC CM and mEF CM treated MDA-MB-231 cells by measuring percent of area invaded by cells embedded in Matrigel over a period of 10 d. Phase contrast images were captured daily and area was quantified using Image J. (D) Representative images of crystal violet stained MDA-MB-231 cells after 24 hr migration period through transwell membranes. (E) MDA-MB-231 cells were pre-treated with RM or mESC CM and cell migration was assessed using a transwell migration assay. Control transwell inserts absent of cells showed no staining. Error bars indicate standard error and statistical significance indicated by * for p<0.05, ** for p<0.005, and *** for p<0.0005. Scale bars are 100 μm.
mESC CM treatment diminished the CSC phenotype within MDA-MB-231 cell populations
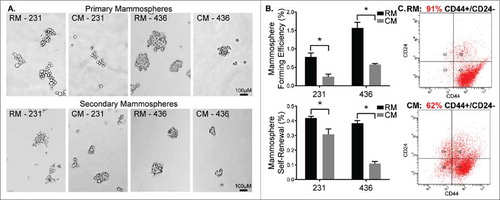
Given mESC CM's observed influence on cell phenotype in 2D and 3D microenvironments, we sought to characterize the CSC phenotype of MDA-MB-231 and MDA-MB-436 cells following treatment with mESC CM. CSC activity was assessed through the ability to form primary and secondary mammospheres, as well as through surface marker analysis. The number of primary MDA-MB-231 mammospheres significantly decreased upon conditioning with mESC CM (0.25% MFE) compared to RM (0.78% MFE) (). Similarly, primary MDA-MB-436 mammospheres significantly decreased upon conditioning with mESC CM (0.57% MFE) compared to RM (1.56% MFE) (). Primary mammospheres were re-passaged to form secondary mammospheres, allowing assessment of their capacity for self-renewal. In these secondary mammosphere studies, self-renewal was significantly decreased upon conditioning with mESC CM (0.31% MSR) compared to RM (0.42% MSR) (). Similarly, self-renewal of MDA-MB-436 cells was significantly decreased upon conditioning with mESC CM (0.11% MSR) compared to RM (0.38% MSR) (). Flow cytometry was employed to determine the proportion of MDA-MB-231 cells that were CD44+/CD24−, which has been identified as the phenotype associated with CSCs, and more specifically with breast CSCs (BCSCs).Citation9 A significant decrease of CD44+/CD24− cells was observed in the samples treated with mESC CM (62%) compared with the samples treated with RM (91%) (), supporting the hypothesis that the mESC microenvironment impacts the stemness of MDA-MB-231 cells.
Figure 2. MDA-MB-231 and MDA-MB-436 cells treated with mESC CM display diminished CSC activity. MDA-MB-231 and MDA-MB-436 cells were pre-treated with RM or CM after which they were utilized in mammosphere assays. (A) Representative images of primary mammosphere formation and representation of the potential for self-renewal following passaging of primary mammospheres to form secondary mammospheres. (B) Quantification of primary mammosphere forming efficiency and secondary mammosphere self-renewal. Additionally, MDA-MB-231 cells exposed to RM and mESC CM were assessed for stem/progenitor cell surface markers using (C) flow cytometry to determine changes in the CD44+ / CD24− subpopulation of cells, indicative of a stem/progenitor phenotype. Statistical significance indicated by * for p<0.05. Scale bars are 100 μm.
mESC CM treatment decreased the EMT profile of MDA-MB-231 cells
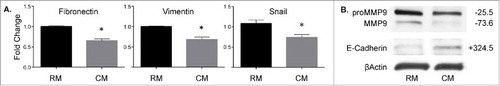
Based on our observation that CSC activity decreased upon treatment with mESC CM and the evidence that EMT programs activate CSC traits, such as self-renewal,Citation35 we then explored EMT-associated gene and protein expression. We first assessed whether mESC CM treatment of MDA-MB-231 cells altered the expression profile of mesenchymal genes, which are associated with the transition between epithelial and mesenchymal states. Treatment with mESC CM significantly reduced expression of fibronectin, vimentin, and Snail as determined by qRT-PCR, suggesting that the cancer cells were becoming more epithelial-like in character (). Immunoblotting showed mESC CM significantly decreased pro-form and active MMP9 (), whose activity has been associated with breast cancer cell invasion and EMT. MDA-MB-231 cells at baseline have low levels of E-cadherin, suggesting that these cells are relatively mesenchymal in nature. Notably, we observed a significant increase in the protein levels of E-cadherin after mESC CM treatment of the study cells ().
Figure 3. MDA-MB-231 cells treated with mESC CM display decreased expression of genes and proteins associated with EMT. MDA-MB-231 cells were treated for 4 d with RM or mESC CM after which (A) RNA was extracted and qRT-PCR was run to assess changes in gene expression of Fibronectin, Vimentin, and Snail. (B) Protein was extracted and used in an immunoblotting assay for proMMP9, MMP9, and E-Cadherin. Immunoblots are representative and percent change from RM to CM densitometry is adjacently indicated. Statistical significance indicated by * for p<0.05.
mESC CM dynamically modulated the regulome of MDA-MB-231 cells
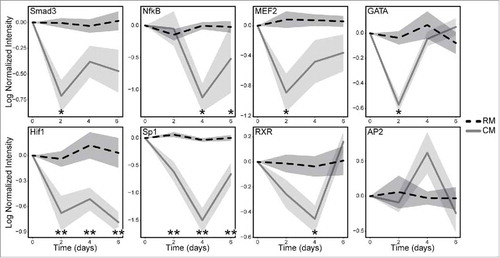
To build off the gene and protein expression analysis showing that mESC CM decreased EMT phenotype, we investigated the dynamics of TF signaling that were associated with the phenotypic changes in MDA-MB-231 cells. TRACER was employed to measure the activity of 11 TF reporter constructs over a 6-day period using bioluminescence imaging, which was normalized to cell number, background subtracted, loss normalized, then log2 transformed (). Several significant differences were observed in the TF activity panel with various response profiles. In general, treatment with mESC CM led to decreases in the activity of TFs that promote EMT including Smad3, NF-κΒ, MEF2, GATA, Hif1, Sp1, and RXR. The TRACER analysis did not show any significant alterations in AP2, RAR, p53, and Bcat. The most dramatic shifts in TF activity were seen in Hif1 and Sp1, as both decreased to significant levels (p < 0.005) at Day 2 and remained at that significance through Day 6. Smad3, MEF2, and GATA showed significant decreases (p < 0.05) in activity at Day 2, through not after that time point. NF-κΒ and RXR, to a lesser extent, showed delayed response in TF activity, which was significant (p < 0.05) at Day 4.
Figure 4. MDA-MB-231 cells treated with mESC CM display altered activity of multiple TFs. MDA-MB-231 cells were infected with the TF specific reporter and encapsulated in Matrigel prior to plating in a 384 well plate. BLI was used to obtain a day 0 baseline reading prior to conditioning. The cells were then treated with RM or mESC CM every 2 d for 6 d. BLI was measure every 2 d to quantify TF activity and dynamics over a period of 6 d. Cell activity following RM (dashed black line) and mESC CM (solid gray line) treatments are shown normalized to TA lentiviral activity, which correlates with cell number, and is shown with standard error bars. Statistical significance indicated along x-axis by * for p<0.05 and ** for p<0.005. Technical replicates of 4 for each TF reporter; biological replicates of 2 for Hif1, MEF2, GATA, and AP2; biological replicates of 3 for Sp1, NF-κΒ, RXR; biological replicate of 4 for Smad3.
mESC CM treatment altered phospho-Smad3 profile, expression of Smad3-regulated MMP2, phospho-GATA3 and GATA3 in MDA-MB-231 cells
The observation that Smad3 activity decreased with mESC CM treatment, directed us to further investigate the TGFβ/Smad3 signaling pathway. The TGFβ/Smad3 signaling pathway is dichotomous in nature, promoting both oncogenesis and tumor suppression. We examined this pathway at 4 d to align with our EMT gene expression data. Implementation of TRACER had identified a significant decrease at Day 2 in Smad3 activity, though this was lost at Day 4, and correlates with the lack of significant changes in Smad3 expression seen with immunoblotting (). Interestingly, mESC CM treatment did significantly decrease phosphorylation of Smad3 at the noncanonical T179 and S204 sites (). Since the phosphorylation status of Smad3 impacts Smad3-mediated gene expression, we investigated the impact of mESC CM treatment on expression of the Smad3-regulated genes associated with EMT-promoting MMP2. Treatment of MDA-MB-231 cells with mESC CM significantly decreased MMP2 expression (). Importantly, this mESC CM-induced decrease in MMP2 was not abrogated by treatment with TGFβ, which increased MMP2 in RM, nor with treatment with a Smad3 inhibitor (). Taken together, this points towards redundant pathways driving the observed phenotypic alterations.
Figure 5. MDA-MB-231 cells treated with mESC CM display altered protein expression profiles of phospho-Smad3, Smad3-mediated, and GATA3 gene expression. MDA-MB-231 cells were treated with RM or mESC CM for 4 d, after which protein was collected for immunoblotting assays. (A) Smad3 and phospho-Smad3 (T179, S204, C). (B) Cells were also treated with RM or mESC CM alone, or with the addition of TGFβ or a Smad3 inhibitor SIS3, followed by protein extraction and immunoblotting for MMP2. (C) GATA and phospho-GATA3 expression. (D) Migration potential of MDA-MB-231 cells was assessed after stable overexpression of GATA3 treated with RM or mESC CM. Immunoblots are representative and percent change from RM to CM densitometry is adjacently indicated. Statistical significance indicated by * for p<0.05 and ** for p<0.005.
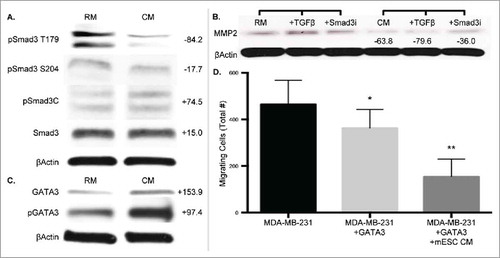
The GATA family, master regulators of hematopoietic cells, was also identified by TRACER as having altered activity in the presence of mESC CM. This result combined with a recent report describing GATA3 as mediating a reduced response to TGFβ in breast cancer cells,Citation36 and that loss of GATA3 activity is associated with aggressive breast cancer,Citation37 led to the investigation of GATA3 as a mediator of the cell phenotype. GATA3 expression was analyzed at Day 4 to complement the Smad3 and EMT gene expression data, and we observed that mESC CM treatment increased expression of GATA3 in MDA-MB-231 cells (). Furthermore, phosphorylation of GATA3, which is necessary for GATA3 translocation into the nucleus, also increased with mESC CM treatment. To correlate this GATA3 observation with our phenotypic data we performed migration assays, similar to those performed in , with MDA-MB-231 cells exhibiting overexpression of GATA3. Overexpression of GATA3 decreased the migratory potential of MDA-MB-231 cells in RM, as expected, and a further decrease in migration was shown upon treatment with mESC CM, compared to control MDA-MB-231 cells (). Collectively, these results indicate the mechanisms by which cancer cells are driven by mESC secreted factors.
Discussion
Stem cell secreted factors have been shown to abrogate aggression of cancer cells, which may be secondary to overlap in the molecular pathways of the stem and tumor microenvironments.Citation38 However, the dynamics of this reprogramming and the extent of stem cell utility have not been fully elucidated. To track the dynamic reprogramming in MDA-MB-231 cells, we employed TRACER to investigate changes in TF activity following cell exposure to mESC CM. Phenotypic and TRACER results were validated by protein and gene expression analyses.
We found that the mESC CM led to decreased breast cancer cell proliferation, migration, invasion (), and the expression of EMT markers (), while markers indicative of cell adhesion and differentiation were found to increase ( and ) when compared to unconditioned media (RM). As a control, we also analyze the influence of mouse embryonic fibroblast CM on in MDA-MB-231 cell invasion and found no significant difference when compared to RM, unlike the decrease in invasion observed following mESC CM exposure (). Additionally, the decreased expression of mesenchymal markers and MMPs, and, particularly, the re-expression of E-cadherin in MDA-MB-231 cells points toward the initiation of mesenchymal-epithelial transition (MET) (), a key restraint for metastasis that may be regulated by microenvironmental cues.Citation39 Taken together these analyses show inhibition or reprogramming of the innately invasive MDA-MB-231 cell phenotype by mESC CM.
The attenuation of mammosphere formation and self-renewal properties, in addition to a reduced CD44+/CD24− profile (), through exposure to mESC CM, indicates that CSC activity is suppressed following exposure to mESC CM. Furthermore, this effect was not transient, as the tumor cells were only incubated in RM or mESC CM prior to the mammosphere assay. Specifically, while the secondary mammosphere cells were not exposed to mESC CM, the inhibitory effect on CSC activity was sustained in secondary mammosphere culture and formation. In accordance with the CSC hypothesis,Citation40 these results indicate that the tumorigenicity and metastatic potential of these breast cancer cells are also reduced, which was confirmed by the phenotypic studies (). Several studies have shown a positive correlation between stemness, invasion, and metastatic potential, using both in vivo and in vitro characterizations.Citation35,Citation40,Citation41 While mESC CM does not completely ablate the stem-like properties of TNBC cells, others have shown a dose-dependent influence of pharmaceutical compounds on mammospheres and CD44+/CD24- expression.Citation42 Thus, following identification of underlying mechanism governing the influence of stem cells on cancer cells, it may possible to amplify the dose or exploit the underlying mechanisms that govern stemness. Moreover, CSCs role in microenvironmental dysregulation,Citation43 treatment resistance and disease relapse,Citation7 underscores the need to define CSC programming and exploit the dynamic pathways involved in reducing this potentially lethal subpopulation of cells.
To better understand these dynamics, we subsequently analyzed the underlying regulatory signaling with TRACER (11 TF constructs), which showed that 7 factors involved in tumor progression, including Smad3, NF-κΒ, MEF2, GATA, Hif1, Sp1, and RXR were inhibited by the mESC CM (). Further studies revealed that the mESC CM impacted levels of noncanonical phospho-Smad3 and Smad3-regulated gene expression (). This demonstrates the plasticity of aggressive breast cancer cells and their ability to respond to ESC signals, which could be the result of a de-differentiated molecular signature.Citation44 While the altered activity of several TFs, including NF-κΒ,Citation45 are indicated as essential for metastasis and EMT, the two most significantly and consistently modulated factors were Hif1 and Sp1. Hif1 is considered a master TF regulator of metastasis and metastatic niche formation in breast cancer cells, and has been well characterized.Citation46 Sp1, and specifically Sp1's interactions with other TFs, has more recently been shown to act downstream and synergistically with other TFs (e.g., ZEB2) in the transcriptional repression of E-cadherin.Citation47 As we found that mESC CM treatment resulted in decreased mesenchymal genes and increased E-cadherin expression, indicating a reversion of EMT phenotype (), it followed that we also identified an associated decrease in activity of the EMT-associated TFs in our array (). The time course of these alterations in TF activity raised additional points for further study, especially in the modulation of GATA and Smad3.
The altered activity of GATA identified in TRACER led us to investigate the GATA family more extensively. GATA3 has been described as an independent predictor of clinical outcome, and may be a marker for metastatic disease, particularly in TNBC.Citation37 In a mouse model of luminal breast cancer, GATA3 directly promoted tumor differentiation, which was linked to decreased metastatic potential, and loss of GATA3 directly correlated with the expansion of CSCs.Citation48 GATA3 was also linked to reversion of EMT in breast cancer cells with a report describing the ability to bind, activate, and promote expression of E-cadherin.Citation49 Since loss of E-cadherin is considered a prerequisite rate-limiting stem for EMT,Citation50 our findings, including an increase in E-cadherin and GATA3, as well as phospho-GATA3, support the notion that the embryonic microenvironment impacts metastatic phenotypes through the reversion of EMT.
The changes in Smad3 activity identified by TRACER led us to investigate the TFGβ/Smad3 signaling pathway, which is also critical to the EMT process.Citation51 Smad3 is a vital downstream mediator of the TGFβ pathway, which regulates a plethora of key cell processes including proliferation, apoptosis, migration, and differentiation.Citation52 In helper T cells, the central region of GATA3 can form a complex with the MH1 domain of Smad3.Citation53 As a function of this interaction, GATA3 promotes a genetic program of cell differentiation in cooperation with Smad3, allowing TGFβ mediated regulation of GATA3 target genes.Citation53 Additionally, more recent work utilizing the MDA-MB-231 line showed that overexpression of GATA3 resulted in decreased Smad3 expression and restored sensitivity to TGFβ mediated growth inhibition, as well as a reversion of EMT.Citation36 In our previous studies, we have demonstrated an association between inhibition of noncanonical phosphorylation of Smad3 and decreased proliferation, migration, and invasion and increased apoptosis, demonstrating the key role of phospho-specificity of Smad3 in these TGFβ mediated processes.Citation54 Our current study furthers this association, with an observed decrease in phosphorylation at the noncanonical S204 and T179 phosphorylation sites of Smad3 in MDA-MB-231 cells treated with mESC CM (). Additionally, prior work showed Smad3-associated MMP2 expression was impacted by inhibition of noncanonical Smad3 phosphorylation.Citation54 Adding to this finding, culture with mESC CM decreased expression of MMP2 and mitigated the impact of TGFβ mediated expression of MMP2 (). Taken together, these results point towards involvement of GATA3 and phospho-Smad3 in the reprogramming of metastatic breast cancer cells to a more differentiated or epithelial phenotype.
In conclusion, leveraging TRACER and complimentary protein and gene expression analyses enabled the tracking of reprogramming of aggressive TNBC cancer cells to a more benign phenotype following exposure to mESC CM. Specifically, this work highlighted the significance of Hif1 and Sp1, GATA and TGFβ/Smad3 signaling to the processes of EMT and MET. Future studies will focus on the unique cytokine profile of mESCs, and other unexplored sources, as means to identify important factors in the stem cell microenvironment needed to reprogram aggressive cancer phenotypes. Lastly, the phenotypic plasticity observed in the TNBC cells points toward the potential to target and exploit the reprogrammability of these cells towards a phenotype that may be more susceptible to conventional and also novel therapeutics.
Methods
Cell lines development, cell culture, and media conditioning
Human MDA-MB-231 and MDA-MB-436 cells were obtained from American Type Culture Collection (ATCC, Manassas, VA) and maintained in Dulbecco's Modified Medium (DMEM)-F12 supplemented with 10% FBS, according to supplier recommendations. To create the stable cell lines for proliferation and morphological analyses MDA-MB-231 cells were transduced with the gaussia luciferase (Gluc) reporter or enhanced green fluorescent protein (eGFP) vector using spinoculation procedures as described previously to create MDA-MB-231-Gluc and MDA-MB-231-GFP lines.Citation55 Infections were performed with a virus concentration of 10,000 PP/cell and by centrifuging at 800g at 32°C for 45 min; the effluent was then removed and the cells were re-suspended in fresh media and transferred to a 60mm dish for population expansion. mESCs were a generous gift from the Dr. Raj Kishore's laboratory (Northwestern University/Temple University) and were maintained in DMEM supplemented with 15% FBS, 1% Penn/Strep, 1mM nonessential amino acids, 50uM 2-mercaptoethanol, and Leukemia Inhibitor Factor (Millipore LIF2010) at 10ng/mL to maintain the ESC phenotype.Citation56 GATA3 overexpressing MDA-MB-231 cells were a generous gift from Dr. Jeffrey Green's laboratory (National Institutes of Health, National Cancer Institute) and were maintained in equivalent conditions (DMEM with 10% FBS) to the parental and modified MDA-MB-231 cell lines detailed above. Inactivated mouse embryonic fibroblasts (mEFs) from Invitrogen (Gibco #S1520-100, Carlsbad, CA) were maintained in DMEM with 10% FBS as described in our previous work.Citation57 For maintenance, mESCs and mEFs media was replaced every 2 d. For conditioning, adherent cells were rinsed with PBS then incubated in media overnight, which was subsequently filtered to obtain mESC CM and mEF CM, which was used in various assays detailed herein.Citation18 All cells were incubated at 37°C in 5% CO2.
Antibodies and reagents
Antibodies used for immunoblotting were as follows: anti-Smad3 (C67H9), anti-pSmad3 (Ser423/425, C25A9), anti-MMP2 (D2O4T), anti-MMP9 (D6O3H), and anti-proMMP9 (G657) from Cell Signaling Technology (Danvers, MA); anti-GATA3 (H-48) from Santa Cruz Biotechnology (Dallas, TX); anti-β-actin (AC-15) from Sigma-Aldrich (St. Louis, MO); anti-E-cadherin (36/E-Cadherin) from BD Biosciences (San Jose, CA); anti-phospho-Smad3 T179 (ab74062), anti-phospho-Smad3 S204 (ab63402), and anti-phopspho-GATA3 (EPR18118) from Abcam (Cambridge, MA); anti-rabbit and mouse secondary antibodies from Thermo Scientific (Pittsburgh, PA). TFGβ and Smad3 inhibitor (Smad3i, SIS3, IC50 = 3 μM) from Cayman Chemicals (Ann Arbor, MI) was used to target specific pathways in MMP2 expression as previously described.Citation54
Immunoblotting
Cells were treated as described, scraped, pelleted, and rinsed with ice-cold PBS, then lysed in ice-cold M-PER (Thermo Scientific, Rockford, IL) containing protease and phosphatase inhibitors. Cellular lysates were spun, supernatants were recovered, and the protein concentration was determined using the Bio-Rad protein assay kit. 30 μg of lysate was diluted in 2x SDS-PAGE sample buffer (1:1, v/v), electrophoresed, and transferred to a PVDF membrane. Membranes were blocked with 5% milk or 5% BSA in TBS-T at room temperature for 1 hr and incubated with appropriate primary antibody at 4°C overnight. After rinsing with TBS-T, the membrane was incubated with secondary antibody in 5% milk or 5% BSA for 1 hr at room temperature. Protein bands were visualized by an ECL detection system (GE Healthcare). When reblotting, membranes were agitated with Restore PLUS Stripping Buffer (Thermo Scientific) for 8 min at room temperature. All immunoblot experiments were repeated at least three times and representative results are shown. Densitometry was performed using ImageJ (U. S. National Institutes of Health, Bethesda, MD) with background subtraction and normalized to beta-actin. Percent difference comparing RM to CM is indicated on figures adjacent to representative blots.
Gluc proliferation assay
MDA-MB-231-Gluc cells were plated in wells of a 96 well plate in triplicate and either control RM or mESC-CM treatment was applied to the cells at Day 0. Every 2 d, the media was changed and 20 uL of media was used in a Gluc assay kit (New England Biolabs) and a luminometer (Turner Biosystems, Sunnyvale, CA) was utilized to determine Gluc production to quantify cell density. Gluc expression is presented in Relative Light Units (RLU) and plotted as a function of time.
Matrigel invasion assay
MDA-MB-231 cells were mixed with Matrigel (BD Transduction) and plated in a 24 well plate. The cells began treatment with either control RM, mESC CM, or mEF CM at Day 0, with a media change every 2 d and image acquisition occurring daily with a Nikon microscope. Cell area was quantified using Image J at each timepoint: the images were converted to 8 bit black and white and the threshold function was used to select the cells. The selected area was then measured using Image J.
Transwell migration assay
For the transwell migration assay, 10% FBS was used as a chemoattractant and added to the wells of a 24-well plate. Transwell inserts composed of 8-μm polyethylene terephthalate (PET) membranes (BD Biosciences) were placed in each well. Suspensions of serum-starved cells, which had been pre-treated for 24 hrs with RM or CM were then added to the inserts and incubated for 24 hrs, after which un-migrated cells were scrubbed from the top of the membranes with a cotton swab. Inserts were then transferred to clean 24-well plates containing 0.5% crystal violet to stain and fix the cells that had migrated to the bottom of membrane. The stained, migrated cells were counted using 10X magnification.
Quantitative RT-PCR
Total RNA was isolated from treated cells using the RNeasy Mini Kit (Qiagen, Valencia, CA). RNA concentration was determined using a Nanodrop spectrophotometer (Thermo Fisher Scientific, Waltham, MA). An equal amount of RNA (1ug total RNA per reaction) was added to each cDNA synthesis reaction using qScript cDNA Mix (Quanta Bioscience, Beverly, MA). All amplifications were run on a 7900HT Fast Real-Time PCR System (Applied Biosystems, Grand Island, NY) using the following conditions: initial denaturation, 95°C for 15 minutes, followed by 40 cycles at 95°C for 1 second and 60°C for 30 seconds. The following Taqman assays were used according to the manufacturer's instructions (Applied Biosystems); each gene name is followed by the assay ID of the probe/primer set used for reference on the Applied Biosystems website (www.appliedbiosystems.com): GAPDH (Hs03929097_g1); Vimentin (VIM; Hs00185584_m1); Fibronectin (FN1; Hs00365052_m1); Snail (SNA1; Hs00195591_m1). Gene expression was analyzed by the normalization of the threshold cycle (Ct) to GAPDH (ΔCt). ΔCt values were then compared between control samples and treated cells to calculate ΔΔCt. Final comparison of transcript ratios between samples was given as 2−ΔΔCt and is shown as fold change. Representative means +/− standard error were obtained from three technical replicates of three independent experiments.
Primary and secondary mammosphere assays
MDA-MB-231 and MDA-MB-436 cells were plated and then treated the following day with control or conditioned media. Control and treated cells were cultured for 4 d, with a media change occurring at Day 2. Following treatment, cells were trypsinized, mixed with media, centrifuged, and resuspended in 3mL PBS. Single cell suspension was obtained by gentle pipetting to avoid damage or loss of the cells. Primary studies were performed to determine an optimal seeding density. Cells were counted and 20,000 cells (at 5,000 cells per well for four wells) was transferred to a 2 mL tube, centrifuged for five minutes at 1500 rpm, and re-suspended in 40 uL mammosphere media. After thorough pipetting, 10 uL of this solution was then added to three separate wells (each condition being performed in triplicate) in a 24 well ultra-low adhesion plate, each of which already held 1 mL of DMEM/F12 (1:1) (1X) supplemented with L-Glutamine. Cells were distributed uniformly across each well and this process was carried out separately but concurrently for each treatment. After 5 d of incubation at 37°C, images of the resulting mammospheres were then obtained with a phase contrast microscope (10X) and the number of mammospheres was counted. Next, the mammospheres were disaggregated, returned to a single cell suspension, and then re-plated to test the capacity for self-renewal of the sample. The floating mammospheres were collected into 15 mL tubes, centrifuged for five minutes at 1500 rpm, re-suspended in 3 mL PBS, and made into a single cell suspension with thorough pipetting with a 1 mL pipet. The cells-per-mL ratio of this suspension was counted and plated in the same manner and at the same seeding density as the primary mammospheres. After 5 d of culture in the 37°C / 5% CO2 incubator, the secondary mammospheres were imaged, counted, and the forming efficiency was quantified. The number of formed mammospheres is a direct indication of the stem cell activity of the sample, with primary mammosphere formation reported as mammosphere forming efficiency (MFE) calculated as (Number of Mammospheres Formed/Total Number of Cells*100). Secondary formation is a measure of mammosphere self-renewal (MSR) and is calculated as (Total Number of Secondary Mammospheres formed/Total Number of Primary Mammospheres Formed*100).Citation58
Flow cytometry to analyze CD24 and CD44 expression
MDA-MB-231 cells100 μm were plated and pre-treated with RM or mESC CM for 4 d, after which the media was removed and the cells were washed with PBS. The cells were trypsinized and deactivated with wash buffer (PBS, 1% FBS, 1% Penstrep), spun down for 5 minutes at 1500 rpm, and the supernatant was aspirated. The cells were then re-suspended in 5 mL of wash buffer and counted to determine the volume needed to obtain 1 × 10⁶ cells. The cells were pipetted into an eppendorf tube for each of the two samples, spun down at 1500 rpm for 5 minutes and supernatant was removed. The pellet was re-suspended in 100uL of wash buffer and this solution was kept on ice and kept from light for the rest of the experiment. Next, fluorescently conjugated antibodies for CD44 and CD24 were added directly to the cell solution (20uL CD44-FITC and 20uL CD24-PE to each sample) and the solution was vortexed. In the control samples, 20uL FITC isotype and 20uL PE isotype controls were added. The antibody/cell suspension was incubated in the dark for 30 minutes at 4°C. Following incubation, cells were washed twice in 1mL of wash buffer to remove excess antibody and then the pellet was re-suspended and fixed in 0.5mL of 1% paraformaldehyde and vortexed. Samples were taken directly to the Northwestern Flow Cytometry Core Facility where the samples were analyzed using a Fortessa flow cytometer (BD Biosciences). The spectral overlap between FITC and PE fluorochrome emissions and the subsequent compensation values were calculated via the FACSDiva software (BD Biosciences), from unlabeled and single-antibody (single-color) controls, prior to running test samples.
TRACER transfer vector constructs and lentivirus production
An HIV-based transfer vector encoding CMV-GFPCitation59 was modified to encode TA-FLuc (plenti-TA-FLuc) by exchanging the CMV-GFP cassette with TA-FLuc from the Panomics translucent control vector (Panomics, Madison, WI) using NheI and XbaI restriction enzymes. This construct was further modified to create a library of lentivirus-producing transfer vector constructs with TF-responsive binding elements. Sequences derived from Panomics constructs were digested out of the constructs also using NheI and XbaI and ligated into the plenti-TA-FLuc backbone. For non-Panomics constructs, TRANSFAC was used to design new reporters and custom oligonucleotides were synthesized (Sigma Aldrich), annealed, and inserted into the plenti-TA-FLuc backbone using NheI and AgeI. Lentivirus for each TF reporter was produced by co-transfecting HEK-293T cells with one of the transfer vector constructs and 3 packaging plasmids (pMDL-GagPol, pRSV-Rev, and pIVS-VSV-G) using techniques described previously.Citation60 The number of physical particles (PP) for each virus batch was determined using an HIV-1 p24 Antigen ELISA kit (ZeptoMetrix, Buffalo, NY).
TRACER reporter transduction and bioluminescence quantification
To form an array, MDA-MB-231 cells were transduced with lentivirus encoding TA-FLuc or one of the TF reporter genes (25,000 PP/cell) by centrifugation, resuspension in Matrigel (BD Biosciences), and seeding into wells of a black walled 384-well plate (Greiner BioSciences, Monroe, NC). Cells were treated with control media (RM) or conditioned media (CM) at the indicated time points. For each treatment group, 11 TF reporters (TFr) were studied, in addition to the control TA-Fluc reporter. The 11 TFr included: AP2, Bcat, GATA, Hif1, MEF2, NF-κΒ, p53, RAR, RXR, Smad3, and Sp1. Selection of TFr was limited to a total of 12 (including control) in the presented study as it allowed for better parallel assessment of the difference between RM and mESC CM exposure. The selected TFr were chosen based on their use in previous studies, as well as their known role in tumor progression, as detailed in the discussion. Non-transduced cells were used to control for background imaging.
To assess FLuc activity, bioluminescence imaging was performed at the indicated time points. 1 mM d-luciferin (Perkin Elmer, Waltham, MA) was added to the wells and the plates were incubated at 37°C for 30 minutes, followed by imaging with an In Vivo Imaging System (IVIS) (Caliper, Hopkinton, MA). After each time point, treatment media in the wells was replaced. Data were analyzed using R as described previously.Citation61,Citation62 Data was background subtracted and further normalized by the average bioluminescence intensity of the control wells, TA-Fluc, for the same time and the same treatment (i.e., RM or mESC CM) and logarithmically transformed (in based 2). Finally, normalized and transformed intensities were shifted to the same initial time value by multiplying the ratio of initial measured activity to the average of all initial measured activities for a given TFr (RM and mESC CM), thus, the initial normalized value was the same across all conditions for the same TFr. R package limmaCitation63 was employed to determine differentially activated TFr versus initial time and experimental control (no treatment). False discovery rate (fdr) was used to correct for multiple comparisons.Citation64 Data were plotted using the ggplots package.Citation65 For both RM and mESC CM treatment groups, each TFr was analyzed with four technical replicates and between two and four biological replicates as indicated in the figure caption.
Statistical analysis
Results are presented as mean values +/− standard error and were analyzed by unpaired, two-tailed Student's t test or two-way ANOVA. For two-tailed Student's t test p < 0.05 was considered statistically significant unless otherwise noted in the figure caption. To account for instances with multiple comparisons, the Holm-Sidak method with an alpha of 0.05 was utilized. For proliferation and invasion assays a two-way ANOVA was used with both treatment and time being treated as independent variables. Multiple comparisons were corrected for via a Tukey test with each p-value being adjusted and family-wise significance and confidence intervals set at 0.05 (95% confidence interval). Statistical significance and false discovery rate for TRACER analysis is described above
Conflict of interest
The authors have no conflicts of interest to declare.
Acknowledgments
This work was supported by the NCI Kirchstein-NRSA Fellowship F31 under Grant CA168106-03 (ET) and NIH/NCI under Grant T32 CA09560. The authors also acknowledge financial support from the Society of Surgical Oncology – Clinical Investigator Award (to J.S. Jeruss) and NIH R01GM097220 (to J.S. Jeruss and L.D. Shea), A Sister's Hope Foundation, and the Saslow Family (J.S. Jeruss).
Additional information
Funding
References
- American Cancer Society. Cancer facts & figures. Atlanta: American Cancer Society; 2015.
- Soltanian S, Matin MM. Cancer stem cells and cancer therapy. Tumour Biol. 2011;32(3):425–440. doi:10.1007/s13277-011-0155-8.
- Huang Y, Anderle P, Bussey KJ, Barbacioru C, Shankavaram U, Dai Z, Reinhold WC, Papp A, Weinstein JN, Sadee W. Membrane transporters and channels: Role of the transportome in cancer chemosensitivity and chemoresistance. Cancer Res. 2004;64(12):4294–4301. doi:10.1158/0008-5472.CAN-03-3884.
- Fillmore CM, Kuperwasser C. Human breast cancer cell lines contain stem-like cells that self-renew, give rise to phenotypically diverse progeny and survive chemotherapy. Breast Cancer Res. 2008. 10(2):R25. doi:10.1186/bcr1982.
- Ginestier C, Hur MH, Charafe-Jauffret E, Monville F, Dutcher J, Brown M, Jacquemier J, Viens P, Kleer CG, Liu S, et al. Aldh1 is a marker of normal and malignant human mammary stem cells and a predictor of poor clinical outcome. Cell Stem Cell. 2007;1(5):555–567. doi:10.1016/j.stem.2007.08.014.
- Ponti D, Costa A, Zaffaroni N, Pratesi G, Petrangolini G, Coradini D, Pilotti S, Pierotti MA, Daidone MG. Isolation and in vitro propagation of tumorigenic breast cancer cells with stem/progenitor cell properties. Cancer Res. 2005;65(13):5506–5511. doi:10.1158/0008-5472.CAN-05-0626.
- Dean M, Fojo T, Bates S. Tumour stem cells and drug resistance. Nat Rev Cancer. 2005. 5(4):275–284. doi:10.1038/nrc1590.
- Gil J, Stembalska A, Pesz KA, Sasiadek MM. Cancer stem cells: The theory and perspectives in cancer therapy. J Appl Genet. 2008;49(2):193–199. doi:10.1007/BF03195612.
- Al-Hajj M, Wicha MS, Benito-Hernandez A, Morrison SJ, Clarke MF. Prospective identification of tumorigenic breast cancer cells. Proc Natl Acad Sci U S A. 2003;100(7):3983–3988. doi:10.1073/pnas.0530291100.
- Shimono Y, Zabala M, Cho RW, Lobo N, Dalerba P, Qian D, Diehn M, Liu H, Panula SP, Chiao E, et al. Downregulation of mirna-200c links breast cancer stem cells with normal stem cells. Cell. 2009;138(3):592–603. doi:10.1016/j.cell.2009.07.011.
- Hanahan D, Weinberg RA. Hallmarks of cancer: The next generation. Cell. 2011;144(5):646–674. doi:10.1016/j.cell.2011.02.013.
- Yaacoub K, Pedeux R, Tarte K, Guillaudeux T. Role of the tumor microenvironment in regulating apoptosis and cancer progression. Cancer Lett. 2016;378(2):150–9. doi:10.1016/j.canlet.2016.05.012.
- Reya T, Morrison SJ, Clarke MF, Weissman IL. Stem cells, cancer, and cancer stem cells. Nature. 2001;414(6859):105–111. doi:10.1038/35102167.
- Kim J, Orkin SH. Embryonic stem cell-specific signatures in cancer: Insights into genomic regulatory networks and implications for medicine. Genome Med. 2011;3(11):75. doi:10.1186/gm291.
- Abbott DE, Bailey CM, Postovit LM, Seftor EA, Margaryan N, Seftor RE, Hendrix MJ. The epigenetic influence of tumor and embryonic microenvironments: How different are they? Cancer Microenviron. 2008;1(1):13–21. doi:10.1007/s12307-008-0004-5.
- Graf T, Enver T. Forcing cells to change lineages. Nature. 2009;462(7273):587–594. doi:10.1038/nature08533.
- Rajapakse I, Groudine M, Mesbahi M. Dynamics and control of state-dependent networks for probing genomic organization. Proc Natl Acad Sci U S A. 2011;108(42):17257–17262. doi:10.1073/pnas.1113249108.
- Xu C, Inokuma MS, Denham J, Golds K, Kundu P, Gold JD, Carpenter MK. Feeder-free growth of undifferentiated human embryonic stem cells. Nat Biotech. 2001;19(10):971–974. doi:10.1038/nbt1001-971.
- Ayuzawa R, Doi C, Rachakatla RS, Pyle MM, Maurya DK, Troyer D, Tamura M. Naive human umbilical cord matrix derived stem cells significantly attenuate growth of human breast cancer cells in vitro and in vivo. Cancer Lett. 2009;280(1):31–37. doi:10.1016/j.canlet.2009.02.011.
- Giuffrida D, Rogers IM, Nagy A, Calogero AE, Brown TJ, Casper RF. Human embryonic stem cells secrete soluble factors that inhibit cancer cell growth. Cell Prolif. 2009;42(6):788–798. doi:10.1111/j.1365-2184.2009.00640.x.
- Kulesa PM, Kasemeier-Kulesa JC, Teddy JM, Margaryan NV, Seftor EA, Seftor RE, Hendrix MJ. Reprogramming metastatic melanoma cells to assume a neural crest cell-like phenotype in an embryonic microenvironment. Proc Natl Acad Sci U S A. 2006;103(10):3752–3757. doi:10.1073/pnas.0506977103.
- Postovit LM, Seftor EA, Seftor RE, Hendrix MJ. A three-dimensional model to study the epigenetic effects induced by the microenvironment of human embryonic stem cells. Stem Cells. 2006;24(3):501–505. doi:10.1634/stemcells.2005-0459.
- Postovit LM, Margaryan NV, Seftor EA, Kirschmann DA, Lipavsky A, Wheaton WW, Abbott DE, Seftor RE, Hendrix MJ. Human embryonic stem cell microenvironment suppresses the tumorigenic phenotype of aggressive cancer cells. Proc Natl Acad Sci U S A. 2008;105(11):4329–4334. doi:10.1073/pnas.0800467105.
- Qiao L, Xu Z, Zhao T, Zhao Z, Shi M, Zhao RC, Ye L, Zhang X. Suppression of tumorigenesis by human mesenchymal stem cells in a hepatoma model. Cell Res. 2008;18(4):500–507. doi:10.1038/cr.2008.40.
- Sun B, Yu KR, Bhandari DR, Jung JW, Kang SK, Kang KS. Human umbilical cord blood mesenchymal stem cell-derived extracellular matrix prohibits metastatic cancer cell mda-mb-231 proliferation. Cancer Lett. 2010;296(2):178–185. doi:10.1016/j.canlet.2010.04.007.
- Qiao L, Xu ZL, Zhao TJ, Ye LH, Zhang XD. Dkk-1 secreted by mesenchymal stem cells inhibits growth of breast cancer cells via depression of wnt signalling. Cancer Lett. 2008;269(1):67–77. doi:10.1016/j.canlet.2008.04.032.
- Bellis AD, Penalver-Bernabe B, Weiss MS, Yarrington ME, Barbolina MV, Pannier AK, Jeruss JS, Broadbelt LJ, Shea LD. Cellular arrays for large-scale analysis of transcription factor activity. Biotechnol Bioeng. 2011;108(2):395–403. doi:10.1002/bit.22916.
- Siletz A, Schnabel M, Kniazeva E, Schumacher AJ, Shin S, Jeruss JS, Shea LD. Dynamic transcription factor networks in epithelial-mesenchymal transition in breast cancer models. PLoS One. 2013;8(4):e57180. doi:10.1371/journal.pone.0057180.
- Weiss MS, Penalver Bernabe B, Bellis AD, Broadbelt LJ, Jeruss JS, Shea LD. Dynamic, large-scale profiling of transcription factor activity from live cells in 3d culture. PLoS One. 2010;5(11):e14026. doi:10.1371/journal.pone.0014026.
- Thiery JP, Acloque H, Huang RY, Nieto MA. Epithelial-mesenchymal transitions in development and disease. Cell. 2009;139(5):871–890. doi:10.1016/j.cell.2009.11.007.
- Vierbuchen T, Wernig M. Direct lineage conversions: Unnatural but useful? Nat Biotechnol. 2011;29(10):892–907. doi:10.1038/nbt.1946.
- Ginis I, Luo Y, Miura T, Thies S, Brandenberger R, Gerecht-Nir S, Amit M, Hoke A, Carpenter MK, Itskovitz-Eldor J, et al. Differences between human and mouse embryonic stem cells. Dev Biol. 2004;269(2):360–380. doi:10.1016/j.ydbio.2003.12.034.
- Lin S, Lin Y, Nery JR, Urich MA, Breschi A, Davis CA, Dobin A, Zaleski C, Beer MA, Chapman WC, et al. Comparison of the transcriptional landscapes between human and mouse tissues. Proc Natl Acad Sci U S A. 2014;111(48):17224–17229. doi:10.1073/pnas.1413624111.
- Sheridan C, Kishimoto H, Fuchs RK, Mehrotra S, Bhat-Nakshatri P, Turner CH, Goulet R, Jr., Badve S, Nakshatri H. Cd44+/cd24- breast cancer cells exhibit enhanced invasive properties: An early step necessary for metastasis. Breast Cancer Res. 2006;8(5):R59. doi:10.1186/bcr1610.
- Scheel C, Weinberg RA. Cancer stem cells and epithelial-mesenchymal transition: Concepts and molecular links. Semin Cancer Biol. 2012;22(5-6):396–403. doi:10.1016/j.semcancer.2012.04.001.
- Chu IM, Lai WC, Aprelikova O, El Touny LH, Kouros-Mehr H, Green JE. Expression of gata3 in mda-mb-231 triple-negative breast cancer cells induces a growth inhibitory response to tgfss. PLoS One. 2013;8(4):e61125. doi:10.1371/journal.pone.0061125.
- Mehra R, Varambally S, Ding L, Shen R, Sabel MS, Ghosh D, Chinnaiyan AM, Kleer CG. Identification of gata3 as a breast cancer prognostic marker by global gene expression meta-analysis. Cancer Res. 2005;65(24):11259–11264.
- Topczewska JM, Postovit LM, Margaryan NV, Sam A, Hess AR, Wheaton WW, Nickoloff BJ, Topczewski J, Hendrix MJ. Embryonic and tumorigenic pathways converge via nodal signaling: Role in melanoma aggressiveness. Nat Med. 2006;12(8):925–932. doi:10.1038/nm1448.
- Quail DF, Joyce JA. Microenvironmental regulation of tumor progression and metastasis. Nat Med. 2013;19(11):1423–1437. doi:10.1038/nm.3394.
- Charafe-Jauffret E, Ginestier C, Iovino F, Wicinski J, Cervera N, Finetti P, Hur MH, Diebel ME, Monville F, Dutcher J, et al. Breast cancer cell lines contain functional cancer stem cells with metastatic capacity and a distinct molecular signature. Cancer Res. 2009;69(4):1302–1313. doi:10.1158/0008-5472.CAN-08-2741.
- Borgna S, Armellin M, di Gennaro A, Maestro R, Santarosa M. Mesenchymal traits are selected along with stem features in breast cancer cells grown as mammospheres. Cell Cycle. 2012;11(22):4242–4251. doi:10.4161/cc.22543.
- Thakur R, Trivedi R, Rastogi N, Singh M, Mishra DP. Inhibition of stat3, fak and src mediated signaling reduces cancer stem cell load, tumorigenic potential and metastasis in breast cancer. Sci Rep. 2015;5:10194. doi:10.1038/srep10194.
- Bissell MJ, Radisky D. Putting tumours in context. Nat Rev Cancer. 2001;1(1):46–54. doi:10.1038/35094059.
- Li L, Neaves WB. Normal stem cells and cancer stem cells: The niche matters. Cancer Res. 2006;66(9):4553–4557. doi:10.1158/0008-5472.CAN-05-3986.
- Huber MA, Azoitei N, Baumann B, Grunert S, Sommer A, Pehamberger H, Kraut N, Beug H, Wirth T. Nf-kappab is essential for epithelial-mesenchymal transition and metastasis in a model of breast cancer progression. J Clin Invest. 2004;114(4):569–581. doi:10.1172/JCI200421358.
- Wong CC, Gilkes DM, Zhang H, Chen J, Wei H, Chaturvedi P, Fraley SI, Wong CM, Khoo US, Ng IO, et al. Hypoxia-inducible factor 1 is a master regulator of breast cancer metastatic niche formation. Proc Natl Acad Sci U S A. 2011;108(39):16369–16374. doi:10.1073/pnas.1113483108.
- Nam EH, Lee Y, Park YK, Lee JW, Kim S. Zeb2 upregulates integrin alpha5 expression through cooperation with sp1 to induce invasion during epithelial-mesenchymal transition of human cancer cells. Carcinogenesis. 2012;33(3):563–571. doi:10.1093/carcin/bgs005.
- Kouros-Mehr H, Bechis SK, Slorach EM, Littlepage LE, Egeblad M, Ewald AJ, Pai SY, Ho IC, Werb Z. Gata-3 links tumor differentiation and dissemination in a luminal breast cancer model. Cancer Cell. 2008;13(2):141–152. doi:10.1016/j.ccr.2008.01.011.
- Yan W, Cao QJ, Arenas RB, Bentley B, Shao R. Gata3 inhibits breast cancer metastasis through the reversal of epithelial-mesenchymal transition. J Biol Chem. 2010;285(18):14042–14051. doi:10.1074/jbc.M110.105262.
- Eastham AM, Spencer H, Soncin F, Ritson S, Merry CL, Stern PL, Ward CM. Epithelial-mesenchymal transition events during human embryonic stem cell differentiation. Cancer Res. 2007;67(23):11254–11262. doi:10.1158/0008-5472.CAN-07-2253.
- Nawshad A, Lagamba D, Polad A, Hay ED. Transforming growth factor-beta signaling during epithelial-mesenchymal transformation: Implications for embryogenesis and tumor metastasis. Cells, Tissues, Organs. 2005;179(1-2):11–23. doi:10.1159/000084505.
- Massague J. Tgf-beta signal transduction. Annu Rev Biochem. 1998;67:753–791. doi:10.1146/annurev.biochem.67.1.753.
- Blokzijl A, ten Dijke P, Ibanez CF. Physical and functional interaction between gata-3 and smad3 allows tgf-beta regulation of gata target genes. Current biology: CB. 2002;12(1):35–45. doi:10.1016/S0960-9822(01)00623-6.
- Tarasewicz E, Rivas L, Hamdan R, Dokic D, Parimi V, Bernabe BP, Thomas A, Shea LD, Jeruss JS. Inhibition of cdk-mediated phosphorylation of smad3 results in decreased oncogenesis in triple negative breast cancer cells. Cell Cycle. 2014;13(20):3191–3201. doi:10.4161/15384101.2014.950126.
- O'Doherty U, Swiggard WJ, Malim MH. Human immunodeficiency virus type 1 spinoculation enhances infection through virus binding. J Virol. 2000;74(21):10074–10080. doi:10.1128/JVI.74.21.10074-10080.2000.
- Williams RL, Hilton DJ, Pease S, Willson TA, Stewart CL, Gearing DP, Wagner EF, Metcalf D, Nicola NA, Gough NM. Myeloid leukaemia inhibitory factor maintains the developmental potential of embryonic stem cells. Nature. 1988;336(6200):684–687. doi:10.1038/336684a0.
- Tagler D, Tu T, Smith RM, Anderson NR, Tingen CM, Woodruff TK, Shea LD. Embryonic fibroblasts enable the culture of primary ovarian follicles within alginate hydrogels. Tissue Eng Part A. 2012;18(11–12):1229–1238. doi:10.1089/ten.tea.2011.0418.
- Shaw FL, Harrison H, Spence K, Ablett MP, Simoes BM, Farnie G, Clarke RB. A detailed mammosphere assay protocol for the quantification of breast stem cell activity. J Mammary Gland Biol Neoplasia. 2012;17(2):111–117. doi:10.1007/s10911-012-9255-3.
- Miyoshi H, Blömer U, Takahashi M, Gage FH, Verma IM. Development of a self-inactivating lentivirus vector. J Virol. 1998;72(10):8150–8157.
- Shin S, Shea LD. Lentivirus immobilization to nanoparticles for enhanced and localized delivery from hydrogels. Mol Ther. 2010;18(4):700–706. doi:10.1038/mt.2009.300.
- Bernabé BP, Shin S, Rios PD, Broadbelt LJ, Shea LD, Seidlits SK. Dynamic transcription factor activity networks in response to independently altered mechanical and adhesive microenvironmental cues. Integr Biol. 2016;8(8):844–860.
- R Core Team. R: A language and environment for statistical computing. Vienna, Austria: R Foundation for Statistical Computing; 2014.
- Smyth GK. Linear models and empirical bayes methods for assessing differential expression in microarray experiments. Stat Appl Genet Mol Biol. 2004;3:(1):1544–6115. doi:10.2202/1544-6115.1027.
- Benjamini Y, Hochberg Y. Controlling the false discovery rate: A practical and powerful approach to multiple testing. Journal of the royal statistical society Series B (Methodological). 1995;57(1):289–300.
- Wickham H. Ggplot2. Elegant graphics for data analysis. New York (NY):Springer Science + Business Media, LLC; 2009.