 ?Mathematical formulae have been encoded as MathML and are displayed in this HTML version using MathJax in order to improve their display. Uncheck the box to turn MathJax off. This feature requires Javascript. Click on a formula to zoom.
ABSTRACT
Background: We investigated the influence of miR-144 on the cisplatin-sensitivity of anaplastic thyroid carcinoma (ATC) cells and explored the internal molecular mechanism of miR-144.
Methods: Thyroid cancer cells ARO, TPC1 and normal thyroid cells HT-ori3 were used in this research. Expressions of miR-144 and TGF-α were uncovered by western blot and qRT-PCR. Expressions of autophagy-related protein LC3 II and apoptosis-related protein Caspase-3 and PARP were explored by western blot and immunofluorescence. Cell viability was detected by MTT assay and apoptosis condition was revealed by flow cytometric analysis and TUNEL staining. Dual-luciferase reporter assay was employed to verify the target relationship. Tissue sections were detected by IHC. Xenograft assay was conducted to further verify conclusions in vivo.
Results: MiR-144, which was low expressed in ATC cells and tissues, could inhibit autophagy activation induced by cisplatin, enhancing the sensitivity of ATC cells to cisplatin, and promoting cell apoptosis. TGF-α was the target of miR-144 and was negatively regulated by it. MiR-144 could improve the sensitivity of ATC cells to cisplatin and inhibit tumor growth by suppressing TGF-α both in vitro and in vivo.
Conclusion: MiR-144 could inhibit autophagy of ATC cells by down-regulating TGF-α, enhancing the cisplatin-sensitivity of ATC cells.
Introduction
Thyroid cancer is one of the commonest malignant tumors, influencing about 1% of the total population. Thyroid cancer is classified into several subtypes, including follicular thyroid carcinoma (FTC), papillary thyroid carcinoma (PTC), medullary thyroid carcinoma (MTC), poorly differentiated thyroid carcinoma (PDTC), and anaplastic thyroid carcinoma (ATC).Citation1 Among them, ATC is undifferentiated and aggressive, which is the least common thyroid carcinoma, accounting for 1.3% to 9.8% of all thyroid carcinomas globally.Citation2 ATC is related to high recurrence rate, and the mortality of ATC is approximately 100%. Conventional therapy methods for ATC includingsurgery resection, radiotherapy and chemotherapy have not been effective. Cisplatin, an inorganic and water-soluble platinum complex, can impair the replication and transcription of DNA, and was constantly used in the treatment of a variety of tumors.Citation3 It has been said to be feasible for inhibiting ATC progression and predict better survival outcomes of ATC patients.Citation4,Citation5 While another study revealed that cisplatin could activate autophagy that protected ATC cells from apoptosis.Citation6 Chemotherapy resistance remains currently one of the main problems ATC treatment.Citation7,Citation8 Thus, the discovery of new therapeutic targets for treating chemoresistant ATC is urgently needed.
Small noncoding microRNAs (miRNAs) are small, noncoding RNA molecules. They can bind to the 3′untranslated region (UTR) of their target mRNAs predominantly to regulate their expression.Citation9 Accumulative evidence has suggested that abnormal expression of miRNAs is a hallmark of human cancer initiation and progression. Acting as either oncogenes or tumor suppressors during tumorigenesis, they can play a causal role in the occurrence, development and progression of cancers.Citation10 MiR-144 has been identified as a tumor suppressor in a spectrum of human cancers such as lung cancer, nasopharyngeal carcinoma, hepatocellular carcinoma and clear cell renal cell carcinoma etc..Citation11-19 In addition, miR-144 has been most thoroughly studied in hepatocellular carcinoma according to our research. However, very few studies focusing on the role of miR-144 in thyroid carcinoma were published. Only that Sun et al. found that miR-144 could suppress papillary thyroid cancer progression by targeting E2F8,Citation20 and that Guan et al. found that miR-144 could also inhibit papillary and follicular thyroid carcinoma cell invasion.Citation21,Citation22 However, the study of miR-144 in ATC remained a gap field. In terms of the chemoresistance study, miR-144 was found to promote sunitinib resistance in clear cell renal cell carcinomaCitation23; whereas reverse the 5-FU resistance in hepatocellular carcinoma,Citation24 and imatinib resistance in chronic myelogenous leukemia.Citation25 In addition, miR-144 could promote cisplatin sensibilization in prostate cancer.Citation26 The studies of miR-144 in chemoresistance of various human cancers brought up an interesting study topic because of its different roles in chemotherapy of cancers. Besides of that, the study of miR-144 in thyroid cancer chemotherapy has not been paid attention to yet.
Transforming growth factor (TGF)-α is an epidermal growth factor (EGF)-related protein. Together with EGF and amphiregulin, it is a ligand for the EGF receptor (EGFR).Citation27 In a report, TGF-α was high expressed in most kinds of thyroid carcinomas.Citation28 In another study, a statistically significant correlation between the staining intensity of EGF and recurrence of PTC was found.Citation29 Moreover, according to another study, TGF-α acted as a tumor stimulator by binding to EGFR.Citation30 The number of studies on miR-144 and TGF is limited. It was pointed out that the expression of miR-144 and TGF-βT interaction was closely correlated with fibrogenesisCitation31 and lung fibrosis.Citation32 In addition, TGF-β1/Smad signaling has been identified to be significant in thyroid carcinoma.Citation33,Citation34 Especially, in ATC, TGF's interaction with Smad and Akt etc. was also frequently seen.Citation35-39 Furthermore, TGF-GFhas been found to be associated with cisplatin-resistant neoplasms.Citation40-42 As a transforming growth factor, TGF-α has not been thoroughly studied in thyroid carcinoma especially ATC with cisplatin-resistance, remaining a gap field of thyroid carcinoma.
We intended to explore how miR-144 and TGF-α affect the sensitivity of ATC cells to cisplatin, wishing to find an effective approach to ATC treatment.
Methods
Clinical sample
Five pairs of thyroid cancer tissues and adjacent tissues with complete materials and clear diagnosis were obtained from the First Hospital of Shanxi Medical University during the period of January 2012 and January 2016. The pathological conditions of all specimens with no preoperative chemotherapy or radiotherapy history were confirmed by pathology department and information of frozen tissues was obtained. The pathological sample acquirement was approved by the patients and the ethics committee of the First Hospital of Shanxi Medical University.
Cell culture
Thyroid cancer cells ARO, TPC1 and normal thyroid cells HTori3 (BeNa Culture Collection, Beijing, China) were cultured in RPMI 1640 medium + 10% fetal bovine serum (FBS), L15 + 10% FBS and F-12K + 10% FBS, respectively. The growth of cells was observed under an inverted microscope. When 70% to 80% of the bottle bottom was covered, the cells were treated with 0.25% pancreases. The cells in logarithmic phase were used for the following experiments. Human embryonic renal cell line 293T was acquired from the cell library of Chinese academy of sciences (Shanghai, China).
MiRNA transfection
The cells of the 3rd-5th generations were used for transfection. One 'd' before the transfection, cells were seeded in 60 mm cell culture bottles at the density of 1 × l06 cell/bottle and maintained in incubators at 37°C in 5% CO2. Lipofectamine 2000 (Invitrogen, Carlsbad, CA, USA) was employed for transfection. The cells were divided into miRNA transfection group (transfected with miR-144 mimics or miR-144 antagomirs) and non-specific negative control group (transfected with control miRNA).
Plasmid transfection
PcDNA3.1-TGF-α and TGF-α siRNA plasmids were synthesized by Invitrogen. The cells of logarithmic growth were selected for transfection, which was done using Lipofectamine 2000 (Invitrogen). The transfection procedure was carried out strictly in accordance with the reagent protocol. Six hours later, the cells were cultured in the corresponding culture media at 37°C in 5% CO2. The cells of each group were detected at certain time points after transfection.
Western Blot
The total cells protein was extracted and the protein samples were prepared. The OD value was measured by ELIASA and 3 compound holes were set for each group. The protein concentrations were quantified with BCA Kit (Sigma-Aldrich, St. Louis, MO, USA). Proteins were separated by sodium dodecyl sulfate polyacrylamide gel electrophoresis (SDS-PAGE) and transferred to polyvinylidene fluoride (PVDF) membranes, which were then blocked with 5% nonfat milk for 1 h. Primary antibodies (anti-TGF-α, LC3 I, LC3 II, p62, caspase-3, PARP, β-actin, dilution degrees were 1:500, 1:1000, 1:1000, 1:000, 1:1000, 1:500, BOSTER, Wuhan, China) were hybridized for 12 h at 4˚C, and were combined with the secondary antibody (BOSTER, Wuhan, China) after membranes were washed. The chemiluminescence (ECL) was then enhanced and the bands were visualized.
qRT-PCR
Total RNA was isolated and used as a template. The random primer Oligo (dT) was reverse-transcribed into cDNA, which was served as the template for PCR. The 3005P real-time PVR system of Stratagene Company was used for SYBR Green fluorescent quantitative PCR amplification. The change of TGF-α expression was calculated by MxPro (Stratagene, Santa Clara, CA, USA) and was normalized against GAPDH. All experiments were repeated for 3 times in each group. was used in the quantification of mRNA and miRNA. displayed the primer sequences.
Table 1. Sequences of primers used for qRT-PCR.
Dual-luciferase reporter gene assay
TaKaRa MutanBEST Kit (TaKaRa, Tokyo, Japan) was used to mutate TGF-α 3′-UTR. The wild-type TGF-α 3′UTR and the mutated TGF-α 3′UTR were connected to the double luciferase reporter plasmid pMIR-GLO between SacI and XbaI sites. The luciferase activity was analyzed 48 h post-transfection using dual-luciferase reporter gene assay system (Promega, Madison, WI, USA).
Autophagy assay
The cell autophagy was analyzed by immunofluorescence assay. ATC cells were transfected with green fluorescent protein (GFP)-LC3 plasmids (Invitrogen) by Lipofectamine 2000 (Invitrogen). Transfection procedures were performed in strict accordance with the reagent protocol. After 24 h of miRNAs transfection, cells were treated with cisplatin for 24 h and fixed by 4% formaldehyde phosphate buffer solution. Nuclei were stained with DAPI. Olympus BX53 fluorescence microscope (Olympus, Tokyo, Japan) was adopted to observe the number of green dots in cells on anti-quenched slides in the well plate. Generally, if there were more than 5 green highlights in a cell, it was identified as an autophagy-positive cell, with random 4 horizons per well and at least 3 wells for each group.
Flow cytometry assay
Twenty-four hours after transfection, 30 μg/ml cisplatin was added into each hole of a 6-well-plate. After 48-h incubation, cells were washed twice with PBS and digested by 0.25% trypsin. After being digested by 10% RPMI-1640, the cells were collected into the EP tubes, centrifuged at 4°C for 5 min and washed twice with 1 × PBS. The cells were then stained with FITC/AnnexinV apoptosis detection kit (BD, San Jose, CA, USA). 5 μl of Annexin-V FITC and 5 μl of propidium iodide (PI; BD) were added into the cell suspension. After being incubated for 20 min at 37°C in the dark, the staining cells were detected by the FACS Aria™ flow cytometer (BD).
MTT assay
Different groups of cells were seeded in a 96-well plate at a density of 5 × 10³ per well and then cultured in a 37°C humidified environment with 5% CO2. At the end of the drug treatment, 100 μl fresh medium with 30 μl MTT solution (Sigma-Aldrich) replaced the original culture medium. Four hours after incubation, the medium was subsequently removed and the formazan was dissolved by 100 μl dimethylsulfoxide (DMSO). The absorbance value was measured immediately at 570 nm.
Animal experiment
Anaplastic thyroid cancer cell line ARO was transfected with the hsa-miR-144 overexpressed vectors and the control vectors. After successful transfection, ARO cells were subcutaneously inoculated to 5-week-old nude mice (n = 16). 20 days later, the nude mice were divided into four groups and treated with cisplatin (3 mg/Kg, delivered medicine every other 'd'). Approximately 6 days after the inoculation, the size of the tumors of each group was measured. In the 34th 'd' of experimen3t, the nude mice were executed, dissected, and the entire tumor was removed. The volume of the tumors was calculated according to the formula: volume = length × width2/2. One part of the tumor samples were used for the western blot analysis, and another part was fixed in 4% paraformaldehyde for histopathological examination. All the experimental procedures were approved by the animal care committee of the First Hospital of Shanxi Medical University.
TUNEL staining
Forth-eight hours after transfection, the culture solution was removed. After being dried in the air, ATC cells were fixed by 40 g/L of formaldehyde solution, treated by freshly prepared 3% H2O2, and perforated by the 0.1% Triton X-100 (dissolved in 0.1% sodium citrate solution) according to the (#C1086, Beyotime, Jiangsu, China) procedure instructions. Cells were then treated by DAB, redyed by hematoxylin, dehydrated by ethanol, transpatentized by xylene, sealed by neutral gum. A fluorescence microscope was used to observe cell apoptosis.
Immunohistochemistry
Paraffin embedded tissues were sliced into 4-micrometer-thick sections, dried for 40 min at 60°C oven and dewaxed. After 10-min incubation in 3% hydrogen peroxide solution, tissues were added with the primary antibodies (Ki-67, 1:67, BOSTER, Wuhan, China) and placed in the refrigerator at 4°C overnight. Polymer enhancer was subsequently added and incubated at room temperature for 20 min. The anti-rat polymer labeled with enzyme was added later, and incubated at room temperature for 30 min. PBS (pH = 7.4) wash was conducted for 3 times, 3 min each time. Finally, PBS was removed and the tissues were observed after DAB treatment.
Statistical analysis
Each experiment was repeated at least 3 times. Statistical analysis was performed using Graph Pad Prism 6 software (Graph Pad Software Inc, CA, USA). Data were presented as mean±SD. Data processing was performed by SPSS (version 15.0) software (SPSS, Chicago, IL, USA). The comparisons between two groups were carried out by the Student's t test, while that of multi-groups were performed by variance analysis (ANOVA). P value less than 0.05 was considered as statistically significant.
Result
1. The expression of miR-144 was lower in thyroid cancer cells and tissues
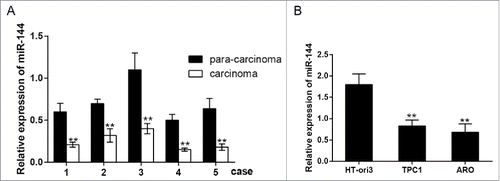
The results of qRT-PCR displayed that the expression of miR-144 in thyroid carcinoma tissue was considerably lower than that in the tissue adjacent to carcinoma (, P < 0.01); results of this assay also reflected that miR-144 was lower expressed in thyroid cancer cells ARO, TPC1 than that in normal thyroid cells HTori3 (, P < 0.01). In conclusion, the expression of miR-144 was down-regulated in thyroid carcinoma tissues and cell lines.
Figure 1. MiR-144 was down-regulated in ATC cells and tissues. A. MiR-144 low expressed in carcinoma tissues uncovered by QRT-PCR. **P < 0.01 compared with the normal tissues. B. MiR-144 low expressed in cancer cell lines ARO and TPC1 uncovered by QRT-PCR. **P < 0.01 compared with the HT-ori3 group. ATC: anaplastic thyroid carcinoma; number of carcinoma tissues = 5, number of para-carcinoma tissues = 5.
2. MiR-144 inhibited cisplatin-induced autophagy
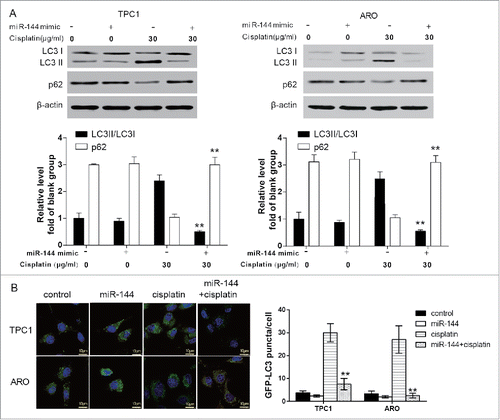
After ARO and TPC1 cells were treated with cisplatin, the expression of autophagy-related protein LC3 II and the number of GFP-LC3 II particles increased whereas that of p62 significantly decreased. The protein expression of LC3 II reached the peak at the 24 h of cisplatin treatment (, P < 0.01). The above results indicated that cisplatin could induce autophagy activation of ATC cells. On the other hand, compared with the cisplatin group, after the 24-h cisplatin treatment, the LC3 II/I ratio and the number of GFP-LC3 II particle decreased in ARO and TPC1 cells transfected with miR-144 mimics (, P < 0.01), revealing that miR-144 played an important role in preventing cisplatin-induced autophagy in ATC cells.
Figure 2. Cisplatin induced autophagy in ATC cells. A. The expression of autophagy-related protein LC3 II and p62 was determined. The LC3 II/LC3 I ratio increased and reached the peak whereas the level of p62 was the lowest at 24 hour after ARO and TPC1 cells were treated with cisplatin detected by western blot. **P < 0.01 compared with 0 h. B. GFP-LC3 puncta in cells were notably more after ARO and TPC1 cells were treated by cisplatin. **P < 0.01 compared with the control group. ATC: anaplastic thyroid carcinoma.
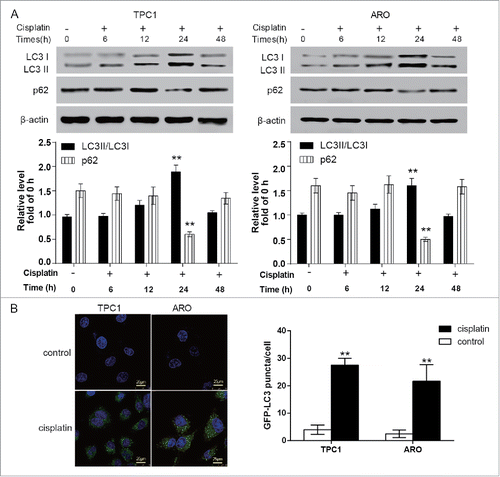
Figure 3. MiR-144 inhibited autophagy activation induced by cisplatin. A. The ratio of LC3 II/LC3 I in ARO and TPC1 cells transfected with miR-144 mimics after cisplatin treatment significantly decreased whereas the level of p62 significantly increased unveiled by western blot.**P < 0.01, compared with the cisplatin group. B. GFP-LC3 puncta in ARO and TPC1 cells transfected with miR-144 mimics after cisplatin treatment significantly decreased. **P < 0.01, compared with the cisplatin group.
3. Overexpression of miR-144 enhanced the sensitivity of ATC cells to cisplatin
The efficiency of 3-MA and chloroquine was confirmed ().The results of MTT and flow cytometry displayed that compared with cells only treated with cisplatin, cells co-treated with autophagy inhibitor 3-MA or chloroquine had remarkably weaker cell viability (, P < 0.01) and higher Annexin V staining percentage (, P < 0.01); western blot results uncovered that the expression of the apoptosis-related protein Caspase-3 and PARP were also significantly enhanced when 3-MA or chloroquine was added in cisplatin treatment (, P < 0.01). Furthermore, MTT results showed that in comparison with that of cisplatin-treated ATC cells, the cell vitality of the ATC cells with miR-144 overexpression was significantly reduced after cisplatin treatment (, P < 0.05). Western blot results unveiled that the expression of the apoptotic protein Caspase-3 and PARP increased significantly, and that of LC3 II/I decreased remarkably, proving that the overexpression of miR-144 could also promote apoptosis (, P < 0.01). In addition, the results of flow cytometry showed that miR-144 overexpression could notably improve the percentage of cells with Annexin V staining (, P < 0.01). The above results showed that in cisplatin-treated ATC cells, miR-144 functioned as autophagy inhibitor 3-MA and chloroquine, enhancing cell sensitivity to cisplatin and increasing the apoptosis by decreasing autophagy.
Figure 4. Autophagy inhibitors 3-methyl adenine (3-MA) and chloroquine promoted apoptosis of ATC cells. A. Western blot assay results suggested that 3-MA and chloroquine significantly suppressed cell autophagy. **P < 0.01, compared with the level of LC3 II/LC3 I ratio of blank group. MTT assay displayed that the cell viabilities of the 3-MA and chloroquine group were significantly down-regulated after ARO and TPC1 cells were treated with cisplatin. *P < 0.05, **P < 0.01, compared with the cisplatin group. C. Western blot displayed that the expression of cleaved caspase-3 and PARP were significantly increased in the 3-MA and chloroquine group after ARO and TPC1 cells were treated with cisplatin. **P < 0.01, compared with the cisplatin group. D. Flow cytometric analysis displayed that the percent of cells with Annexin V staining was significantly higher in 3-MA and chloroquine group. **P < 0.01 compared with the cisplatin group. ATC: anaplastic thyroid carcinoma.
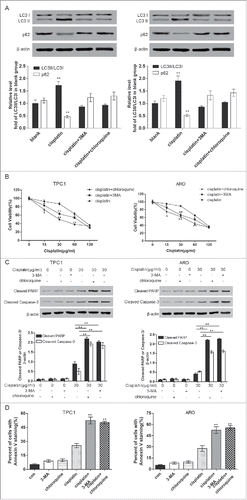
Figure 5. MiR-144 mimics enhanced sensitivity of ATC cells to cisplatin. A. MTT assay displayed that the cell viability of the miR-144 mimics group was significantly down-regulated after ARO and TPC1 cells were treated with cisplatin. *P < 0.05, **P < 0.01, compared with the cisplatin group. B. Western blot displayed that the ratio of LC3 II/LC3 I was significantly smaller whereas the expression of p62 was significantly enhanced in cells treated with cisplatin and transfected with miR-144 mimic. The expression of cleaved caspase-3 and PARP were significantly increased in miR-144 mimic group after ARO and TPC1 cells were treated with cisplatin. **P < 0.01, compared with the cisplatin group without miR-144 mimic. C. Flow cytometric analysis displayed that the percent of cells with Annexin V staining was higher in miR-144 mimics group after ARO and TPC1 cells were treated with cisplatin. **P < 0.01, compared with the cisplatin group. ATC: anaplastic thyroid carcinoma.
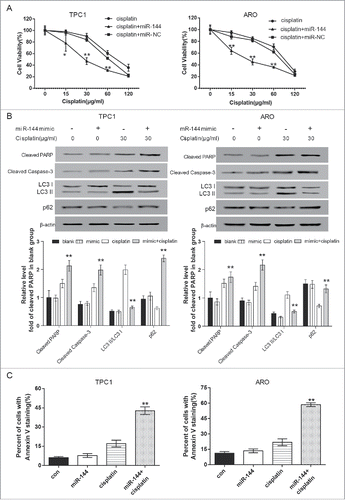
4. MiR-144 targeted at TGF-α with or without cisplatin treatment
Bioinformatics research showed the binding site of miR-144 in the TGF-α 3′-UTR (). The dual-luciferase reporter gene assay showed that in the wild type group, miR-144 mimic evidently suppressed the luciferase activity but no significant change of luciferase activity was shown in mutant group (, P < 0.01). TGF-α mRNA and protein expression was down-regulated by miR-144 mimic transfection in vehicle and cisplatin groups (, P < 0.05). The results showed miR-144 could negatively regulate TGF-α.
Figure 6. MiR-144 targeted at TGF-α. A. The binding site of miR-144 in the TGF-α 3′-UTR region uncovered by the bioinformatics algorithm. B. Luciferase reporter gene assays verified that in the wild type group, miR-144 mimics evidently suppressed the luciferase activity, but no significant change of luciferase activity was shown in mutated type group. **P < 0.01, compared with the control group. C. In ARO and TPC1 cells, TGF-α mRNA expression was down-regulated by co-treatment of miR-144 mimic and cisplatin unveiled by QRT-PCR. *P < 0.05, **P < 0.01, compared with the control group. D. In ARO and TPC1 cells, TGF-α protein expression was down-regulated by co-treatment of miR-144 mimic and cisplatin unveiled by western blot **P < 0.01, compared with the control group and cisplatin group.
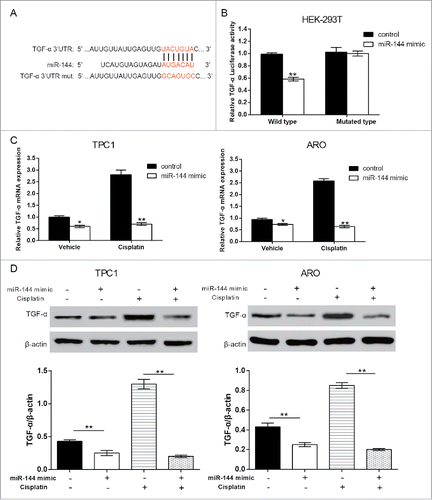
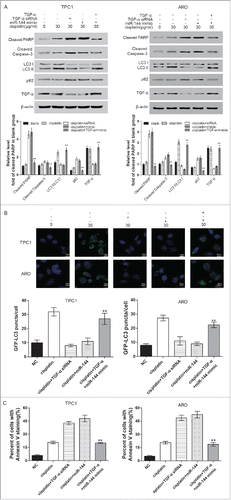
5. TGF-α knockdown inhibited autophagy and promoted apoptosis, partially reversing miR-144's effects.
In both cell lines, compared with the cisplatin group, cisplatin+TGF-α siRNA group and cisplatin+miR-144 mimics group shared a similar result that the LC3 II/LC3 I ratio was significantly inhibited whereas the level of cleaved PARP and caspase-3 was significantly enhanced. In the combination (cisplatin+TGF-α+miR-144 mimic) group, LC3 II/LC3 I ratio was significantly enhanced whereas the level of PARP and caspase-3 was significantly suppressed (, P < 0.05). Similarly, the number of GFP-LC3 puncta was significantly less in cisplatin+TGF-α siRNA group and cisplatin+miR-144 mimics group; the number was significantly more in cisplatin group and the combination group than NC group (). In addition, the percentage of cells with positive Annexin V staining was much higher in cisplatin+TGF-α siRNA group and cisplatin+miR-144 mimics group compared with in cisplatin group; whereas it was much lower in combination group than in cisplatin+miR-144 mimics group (). The above results indicated that TGF-α overexpression induced autophagy and inhibited apoptosis, which partially reversed miR-144 mimic's function.
Figure 7. Overexpression of TGF-α induced autophagy and inhibited apoptosis. A. Western blot results displayed that in ARO and TPC1 cells, LC3 II/LC3 I ratio of the cisplatin+TGF-α+miR-144 mimic group was remarkably higher while the expression of p62 was remarkably lower compared with cisplatin+miR-144 mimic group. The expression of cleaved PARP and caspase-3 was significantly lower in cells of cisplatin+TGF-α+miR-144 mimic group than in cisplatin+miR-144 mimic group. **P < 0.01, compared with cisplatin+miR-144 mimic group; #P < 0.05, compared with cisplatin group. B. GFP-LC3 puncta/cell of ARO and TPC1 cells in cisplatin+TGF-α+miR-144 mimic group was significantly higher than that of cisplatin+miR-144 group.**P < 0.01, compared with cisplatin+miR-144 mimic group; #P < 0.05, compared with cisplatin group. C. Flow cytometric analysis revealed that the percent of cells with Annexin V staining in the cisplatin+TGF-α+miR-144 mimic group was remarkably lower in comparison with that of cisplatin+miR-144 group. **P < 0.01, compared with cisplatin+miR-144 mimic group; #P < 0.05, compared with cisplatin group.
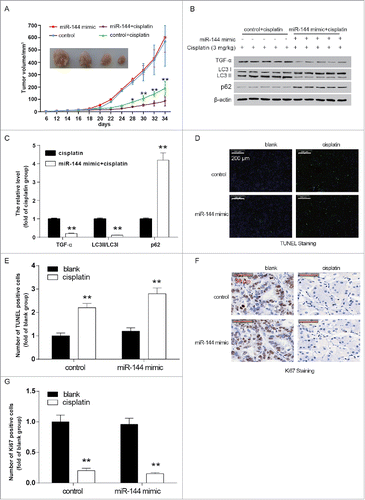
6. MiR-144 overexpression enhanced the anti-cancer effect of cisplatin in nude mice
displayed that tumor volume of mice in the miR-144+cisplatin group was significantly smaller than in the control + cisplatin group. It's noteworthy that the tumor volume of the miR-144 mimic group did not show significant difference from the control group. By comparing the control + cisplatin group and the miR-144 mimic + cisplatin group, we found that miR-144 significantly inhibited the expression of TGF-αas well as the LC3 II/LC3 I ratio (, P < 0.01). While as -G revealed, in the cisplatin+miR-144 mimic group, the apoptotic cells were significantly more than in miR-144 mimic + control group. Consistently, Ki67, a tumor proliferation marker, was seen underexpressed in cisplatin+miR-144 mimic group. These results confirmed that overexpression of miR-144 could inhibit tumor growth by enhancing the sensitivity of ATC cells to cisplatin.
Figure 8. MiR-144 overexpression enhanced the anti-cancer effect of cisplatin in nude mice. A. Tumor volume of mice in the miR-144+cisplatin group was significantly lower. *P < 0.05, **P < 0.01, compared with the cisplatin group. B. LC3 II/LC3 I ratio and TGF-α expression in implanted tumor was significantly lower in the cisplatin+miR-144 mimic group revealed by western blot. The expression of p62, on the other hand, was significantly enhanced in tumors of mice of cisplatin+miR-144 mimic group. C. The histogram showed the protein levels of TGF-α, LC3 II LC I and p62. **P < 0.01, compared with the cisplatin group. D. The apoptotic cells in cisplatin+miR-144 mimic group were more than that in the cisplatin group. E. The histogram showed the number of TUNEL positive cells in every group. **P < 0.01, compared with the blank group. F. In paraffin sections of the tumors, the cell proliferation marker, Ki67, was significantly fewer in the cisplatin+miR-144 mimic group than in the cisplatin group. G. A histogram showed the number of Ki67-positive cells.
Discussion
In this research, it was unveiled that miR-144, which was low expressed in ATC cells and tissues, could prevent the autophagy induced by cisplatin. TGF-α, the high expressed tumor promoter, was the target of miR-144. By down-regulating the expression of TGF-α, miR-144 could suppress the autophagy of ATC cells, increasing the sensitivity of ATC cells to cisplatin and accelerating apoptosis in vitro and in vivo.
We demonstrated that miR-144 was low expressed in ATC tissues and cells. The down-regulation of miR-144 was observed in numerous types of cancers. In a study on hepatocellular carcinoma (HCC), researchers found that miR-144 had a low expression in HCC tissues and cell lines.Citation43 A study about renal cell cancer revealed that the expression level of miR-144 was remarkably low in renal cell cancer specimens.Citation16 What's more, Pan et al. reported that miR-144 was down-regulated in breast cancer cell lines.Citation44 As for thyroid cancer, Guan et al. verified that the expression of miR-144 was notably lower in thyroid cancer tissues in comparison with that in normal thyroid tissues.Citation21 All of the above mentioned evidence strongly supported our finding that miR-144 was significantly suppressed in ATC.
Secondly, we validated that miR-144 could suppress autophagy engendered by cisplatin. In previous researches, a large amount of evidence proved that cisplatin acted as an autophagy stimulator in cancers. For instance, it had been verified to cause cell autophagy in ovarian cancer,Citation45 bladder cancerCitation46 and malignant mesothelioma.Citation47 While in this study, we proved that cisplatin could also induce autophagy in ATC cells. In further investigations, we employed miR-144 to exert its influence on ATC cells and unveiled it played a crucial role in autophagy suppression. In retrospect, we might think of many studies that explored the relationship between miRNAs and autophagy. For example, the overexpression of miR-23b inhibited radiation-induced autophagy in pancreatic cancer cells,Citation48 miR-21 prevented autophagy of HCC cellsCitation49; in the study of Gu et al., miR-144 could reduce hypoxia-induced autophagy in prostate cancer cellsCitation50; and according to Guo et al., miR-144 inhibited autophagy in RAW264.7 macrophage cells.Citation51 Thus, our conclusion about the effects of miR-144 on autophagy in ATC cells was persuasive.
It has been well known that miRNAs might impact the sensitivity of cancer cells to cisplatin. In accordance with the research of Yuan et al., up-regulation of miR-125b sensitized nasopharyngeal carcinoma cells to cisplatinCitation52; overexpression of miR-15b promoted the cell cisplatin-sensitivity of oral tongue squamous cell cancer.Citation53 Additionally, miR-30d and miR-144 up-regulated the chemosensitivity of ATC cellsCitation6 and prostate cancer cellsCitation26 to cisplatin therapy. In previous experiments, we had already verified that miR-144 could suppress the autophagy induced by cisplatin. Subsequently, we compared the functions of autophagy inhibitors and miR-144 on ATC cells treated with cisplatin and concluded that, just like autophagy inhibitors, miR-144 could not only inhibit autophagy, but also promote cell apoptosis, further indicating that miR-144 played a positive role in enhancing cisplatin-sensitivity of ATC cells.
MiR-144 had been reported to serve as an anti-tumor molecule by targeting at SMAD4, RLIP76 and PTEN in HCC,Citation19 gastric cancerCitation54 and nasopharyngeal carcinomaCitation12 correspondingly. While as for TGF-α, it was unveiled to be targeted by miR-505, miR-205 and miR-374a in endometrial cancer,Citation55 osteosarcomaCitation56 and lung adenocarcinoma.Citation57 Both miR-144 and TGF-α showed proved target relationships with other molecules in human cancers. In this study, we for the first time verified the target relationship between miR-144 and TGF-b in ATC. After a series of experiments, we discovered that miR-144 could target TGF-α, resulting in the aberrant downregulation of TGF-α. We then found that high expression of TGF-α induced autophagy and inhibited apoptosis of ATC cells. In a study of endometrial cancer, researchers discovered that miR-505 could enhance cell apoptosis by reducing the expression of TGF-αCitation55; while in a study on osteosarcoma, cell apoptosis could be accelerated by the down-regulation of TGF-α.Citation56 These were in line with our results and indicated that the overexpression of TGF-α in ATC promoted cancer development.
Although some limitations remain in this study, for instance, there are more than one targets of miR-144, which may bring up sophisticated network that is involved in ATC initiation and development. We proved that the sensitivity to cisplatin of ATC cells could be improved by miR-144 overexpression by suppressing TGF-α, indicating the therapeutic potential of miR-144 in ATC treatment.
Conclusion
To sum up, we verified that the up-regulation of miR-144 could considerably improve the insensitivity of ATC cells to cisplatin by suppressing its target gene TGF-α, making cisplatin to exert its anti-tumor functions better, and contributing to the development of ATC treatment.
Abbreviations
| ANOVA | = | variance analysis |
| ATC | = | anaplastic thyroid carcinoma |
| DMSO | = | dimethylsulfoxide |
| DMEM | = | Dulbecco's modified eagle's medium |
| ECL | = | enhanced chemiluminescence |
| EGF | = | epidermal growth factor |
| EGFR | = | epidermal growth factor receptor |
| FTC | = | follicular thyroid carcinoma |
| HCC | = | hepatocellular carcinoma. |
| MTC | = | medullary thyroid carcinoma |
| miRNAs, | = | microRNAs |
| PVDF | = | polyvinylidene fluoride |
| PTC | = | papillary thyroid carcinoma |
| PDTC | = | poorly differentiated thyroid carcinoma |
| SDS-PAGE | = | sodium dodecyl sulfate polyacrylamide gel electrophoresis |
| UTR | = | untranslated region |
Declarations
Ethics approval and consent to participate: All the experimental procedures were approved by the animal care committee of the First Hospital of Shanxi Medical University.
Consent for publication: This manuscript has been approved by all authors for publication.
Authors' contributions
Substantial contribution to the conception and design of the work: Jing Liu, Liguo Feng; Analysis and interpretation of the data: Haitao Zhang, Jin Zhang, Long Qin; Drafting the manuscript: Ziyao Yang, Shujing Li, Jianxia Xiong; Revising the work critically for important intellectual content: Jing Liu, Yanyan Zhang, Liguo Feng; Final approval of the work: all authors.
Disclosure of potential conflicts of interest
No potential conflicts of interest were disclosed.
References
- Schlumberger M, Tahara M, Wirth LJ, Robinson B, Brose MS, Elisei R, Habra MA, Newbold K, Shah MH, Hoff AO, et al. Lenvatinib versus placebo in radioiodine-refractory thyroid cancer. N Eng J Med. 2015;372:621–30. doi:10.1056/NEJMoa1406470.
- Smallridge RC, Copland JA. Anaplastic thyroid carcinoma: pathogenesis and emerging therapies. Clin Oncol. 2010;22:486–97. doi:10.1016/j.clon.2010.03.013.
- Cvitkovic E, Spaulding J, Bethune V, Martin J, Whitmore WF. Improvement of cis-dichlorodiammineplatinum (NSC 119875): therapeutic index in an animal model. Cancer. 1977;39:1357–61. doi:10.1002/1097-0142(197704)39:4%3c1357::AID-CNCR2820390402%3e3.0.CO;2-C. PMID:856436.
- Seto A, Sugitani I, Toda K, Kawabata K, Takahashi S, Saotome T. Chemotherapy for anaplastic thyroid cancer using docetaxel and cisplatin: report of eight cases. Surgery Today. 2015;45:221–6. doi:10.1007/s00595-013-0751-x. PMID:25734195.
- Derbel O, Limem S, Segura-Ferlay C, Lifante JC, Carrie C, Peix JL, Borson-Chazot F, Bournaud C, Droz JP, de la Fouchardière C. Results of combined treatment of anaplastic thyroid carcinoma (ATC). BMC Cancer. 2011;11:469. doi:10.1186/1471-2407-11-469. PMID:22044775.
- Zhang Y, Yang WQ, Zhu H, Qian YY, Zhou L, Ren YJ, Ren XC, Zhang L, Liu XP, Liu CG, et al. Regulation of autophagy by miR-30d impacts sensitivity of anaplastic thyroid carcinoma to cisplatin. Biochem Pharmacol. 2014;87:562–70. doi:10.1016/j.bcp.2013.12.004. PMID:24345332.
- Ranganath R, Shah MA, Shah AR. Anaplastic thyroid cancer. Curr Opin Endocrinol Diabetes Obesity. 2015;22:387–91. doi:10.1097/MED.0000000000000189.
- Perri F, Lorenzo GD, Scarpati GD, Buonerba C. Anaplastic thyroid carcinoma: A comprehensive review of current and future therapeutic options. World J Clin Oncol. 2011;2:150–7. doi:10.5306/wjco.v2.i3.150. PMID:21611089.
- Shukla GC, Singh J, Barik S. MicroRNAs: Processing, maturation, target recognition and regulatory functions. Mol Cell Pharmacol. 2011;3:83–92. PMID:22468167.
- Iorio MV, Croce CM. Causes and consequences of microRNA dysregulation. Cancer J. 2012;18:215–22. doi:10.1097/PPO.0b013e318250c001. PMID:22647357.
- Chen S, Li P, Li J, Wang Y, Du Y, Chen X, et al. MiR-144 inhibits proliferation and induces apoptosis and autophagy in lung cancer cells by targeting TIGAR. Cell Physiol Biochem Int J Exp Cell Physiol Biochem Pharmacol. 2015;35:997–1007. doi:10.1159/000369755.
- Zhang LY, Ho-Fun Lee V, Wong AM, Kwong DL, Zhu YH, Dong SS, Kong KL, Chen J, Tsao SW, Guan XY, et al. MicroRNA-144 promotes cell proliferation, migration and invasion in nasopharyngeal carcinoma through repression of PTEN. Carcinogenesis. 2013;34:454–63. doi:10.1093/carcin/bgs346. PMID:23125220.
- Bao H, Li X, Li H, Xing H, Xu B, Zhang X, Liu Z. MicroRNA-144 inhibits hepatocellular carcinoma cell proliferation, invasion and migration by targeting ZFX. J Biosci. 2017;42:103–11. doi:10.1007/s12038-016-9662-5. PMID:28229969.
- He Q, Wang F, Honda T, Lindquist DM, Dillman JR, Timchenko NA, Redington AN. Intravenous miR-144 inhibits tumor growth in diethylnitrosamine-induced hepatocellular carcinoma in mice. Tumour Biol. 2017;39:1010428317737729. doi:10.1177/1010428317737729. PMID:29072132.
- Liang HW, Ye ZH, Yin SY, Mo WJ, Wang HL, Zhao JC, Liang GM, Feng ZB, Chen G, Luo DZ. A comprehensive insight into the clinicopathologic significance of miR-144-3p in hepatocellular carcinoma. Onco Targets Ther. 2017;10:3405–19. doi:10.2147/OTT.S138143. PMID:28744145.
- Liu F, Chen N, Xiao R, Wang W, Pan Z. miR-144-3p serves as a tumor suppressor for renal cell carcinoma and inhibits its invasion and metastasis by targeting MAP3K8. Biochem Biophys Res Commun. 2016;480:87–93. doi:10.1016/j.bbrc.2016.10.004. PMID:27717821.
- Wu M, Huang C, Huang X, Liang R, Feng Y, Luo X. MicroRNA-144-3p suppresses tumor growth and angiogenesis by targeting SGK3 in hepatocellular carcinoma. Oncol Rep. 2017;38:2173–81. doi:10.3892/or.2017.5900. PMID:28849156.
- Xiang C, Cui SP, Ke Y. MiR-144 inhibits cell proliferation of renal cell carcinoma by targeting MTOR. J Huazhong Univ Sci Technolog Med Sci. 2016;36:186–92. doi:10.1007/s11596-016-1564-0. PMID:27072960.
- Yu M, Lin Y, Zhou Y, Jin H, Hou B, Wu Z, Li Z, Jian Z, Sun J. MiR-144 suppresses cell proliferation, migration, and invasion in hepatocellular carcinoma by targeting SMAD4. Onco Targets Ther. 2016;9:4705–14. doi:10.2147/OTT.S88233. PMID:27536132.
- Sun J, Shi R, Zhao S, Li X, Lu S, Bu H, Ma X, Su C. E2F8, a direct target of miR-144, promotes papillary thyroid cancer progression via regulating cell cycle. J Exp Clin Cancer Res. 2017;36:40. doi:10.1186/s13046-017-0504-6. PMID:28270228.
- Guan H, Liang W, Xie Z, Li H, Liu J, Liu L, Xiu L, Li Y. Down-regulation of miR-144 promotes thyroid cancer cell invasion by targeting ZEB1 and ZEB2. Endocrine. 2015;48:566–74. doi:10.1007/s12020-014-0326-7. PMID:24968735.
- Rossing M, Borup R, Henao R, Winther O, Vikesaa J, Niazi O, Godballe C, Krogdahl A, Glud M, Hjort-Sørensen C, et al. Down-regulation of microRNAs controlling tumourigenic factors in follicular thyroid carcinoma. J Mol Endocrinol. 2012;48:11–23. doi:10.1530/JME-11-0039. PMID:22049245.
- Xiao W, Lou N, Ruan H, Bao L, Xiong Z, Yuan C, Tong J, Xu G, Zhou Y, Qu Y, et al. Mir-144-3p promotes cell proliferation, metastasis, Sunitinib resistance in clear cell renal cell carcinoma by downregulating ARID1A. Cell Physiol Biochem 2017; 43:2420–33. doi:10.1159/000484395. PMID:29073615.
- Zhou S, Ye W, Zhang Y, Yu D, Shao Q, Liang J, Zhang M. miR-144 reverses chemoresistance of hepatocellular carcinoma cell lines by targeting Nrf2-dependent antioxidant pathway. Am J Transl Res. 2016;8:2992–3002. PMID:27508019.
- Liu L, Wang S, Chen R, Wu Y, Zhang B, Huang S, Zhang J, Xiao F, Wang M, Liang Y. Myc induced miR-144/451 contributes to the acquired imatinib resistance in chronic myelogenous leukemia cell K562. Biochem Biophys Res Commun. 2012;425:368–73. doi:10.1016/j.bbrc.2012.07.098. PMID:22842456.
- Liu F, Wang J, Fu Q, Zhang X, Wang Y, Liu J, Huang J, Lv X. VEGF-activated miR-144 regulates autophagic survival of prostate cancer cells against Cisplatin. Tumour Biol. 2015;37;15627–33. doi:10.1007/s13277-015-4383-1. PMID:26566625.
- Madala SK, Korfhagen TR, Schmidt S, Davidson C, Edukulla R, Ikegami M, Violette SM, Weinreb PH, Sheppard D, Hardie WD. Inhibition of the alphavbeta6 integrin leads to limited alteration of TGF-alpha-induced pulmonary fibrosis. Am J Physiol Lung Cell Mol Physiol. 2014;306:L726–35. doi:10.1152/ajplung.00357.2013. PMID:24508732.
- Bergstrom JD, Westermark B, Heldin NE. Epidermal growth factor receptor signaling activates met in human anaplastic thyroid carcinoma cells. Exp Cell Res. 2000;259:293–9. doi:10.1006/excr.2000.4967. PMID:10942601.
- Schiff BA, McMurphy AB, Jasser SA, Younes MN, Doan D, Yigitbasi OG, Kim S, Zhou G, Mandal M, Bekele BN, et al. Epidermal growth factor receptor (EGFR) is overexpressed in anaplastic thyroid cancer, and the EGFR inhibitor gefitinib inhibits the growth of anaplastic thyroid cancer. Clin Cancer Res. 2004;10:8594–602. doi:10.1158/1078-0432.CCR-04-0690. PMID:15623643.
- Chang JW, Yeh KY, Shen YC, Hsieh JJ, Chuang CK, Liao SK, Tsai LH, Wang CH. Production of multiple cytokines and induction of cachexia in athymic nude mice by a new anaplastic thyroid carcinoma cell line. J Endocrinol. 2003;179:387–94. doi:10.1677/joe.0.1790387. PMID:14656208.
- Liu Z, Yi J, Ye R, Liu J, Duan Q, Xiao J, Liu F. miR-144 regulates transforming growth factor-beta1 iduced hepatic stellate cell activation in human fibrotic liver. Int J Clin Exp Pathol. 2015;8:3994–4000. PMID:26097586.
- Xu Z, Ramachandran S, Gunasekaran M, Zhou F, Trulock E, Kreisel D, Hachem R, Mohanakumar T. MicroRNA-144 dysregulates the transforming growth factor-beta signaling cascade and contributes to the development of bronchiolitis obliterans syndrome after human lung transplantation. J Heart Lung Transplant. 2015;34:1154–62. doi:10.1016/j.healun.2015.03.021. PMID:25979625.
- Zhao JJ, Hao S, Wang LL, Hu CY, Zhang S, Guo LJ, Zhang G, Gao B, Jiang Y, Tian WG, et al. Long non-coding RNA ANRIL promotes the invasion and metastasis of thyroid cancer cells through TGF-beta/Smad signaling pathway. Oncotarget. 2016;7:57903–18. PMID:27507052.
- Garcia-Rendueles AR, Rodrigues JS, Garcia-Rendueles ME, Suarez-Farina M, Perez-Romero S, Barreiro F, Bernabeu I, Rodriguez-Garcia J, Fugazzola L, Sakai T, et al. Rewiring of the apoptotic TGF-beta-SMAD/NFkappaB pathway through an oncogenic function of p27 in human papillary thyroid cancer. Oncogene. 2017;36:652–66. doi:10.1038/onc.2016.233. PMID:27452523.
- Sun W, Xu Y, Zhao C, Hao F, Chen D, Guan J, Zhang K. Targeting TGF-beta1 suppresses survival of and invasion by anaplastic thyroid carcinoma cells. Am J Transl Res. 2017;9:1418–25. PMID:28386367.
- Li Y, Chen D, Hao FY, Zhang KJ. Targeting TGF-beta1 and AKT signal on growth and metastasis of anaplastic thyroid cancer cell in vivo. Eur Rev Med Pharmacol Sci. 2016;20:2581–7. PMID:27383308.
- Yin Q, Liu S, Dong A, Mi X, Hao F, Zhang K. Targeting Transforming Growth Factor-Beta1 (TGF-beta1) inhibits tumorigenesis of anaplastic thyroid carcinoma cells through ERK1/2-NFkappakB-PUMA signaling. Med Sci Monit. 2016;22:2267–77. doi:10.12659/MSM.898702. PMID:27356491.
- Zhang K, Liu X, Hao F, Dong A, Chen D. Targeting TGF-beta1 inhibits invasion of anaplastic thyroid carcinoma cell through SMAD2-dependent S100A4-MMP-2/9 signalling. Am J Transl Res. 2016;8:2196–209. PMID:27347327.
- Rhee YH, Moon JH, Choi SH, Ahn JC. Low-level laser therapy promoted aggressive proliferation and angiogenesis through decreasing of transforming growth factor-beta1 and increasing of Akt/Hypoxia inducible Factor-1alpha in anaplastic thyroid cancer. Photomed Laser Surg. 2016;34:229–35. doi:10.1089/pho.2015.3968. PMID:27078192.
- Yang L, Zhang F, Wang X, Tsai Y, Chuang KH, Keng PC, Lee SO, Chen Y. A FASN-TGF-beta1-FASN regulatory loop contributes to high EMT/metastatic potential of cisplatin-resistant non-small cell lung cancer. Oncotarget. 2016;7:55543–54. PMID:27765901.
- Xu S, Xue C, Li J, Bi Y, Cao Y. Marek's disease virus type 1 microRNA miR-M3 suppresses cisplatin-induced apoptosis by targeting Smad2 of the transforming growth factor beta signal pathway. J Virol. 2011;85:276–85. doi:10.1128/JVI.01392-10. PMID:20962090.
- Tavassoli M, Soltaninia J, Rudnicka J, Mashanyare D, Johnson N, Gaken J. Tamoxifen inhibits the growth of head and neck cancer cells and sensitizes these cells to cisplatin induced-apoptosis: role of TGF-beta1. Carcinogenesis. 2002;23:1569–75. doi:10.1093/carcin/23.10.1569. PMID:12376463.
- Ooft ML, Braunius WW, Heus P, Stegeman I, van Diest PJ, Grolman W, Zuur CI, Willems SM. Prognostic significance of the EGFR pathway in nasopharyngeal carcinoma: a systematic review and meta-analysis. Biomarkers Med. 2015;9:997–1010. doi:10.2217/bmm.15.68.
- Pan Y, Zhang J, Fu H, Shen L. miR-144 functions as a tumor suppressor in breast cancer through inhibiting ZEB1/2-mediated epithelial mesenchymal transition process. OncoTargets Therapy. 2016;9:6247–55. doi:10.2147/OTT.S103650. PMID:27785072.
- Liu M, Bamodu OA, Huang WC, Zucha MA, Lin YK, Wu ATH, et al. 4-Acetylantroquinonol B suppresses autophagic flux and improves cisplatin sensitivity in highly aggressive epithelial cancer through the PI3K/Akt/mTOR/p70S6K signaling pathway. Toxicol Applied Pharmacol. 2017;325:48–60. doi:10.1016/j.taap.2017.04.003.
- Fan Z, Huangfu X, Liu Z. Effect of autophagy on cisplatin-induced bladder cancer cell apoptosis. Panminerva Medica. 2017;59:1–8. PMID:27433879.
- Lee YJ, Lee GJ, Yi SS, Heo SH, Park CR, Nam HS, Cho MK, Lee SH. Cisplatin and resveratrol induce apoptosis and autophagy following oxidative stress in malignant mesothelioma cells. Food Chem Toxicol Int J Published Br Industrial Biol Res Association. 2016;97:96–107. doi:10.1016/j.fct.2016.08.033.
- Wang P, Zhang J, Zhang L, Zhu Z, Fan J, Chen L, Zhuang L, Luo J, Chen H, Liu L, et al. MicroRNA 23b regulates autophagy associated with radioresistance of pancreatic cancer cells. Gastroenterology. 2013;145:1133-43 e12. doi:10.1053/j.gastro.2013.07.048.
- He C, Dong X, Zhai B, Jiang X, Dong D, Li B, Jiang H, Xu S, Sun X. MiR-21 mediates sorafenib resistance of hepatocellular carcinoma cells by inhibiting autophagy via the PTEN/Akt pathway. Oncotarget. 2015;6:28867–81. doi:10.18632/oncotarget.4814. PMID:26311740.
- Gu H, Liu M, Ding C, Wang X, Wang R, Wu X, Fan R. Hypoxia-responsive miR-124 and miR-144 reduce hypoxia-induced autophagy and enhance radiosensitivity of prostate cancer cells via suppressing PIM1. Cancer Med. 2016;5:1174–82. doi:10.1002/cam4.664. PMID:26990493.
- Guo L, Zhou L, Gao Q, Zhang A, Wei J, Hong D, Chu Y, Duan X, Zhang Y, Xu G, et al. MicroRNA-144-3p inhibits autophagy activation and enhances Bacillus Calmette-Guerin infection by targeting ATG4a in RAW264.7 macrophage cells. PloS One. 2017;12:e0179772. doi:10.1371/journal.pone.0179772. PMID:28636635.
- Yuan TZ, Zhang HH, Lin XL, Yu JX, Yang QX, Liang Y, Deng J, Huang LJ, Zhang XP. microRNA-125b reverses the multidrug resistance of nasopharyngeal carcinoma cells via targeting of Bcl-2. Mol Med Reports. 2017;15:2223–8. doi:10.3892/mmr.2017.6233.
- Ali SM, Yao M, Yao J, Wang J, Cheng Y, Schrock AB, Chirn GW, Chen H, Mu S, Gay L, et al. Comprehensive genomic profiling of different subtypes of nasopharyngeal carcinoma reveals similarities and differences to guide targeted therapy. Cancer. 2017;123:3628–37. doi:10.1002/cncr.30781. PMID:28581676.
- Ren K, Liu QQ, An ZF, Zhang DP, Chen XH. MiR-144 functions as tumor suppressor by targeting PIM1 in gastric cancer. Eur Rev Med Pharmacological Sci. 2017;21:3028–37.
- Chen S, Sun KX, Liu BL, Zong ZH, Zhao Y. MicroRNA-505 functions as a tumor suppressor in endometrial cancer by targeting TGF-alpha. Mol Cancer. 2016;15:11. doi:10.1186/s12943-016-0496-4. PMID:26832151.
- Yang G, Zhang P, Lv A, Liu Y, Wang G. MiR-205 functions as a tumor suppressor via targeting TGF-alpha in osteosarcoma. Exp Mol Pathol. 2016;100:160–6. doi:10.1016/j.yexmp.2015.12.010. PMID:26708425.
- Wu H, Liu Y, Shu XO, Cai Q. MiR-374a suppresses lung adenocarcinoma cell proliferation and invasion by targeting TGFA gene expression. Carcinogenesis. 2016;37:567–75. doi:10.1093/carcin/bgw038. PMID:27207663.
