
ABSTRACT
Objectives: This research aimed to explore the role of miR-135a-5p in head and neck squamous cell carcinoma (HNSCC) cells and its influence on cell viability. Moreover, we aimed to compare effects of miR-135a-5p and miR-494 in HNSCC, which was found to repress HOXA10 expression in oral cancer. Methods: The association between miR-135a-5p and HOXA10 was confirmed by green fluorescence protein reporter assay and qRT-PCR. The expression levels of HOXA10 in HNSCC cell lines (CAL-27, FaDu and NEC) were examined using western blot. The expression levels of HOXA10 in FaDu cells and CAL-27 cells were examined by western blot after transfection with miR-135a-5p mimics and miR-494 mimics. Colony formation assay and flow cytometry assay were respectively utilized to detect the proliferation and apoptosis of HNSCC cells after transfection with HOXA10 plasmids and HOXA10-KO plasmids. In vitro tumor xenograft experiments were performed to analyze the inhibitive effect of miR-135a-5p on HOXA10 in BALA/c mice. Results: HOXA10 was overexpressed in HNSCC cells, while miR-135a-5p was under-expressed. Therefore, low expression of HOXA10 lengthened disease-free survival time and overall survival time. MiR-135a-5p overexpression could inhibit HOXA10 expression by directly targeting HOXA10 3′UTR, and the inhibition was more effective than miR-494. HOXA10 suppression inhibited proliferation and enhanced apoptosis of HNSCC cells. In vivo experiments showed that miR-135a-5p could decelerate the growth of tumor cells in mice by downregulating HOXA10 expression. Conclusion: MiR-135a-5p could repress HNSCC cells proliferation and enhance apoptosis by directly targeting HOXA10, implying miR-135a-5p's significance on HNSCC treatment.
KEYWORDS:
Introduction
Head and neck squamous cell carcinoma (HNSCC) is the sixth most prevalent cancer in the world, with approximately 780,000 new cases and nearly 350,000 deaths annually.Citation1,Citation2 Although the application of interdisciplinary treatments has improved the quality of life, the overall survival rate and prognosis remain poor. Current therapeutic strategies, including surgery and chemoradiotherapy, had serious side effects, such as vascular erosion after radiotherapy.Citation3 The appropriate treatment of HNSCC remains a major challenge.Citation1,Citation4 Obstacles in achieving early remission of HNSCC still exist because of the lack of robust predictive biomarkers to guide diagnostic and therapeutic selection.
Acting as post-transcriptional regulators by binding to complementary sequences in the 3′ untranslated regions (3′-UTRs) of target mRNAs, microRNAs (miRNAs) are short (∼22 nucleotides) non-protein coding RNAs.Citation5 MiRNAs play roles in the pathogenesis of various human cancers. Some miRNAs function as oncogenes while others as tumor suppressors, although the mechanisms remain unknown.Citation6 Many studies have been actively explored the relationship between miRNA expression profile and HNSCC prognosis. A previous study has found that miR-135a-5p is significantly overexpressed in hepatitis C virus-positive livers of patients.Citation7 Yet, the role for miR-135a-5p in HNSCC cells has not yet been confirmed. Whether overexpressing or replenishing miR-135a-5p might be a useful therapeutic strategy in treatment of HNSCC still remains unclear.Citation7
As members of the superfamily of homeobox genes, HOX genes encode transcription factors involved in the control of cell growth and identity, as well as in cell-cell and cell-extracellular matrix interactions.Citation8 The HOX gene family plays important roles in the formation and morphogenesis of embryonic pattern.Citation9 HOXA10 has been examined as an oncogene in leukemia.Citation10 In HNSCC, 18 HOX genes show higher levels of expression in pre-malignant and cancer tissues compared to normal tissues, including HOXA10.Citation11 However, only a few studies explored the extent and relative importance of HOXA10 in HNSCC carcinogenesis. Since some studies have discovered that several of miRNAs such as miR-218, miR-320 and miR-196b can regulate the expression of HOXA10,Citation6,Citation12,Citation13 this study aims to explore the correlation between miR-135a-5p and HOXA10 in modulating HNSCC development. Furthermore, we made some comparison between the effects of miR-135a-5p and miR-494 which has been proved to repress HOXA10 expression in oral cancer.Citation14 Our study confirms that miR-135a-5p plays a pivotal role in tumor growth, and may be a promising prognostic biomarker and useful therapeutic agent in the treatment of patients with HNSCC.
Results
HOXA10 was overexpressed in HNSCC tissues
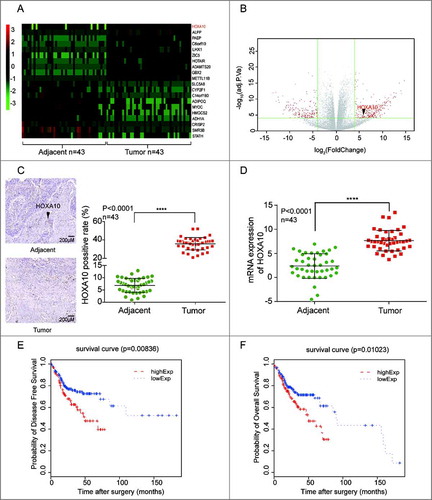
43 pairs of tumor tissues and normal tissues of HNSCC patients were subjected to chip analysis. Differentially expressed genes with | Log2(fold change) |>4 and P<0.0001 were shown in the volcano plot. Symbols and expressions of representative genes in each sample were presented in the heat map. As shown in A, HOXA10 had higher expression in tumor tissues compared with corresponding normal tissues. The expression quantity of HOXA10 in the tumor tissues was about 6.87 times higher than that in the paired normal tissues (B). The result had significant statistical importance (P = 1.55 × 10⁻⁸). HOXA10 protein expression in tumor tissues was significantly higher than that in adjacent tissues (P<0.0001, n = 43, C). The expression level of mRNA of HOXA10 in the tumor tissues was higher than that in adjacent tissues (P<0.0001, n = 43, D). According to the analysis to 291 HNSCC cases in The Cancer Genome Atlas database, the disease-free survival (E) and overall survival (F) of low HOXA10 expression was remarkably higher than high HOXA10 expression group(P = 0.00836, P = 0.01023). Detailed information about how to separate HOXA10 high expression group and low expression group could be referred to Table S1. HOXA10 could also serve as an independent prognosis factor as suggested in Table S2 as well.
Figure 1. HOXA10 was overexpressed in HNSCC. (A) HOXA10 expression in 43 tumor samples relative to the corresponding normal tissues. (B) The expression quantity of HOXA10 in the tumor tissues was about 6.87 times higher than that in the paired normal tissues. (C) The expression of HOXA10 protein in tumor tissues was significantly higher than that in tissues adjacent to cancer (****P<0.0001, n = 43, compared with tumor adjacent group). (D) The expression level of mRNA of HOXA10 in the tumor tissues was higher than that in tissues adjacent to cancer (****P<0.0001, n = 43, compared with tumor adjacent group). (E-F) According to the analysis to 291 HNSCC cases in TCGA data base, the overall survival of low HOXA10 expression patients (P = 0.01023, compared with low HOXA10 expression group) and disease-free survival (P = 0.00836, compared with low HOXA10 expression group) of low HOXA10expression was better than that of high HOXA10 expression.
miR-135a-5p was under-expressed in HNSCC tissues
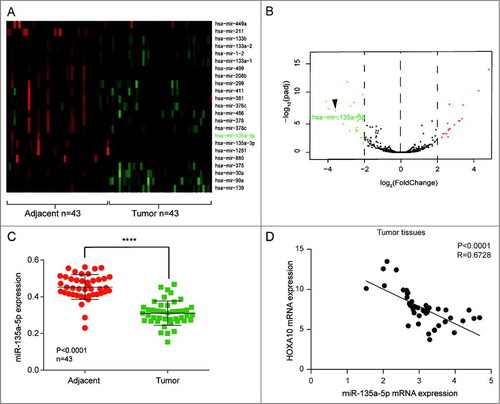
To find the possible microRNA which might regulate HOXA10 expression, we analyzed the same 43 samples and 23 miRNAs in tumor tissues were apparently under-expressed (A). Differentially expressed microRNAs with | Log2(fold change) |>2 and P<0.01 were shown in the volcano plot. Symbols and expressions of representative miRNAs in each sample were presented in the heat map. By TargetScan (www.targetscan.org), only miR-135a-5p could target at HOXA10 and it was low expressed in the tumor samples than in the normal samples (log2 (Fold Change)<-2, B). We also verified that miR-135a-5p mRNA expression was significantly lower in tumor tissues than in adjacent normal tissues (P<0.0001, n = 43, C). Moreover, we found that expression of miR-135a-5p and HOXA10 was significant negative correlated in NHSCC tissues (R = 0.6728, P<0.0001, D.
Figure 2. miR-135a-5p was under-expressed in HNSCC. (A) miR-135a-5p, which could target at HOXA10, was low expressed. (B) 23 miRNAs in tumor tissues were apparently low expressed. (C) miR-135a-5p was low expressed in tumor tissues than normal tissues (****P<0.0001, n = 43, compared with tumor adjacent group). (D) The expression of miR-135a-5p and HOXA10 was negatively correlated in HNSCC tissues (P<0.0001, R = 0.6728, n = 43).
miR-135a-5p directly targeted HOXA10 mRNA
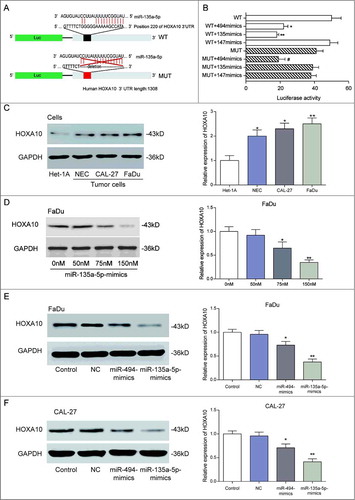
By TartgetScan and miRanda analysis, we found that miR-135a-5p directly targeted HOXA10 and located the target site as the 220 nt of 3’UTR on HOXA10 (A). To prove that miR-135a-5p targeted HOXA10 mRNA, we cloned the 3′UTR of HOXA10 (WT) mRNA in the 3′UTR of a pcDNA3.1-GFP plasmid. Meanwhile, we established the mutation sequence (MUT) of HOXA10 3′UTR by deleting the targeting area of miR-135a-5p (P<0.05, A). Luciferase reporter gene assay results indicated that miR-135a-5p could directly target at HOXA10 3′UTR and inhibit its expression. Furthermore, the inhibition effect of miR-135a-5p was better than that of miR-494 (P<0.05, B). However, as a negative control, rno-miR-147 couldn't target at HOXA10 3′UTR. HOXA10 expression in tumor cell lines (NEC, CAL-27 and FaDu) was higher than that in normal cell line (Het-1A), whereas the HOXA10 expression in the three tumor cell lines was similar (P<0.05, C). According to our detection to FaDu cells at different densities of miR-135a-5p, high levels of miR-135a-5p always corresponded with low HOXA10 expression, particularly at a density of 150 nM of miR-135a-5p (P<0.05, D). After miR-135a-5p mimics and miR-494 mimics transfection at 150 nM, HOXA10 expression in miR-135a-5p mimics group was significantly lowered (P<0.05, E-F). Therefore, we confirmed that miR-135a-5p could inhibit HOXA10 expression more effectively than miR-494.
Figure 3. MiR-135a-5p directly targeted at HOXA10 3’UTR. (A) TartgetScan and miRanda analysis: miR-135a-5p directly target at HOXA10, and the target site was the 220 nt of 3’UTR on HOXA10. The schematic diagram of the experimental vector was provided for the fluorescence reporting assay. (B) The effect of miR135a-5p to repress HOXA10 expression was better than that of miR-494, which is found to target HOXA10 in oral cancer (**P<0.01,*P<0.05, compared with the 3’UTR of HOXA10 (WT) group, #P<0.05, compared with the 3’UTR of HOXA10 (MUT) group). (C) HOXA10 expression quantity in tumor cell lines (NEC, CAL-27 and FaDu) was higher than that in normal cell line (Het-1A), whereas the HOXA10 expression quantity in the three tumor cell lines was similar (**P<0.01,*P<0.05, compared with the Het-1A cell). (D) High levels of miR-135a-5p always corresponded with low HOXA10 expression. Particularly, among all the transfection concentrations, 150 nM miR-135a-5p-mimics let to the most significant level of inhibitory effect on HOXA10 expression (**P<0.01,*P<0.05, compared with the 0nM group). (E-F) MiR-135a-5p could inhibit HOXA10 expression more effectively than miR-494 (**P<0.01,*P<0.05, compared with the control).
HOXA10 facilitated proliferation but reduced apoptosis of Fadu cells
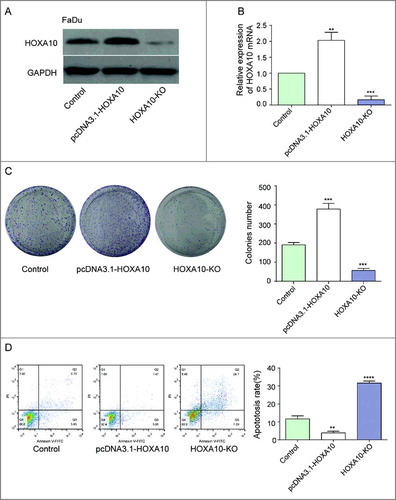
We screened stable high expression HOXA10 and non-expression HOXA10 transfected cell strains by transfection plasmid overexpression system and CRISP/CAS9 gene knockout system. Results of WB and qPCR displayed high HOXA10 expression in pcDNA3.1-HOXA10 and low HOXA10 expression in HOXA10-KO group (A-B). Tumor cells in HOXA10-KO group was less than those in control group (student t-test, P<0.001), whereas tumor cells in pcDNA3.1-HOXA10 group was more than those in control group (P<0.001), which manifested that HOXA10 could facilitate the proliferation of tumor cells (C). The number of apoptotic cells in HOXA10-KO was more significant than that in pcDNA3.1-HOXA10 group. The fact illustrated the inhibitory effects of HOXA10 to the apoptosis of tumor cells (D).
Figure 4. Effects of HOXA10 on the proliferation and apoptosis of cells. (A-B) We screened stable high expression HOXA10 and non-expression HOXA10 transfected cell strains by transfection plasmid overexpression system and CRISP/CAS9 gene knockout system (***P<0.001, **P<0.01, compared with control group). (C) The quantity of tumor cells of HOXA10-KO group was lower than that of control group by colony formation assay (student t-test, ***P<0.001, compared with control group), whereas the number of tumor cells of pcDNA3.1-HOXA10 group was higher than that of control group (***P<0.001, compared with control group), which manifested that HOXA10 could facilitate the proliferation of tumor cells. (D) The number of apoptotic cells in HOXA10-KO was highly increased while that of the overexpression group was decreased by cell apoptosis assay. The fact illustrated the inhibitory action of HOXA10 to the apoptosis of tumor cells (****P<0.0001, **P<0.01, compared with control group).
miR-135a-5p suppressed tumor cell growth and facilitated apoptosis by targeting HOXA10 in vitro
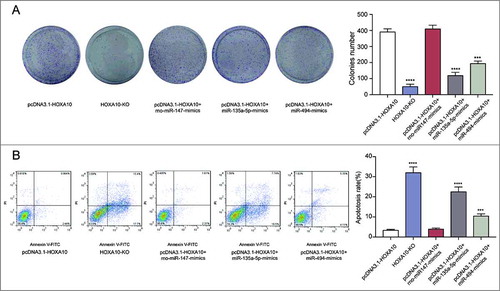
We chose pcDNA3.1-HOXA10 group as positive control group, HOXA10-KO group as negative control group, pcDNA3.1-HOXA10+rno-miR-147 group, pcDNA3.1-HOXA10+miR135a-5p group and pcDNA3.1-HOXA10+miR-494 group as experimental groups. As revealed by colony formation assay, the number of cells in HOXA10-KO is lower and miR-135a-5p as well as miR-494 could repress the growth of tumor cells, but miR-135a-5p showed better effectiveness (P<0.001, A). Flow cytometry result implied that both miRNAs had inhibiting effect on the apoptosis of tumor cells, but miR-135a-5p was more effective (P<0.001, B).
Figure 5. Inhibitory effects of miR-135a-5p on tumor cells by targeting HOXA10 in vitro. (A) Colony forming assay showed the capability of miR-135a-5p and miR-494 to repress the growth of tumor cells, and that the former one was better than the latter. Meanwhile, the number of cells in HOXA10-KO is lower (****P<0.0001, ***P<0.001, compared with pcDNA3.1-HOXA10 group). (B) Flow cytometry result implied that both miRNAs had inhibitory effect on the apoptosis of tumor cells, and miR-135a-5p was better (****P<0.0001, ***P<0.001, compared with pcDNA3.1-HOXA10 group).
miR-135a-5p inhibited tumor cell growth and facilitated apoptosis by targeting HOXA10 in vivo
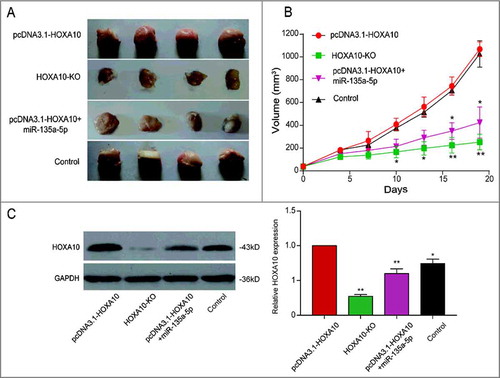
We designed tumor bearing experiment in order to identify the inhibiting effect of miR-135a-5p through mice. The statistics demonstrated the tumor volume of HOXA10 overexpression group was larger, and that of HOXA10-KO group was smaller. Tumor growth of pcDNA3.1-HOXA10+miR-135a-5p group was impaired relatively (A). The impairment has statistical significance (P<0.05, B). Intimate correlation between HOXA10 expression and tumor volume was confirmed by the results of WB (P<0.05, C). Larger tumors always corresponded with higher level of HOXA10 expression. Therefore, miR-135a-5p could restrain the growth of tumor and the expression of HOXA10.
Figure 6. Inhibitory effects of miR-135a-5p on tumor cells by targeting HOXA10 in vivo. (A-B) The tumor volume of HOXA10 overexpression group was the largest, that of HOXA10-KO group was the smallest. Tumor growth of pcDNA3.1-HOXA10+miR-135a-5p group was impaired relatively (**P<0.01, *P<0.05, compared with pcDNA3.1-HOXA10 group). (C) Larger tumors always corresponded with higher level of HOXA10 expression. The HOXA10 expression in pcDNA3.1-HOXA10+miR-135a-5p group was lower compared with pcDNA3.1-HOXA10 group which was evaluated by WB. MiR-135a-5p could restrain the growth of tumor and the expression of HOXA10 (**P<0.01, *P<0.05, compared with pcDNA3.1-HOXA10 group).
Discussion
In the present study, we found that HOXA10 in HNSCC cells was overexpressed, whereas miR-135a-5p expression was lower in HNSCC cells than in normal cells. We explored the relationship between HOXA10 and miR-135a-5p and revealed that miR-135a-5p could inhibit the growth and proliferation both in vivo and in vitro by targeting HOXA10.
MiR-135a-5p has been reported to be aberrantly over-expressed and therefore could be a valuable prognostic biomarker in various human diseases such as Parkinson's disease, colorectal cancer and primary nasopharyngeal carcinoma.Citation15–17 Intriguingly, miR-135a-5p has never been investigated in HNSCC. We speculate that miR-135a-5p could be either a tumor facilitator or a tumor suppressor but we found that miR-135a-5p expression was lower in HNSCC cells than in normal cells, indicating its tumor suppressor role in HNSCC. The underlying mechanism was usually correlated with lncRNA which could sponge miRNAs expressions.Citation18 However, the present mechanism was reported as the targeting relationship with HOX10.
We found that HOXA10 in HNSCC cells was overexpressed. Considering its target relationship with miR-135a-5p, we speculate that HOXA10 could be a potential HNSCC facilitator. Previous studies have been conducted to investigate the overexpression of HOXA10 as well. For instance, HOXA10 expression is upregulated in nasopharyngeal carcinoma tissues compared to the normal tissues.Citation19 Also, high expression level of HOXA10 is found in sacral chordomas, oral carcinoma and oral squamous cell carcinoma.Citation8,Citation14,Citation20,Citation21 In this study, the knockdown of HOXA10 inhibited the proliferation and improved cell death. The downstream targets of HOXA10, including p21 and p53,Citation22,Citation23 played important roles in tumorigenesis and development via further influencing multiple pathways and regulating a large subset of genes, such as Bcl-2 and caspase-3,Citation24,Citation25 which directly impacted on cell apoptosis. Cui et. al reported that aberrantly up-regulated HOXA10 in pancreatic cancer cells activated the p38 MAPK pathway, increased the TGFβ2 and Matrix metallopeptidase-3 (MMP3) expression, and facilitated the cell migration and invasion.Citation26 These findings supported our hypothesis that elevated HOXA10 expression promoted the proliferation and suppressed the apoptosis of HNSCC cells. The underlying molecular mechanisms concerning the role of HOXA10 in HNSCC could be further confirmed in the future.
The correlation between miR-135a and HOXA10 in HNSCC is a pioneering work in this research. HOXA10 was dysregulated in acute myeloid leukemia patients and correlated with poor prognosis.Citation27 It was also highly expressed in hematopoietic disease by regulating WNT and TNF signaling pathway balance which could be targeted with miRNAs [PMID: 24736844]. MiR-135a overexpression and HOXA10 inhibition consistently resulted in cell apoptosis and also suppressed cell growth and adhesion.Citation24 MiR-135a promoted breast cancer cell migration and invasion by targeting HOXA10.Citation28 In our study, HOXA10 can be targeted by miR-135 in HNSCC, therefore suppressing HNSCC cell growth. Our in vitro and in vivo experiments also supported this argument. MiR-135a and HOX10 could act as prognosis biomarkers in gastric cancer respectively.Citation6,Citation29 HOXA10 could also been applied to the therapeutic target treatment in breast cancer.Citation30 Onco miR-135a was correlated with Taxanes resistance in the therapeutic application.Citation31 Therefore, more clinical trial could be employed.
Yet, limitations exist in the study that the size of the study cohort need to be enlarged in future studies. Due to the limited funding, there was no negative control group in the tumor formation experiments. The results would be more credible if the limitations can be made up. Moreover, sophisticated pathways are involved in carcinogenesis and cancer inhibition, thus the lack of signaling study in the study calls for further investigation.
In summary, our study confirmed that miR-135a-5p could repress the growth and proliferation of HNSCC cells by targeting HOXA10. With more understanding of its functions, miR-135a-5p/HOXA10 may be used as a potential prognostic biomarker and therapeutic target for HNSCC treatment, but a lot of researches should be performed to probe the overall functions of HOXA10 and miR-135a-5p in HNSCC in future.
Materials and methods
Tissue specimens
Human HNSCC tissue samples and the corresponding adjacent tissues were collected from 43 HNSCC patients (25 males and 18 females, age from 43 to 77) who underwent surgical resection at Affiliated Cancer Hospital of Zhengzhou University/Henan Cancer Hospital from March 2015 to December 2016. No participants received chemoradiotherapy before surgery. All tissue specimens were snap-frozen in liquid nitrogen and stored in a refrigerator at -80°C for the following experiment. The research had been ratified by the Ethical Committees of Affiliated Cancer Hospital of Zhengzhou University/Henan Cancer Hospital. Informal written consents were obtained from each participant. The clinical characteristics of the 43 patients can be found in .
Table 1. The clinical characteristics of the study population.
Cell line and cell culture
Human HNSCC cell lines CAL-27, NEC, Het-1A, FaDu and human embryonic kidney cell HEK293 were all purchased from BeNa Culture Collection (Beijing, China). The cell lines were authenticated by short tandem repeat (STR) analysis, and confirmed to be free from mycoplasma contamination. All cells were cultured in Dulbecco's modified Eagle medium (DMEM) (Invitrogen, Gaithersburg, MD, USA) containing 10% fetal bovine serum (FBS) (GIBCO, Carlsbad, CA, USA). The cells were maintained at 37°C in a humidified atmosphere of 5% CO2 in air.
Plasmid constructions and transfection
The CDS regions of HOXA10 were extracted and cloned to pcDNA3.1 plasmids (Invitrogen, Gaithersburg, MD, USA). The established plasmids were pcDNA3.1-HOXA10 plasmids. The knockout cells were structured by CRISPR/Cas9 gene knockout system. pYSY-CMV-Cas9-U6-EFla-puromycin-EFla-eGFP (as a vector) and 5’-GGAATGTCATGCTCGGAGAGCGG-3’ (as a gRNA) were synthesized by Nanjing YSY Biotech Company Ltd. (Ningjing, China). After sequencing identification, pcDNA3.1-HOXA10 plasmid and HOXA10-KO plasmid were transfected into FaDu cells using Lipofectamine 2000 Reagent (Invitrogen, Gaithersburg, MD, USA). 24 h after transfection, the efficiency of cell transfection was detected. The experiment was divided into following groups: control group (non-transfection), NC group (transfected with rno-miR-147-mimics), miR-494-mimics group (transfected with hsa-miR-494-mimics), miR-135a-5p-mimics group (transfected with hsa-miR-135a-5p-mimics), pcDNA3.1-HOXA10 group (transfected with pcDNA3.1-HOXA10 plasmid), HOXA10-KO group (transfected with HOXA10-KO plasmid), pcDNA3.1-HOXA10+rno-miR-147-mimics group (co-transfected with pcDNA3.1-HOXA10 plasmid and rno-miR-147-mimics), pcDNA3.1-HOXA10+miR-135a-5p-mimics group (co-transfected with pcDNA3.1-HOXA10 plasmid and hsa-miR-135a-5p-mimics), and pcDNA3.1-HOXA10+miR-494-mimics group (co-transfected with pcDNA3.1-HOXA10 plasmid and hsa-miR-494-mimics).
Quantitative real-time polymerase chain reaction (qRT-PCR)
Total RNA was isolated from frozen HNSCC cells and adjacent tissues using Trizol reagent (Invitrogen, Gaithersburg, MD, USA) according to the manufacturer's instructions. The quality, quantity and integrity of RNA were measured by NanoDrop1000 spectrophotometer and Bioanalyzer 2100 (Agilent Technologies, CA, USA). MirVana miRNA Isolation Kit (Life Technology, Grand Island, NY, USA) was used for the process miRNA isolation. The TaqMan MicroRNA Reverse Transcription Kit (ThermoFisher Scientific, San Jose, CA, USA) was applied to the reverse transcription of miRNA. The TaqMan high-capacity cDNA Kit (Thermo Fisher Scientific, San Jose, CA, USA) was used for the reverse transcription of mRNA. U6 was used as an endogenous control relative to miRNA, while GAPDH acted as an internal control relative to HOXA10. Gene expression was examined by means of StepOnePlus real-time PCR instrument (Applied Biosystems). The thermal cycling condition was as follows: 94°C for 3 min, followed by 45 cycles of 94 °C for 5s and 60 °C for 30 s. Statistical analysis was performed by the method of 2−ΔΔCt. Primers were designed and synthesized by Sangon Biotech (Shanghai, China). Primer sequences used in qRT-PCR are listed in .
Table 2. The primers for conduction of qRT-PCR.
Immunocytochemistry (IHC)
After deparaffinization and rehydration, the slides were treated with hydrogen peroxide–methanol (1 ml 30% H2O2 mixed with 100 ml methanol) for 5∼30 min at room temperature, after which the sections were fully washed with water and then washed two times with phosphate buffered saline (PBS), each time for 5 min. The reaction was performed in natural serum diluted by 20 times at room temperature. Afterwards, the slides were washed twice with PBS, each time for 5 min. After binding with rabbit anti-HOXA10 (#BA0918-1, BOSTER, CA, USA) for 1 h at room temperature, the slides were washed twice with PBS, each time for 5 min. The slides bound with horseradish peroxidase goat anti-rabbit (#ab97095, Abcam, Cambridge, GBR) for 30 min at 37℃ and then were washed twice with PBS, each time for 5 min. Streptavidin-peroxidase (70~100 μg/ml, dissolved in PBS) was used for reaction for 30 min at room temperature. Color reaction was carried out in DAB-H2O2. Finally, the slides were lightly counterstained with hematoxylin, dehydrated with ethanol, cleaned with xylene, and mounted.
Green fluorescence protein (GFP) reporter assay
HOXA10 3’UTR (NM_018951, 1218 bp) were obtained from the HOXA10 3’UTR (synthesized by Sangon Biotech Company, Shanghai, China) based on the cDNA of the FaDu cell line, and then cloned into the pcDNA3.1-GFP plasmids (Invitrogen, Gaithersburg, MD, USA) at the restriction enzyme cutting sites EcoR I and Xhol I. Mutated HOXA10 3’UTR sequences (HOXA10 3’UTR-MUT, 1136 bp) were established. HOXA10 3’UTR-WT or HOXA10 3’UTR-MUT were transfected into HEK293 cells using Lip2000 (Invitrogen, Gaithersburg, MD, USA). HEK293 cells with stable expression of HOXA10 3’UTR-WT or HOXA10 3’UTR-MUT were screened out. The selected cells were planted on 24-well plates at a density of 5 × 10⁵/well. 100 nM miR-494-mimics or miR-135a-5p-mimics or miR-147-mimics (GenePharma, Shanghai, China) were transfected into the cultured cells mentioned earlier for 48 h. Flow cytometry method was used to determine GFP activities in cells.
Western blot
Cells were dissociated in radio-immunoprecipitation assay (RIPA; Sigma-Aldrich, Shanghai, China) buffer containing 1% phenylmethylsulfonyl fluoride (PMSF) on ice for 1 h. The proteins were separated in 10% sodium dodecyl sulfate–polyacrylamide gel electrophoresis (SDS-PAGE) and then transferred onto a polyvinylidene fluoride (PVDF) membranes (GE Healthcare, Shanghai, China) following the manufacturer's instructions. After 2 h, PVDF membranes were replaced with nitrocellulose membranes and the membranes were sealed with 5% nonfat milk for 2 h at room temperature. The membranes were subsequently incubated with rabbit anti-HOXA10 (#ab23392, 0.5 µg/ml, Abcam, GBR) at room temperature. The membranes were then washed three times with tris buffer saline containing 20% Tween (TBST), followed by incubation with goat anti-rabbit secondary antibody IgG H&L (HRP) (1:5000). After that, the membranes were washed again with TBST for 10 min and then kept at room temperature for 30 min. The proteins were examined by enhanced chemiluminescence (ECL) detection system (Thermo Scientific, Rockford, IL, USA). GAPDH was used as an internal control relative to HOXA10.
Colony formation assay
1000 FaDu cells were seeded on 60 ml petri dishes and cultured for 24 h. Non-adhesive cells were washed away, while the resulting cells were incubated for another week under the condition of 37℃, 5%CO2. The colonies were fixed with 4% methanol and stained with 0.1% crystal violet. Colonies were counted under an optical microscope at × 20 magnification.
Cell apoptosis assay
The cells were digested with 0.25% trypsin and collected after centrifugation for 5 min. The cells were subsequently washed with PBS and resuspended in 500 μl binding buffer. After that, 5 μl Annexin V-FITC and propidium iodide (PI) solutions were added to the cells, which then were incubated for 10 min at room temperature. The apoptosis was analyzed by coulter FC500 flow cytometry (Beckman Coulter, Miami, FL, USA). The assay was performed in triplicate.
Tumor xenograft
6∼8-week-old male BALA/c mice (Affiliated Cancer Hospital of Zhengzhou University/Henan Cancer Hospital) were cultured in the standard laboratory animal culture environment. All the animal experiments were approved by Affiliated Cancer Hospital of Zhengzhou University/Henan Cancer Hospital. 200 μl cell suspension at a density of 1 × 10⁷ cells / ml was injected to the left armpit of each mice. 16 mice were randomly divided into four groups, four mice each group. The mice in four groups were inoculated with HOXA10-KO FaDu cells, pcDNA3.1-HOXA10 FaDu cells, pcDNA3.1-HOXA10 FaDu cells transfected with miR-135a-5p at a density of 150 nM, and normal FaDu cells (no treatment). After inoculation, the volume of the tumors was measured at different time point (0 d, 4 d, 7 d, 10 d, 13 d, 16 d, 19 d) through the vernier caliper method (v = π/6 × minor axis2 × major axis). At 25 d, all the mice were sacrificed, and the tumors were taken out of the mice. After that, one group was randomly selected to conduct immunohistochemistry assay. Another group was randomly chosen for western blot.
Microarray analysis
In present study, microarray analysis was performed on 43 paired normal and tumor tissues. Total RNA was extracted with TRI (Molecular Research Center Inc., OH) from frozen tissues and quantified with NanoDrop1000 spectrophotometer and scored by Bioanalyzer 2100(Agilent Technologies, CA). RNAs with a RIN>7 were selected out for sequencing with Illumina HiSeq 2000 (San Diego, CA, USA) and SciencePark. Reverse transcription/amplifications/hybridizations were performed in each sample products as previously described in Zhao et.al report.Citation32 In total, 2500 miRNAs and 4,5000 mRNAs were screened out and analyzed with R package as shown in hierarchical clustering. The data of HNSC patients for OS and DFS analysis obtained from TCGA and R software (Version 3.4.1) was used for the differential analysis.
Statistical analysis
GraphPad Prism 6.0 software (GraphPad, San Diego, CA, USA) was used to perform statistical analysis. Kaplan-Meier analysis and cox hazard regression model were used as survival tools to estimate clinical outcomes. HNSCC clinical data were obtained from TCGA database (https://cancergenome.nih.gov/). Log2 (Foldchange) was set at >4 or <-4 with P<0.0001, and 20 aberrantly expressed genes were screened out. All the data were expressed as mean±standard deviation (SD). Differences were analyzed by two-tailed Student's t-test or Log-rank test. P<0.05 was considered statistically significant.
| Abbreviations | ||
| (HNSCC) | = | head and neck squamous cell carcinoma |
| (3′-UTRs) | = | 3′ untranslated regions |
| (STR) | = | short tandem repeat |
| (DMEM) | = | Dulbecco's modified Eagle medium |
| (FBS) | = | fetal bovine serum |
| (IHC) | = | Immunocytochemistry |
| (GFP) | = | Green fluorescence protein |
| (PI) | = | propidium iodide |
| (SD) | = | standard deviation |
Author Contributions
Research conception and design: Lei-ming Guo, Gao-feng Ding. Data analysis and interpretation: Wencai Xu, Yu-fei Lu. Statistical analysis: Hong Ge, Yue Jiang. Drafting of the manuscript: Lei-ming Guo, Yu-fei Lu, Xi-juan Chen. Critical revision of the manuscript: Yu-fei Lu, Xi-juan Chen. Approval of final manuscript: all authors.
supp_mat1450112_KCBT.zip
Download Zip (7.6 MB)Additional information
Funding
References
- Castilho RM, Squarize CH, Almeida LO. Epigenetic modifications and head and neck cancer: Implications for tumor progression and resistance to therapy. Int J Mol Sci. 2017;18(7):1506.
- Jemal A, Siegel R, Ward E, Hao Y, Xu J, Thun MJ. Cancer statistics, 2009. CA Cancer J Clin. 2009;59(4):225–49.
- Kotowski U, Heiduschka G, Kadletz L, Fahim T, Seemann R, Schmid R, Schneider S, Mitterbauer A, Thurnher D. Effect of thymoquinone on head and neck squamous cell carcinoma cells in vitro: Synergism with radiation. Oncol Lett. 2017;14(1):1147–51.
- Thierauf J, Veit JA, Hess J. Epithelial-to-Mesenchymal transition in the pathogenesis and therapy of head and neck cancer. Cancers (Basel) 2017;9(7).
- Carleton M, Cleary MA, Linsley PS. MicroRNAs and cell cycle regulation. Cell Cycle 2007;6(17):2127–32.
- Lim JY, Yoon SO, Seol SY, Hong SW, Kim JW, Choi SH, Lee JS, Cho JY. Overexpression of miR-196b and HOXA10 characterize a poor-prognosis gastric cancer subtype. World J Gastroenterol 2013;19(41):7078–88.
- Van Renne N, Roca Suarez AA, Duong FH, Gondeau C, Calabrese D, Fontaine N, Ababsa A, Bandiera S, Croonenborghs T, Pochet N, et al. miR-135a-5p-mediated downregulation of protein tyrosine phosphatase receptor delta is a candidate driver of HCV-associated hepatocarcinogenesis. Gut. 2017.
- Carrera M, Bitu CC, de Oliveira CE, Cervigne NK, Graner E, Manninen A, Salo T, Coletta RD. HOXA10 controls proliferation, migration and invasion in oral squamous cell carcinoma. Int J Clin Exp Pathol. 2015;8(4):3613–23.
- Novakovic B, Fournier T, Harris LK, James J, Roberts CT, Yong HEJ, Kalionis B, Evain-Brion D, Ebeling PR, Wallace EM, et al. Increased methylation and decreased expression of homeobox genes TLX1, HOXA10 and DLX5 in human placenta are associated with trophoblast differentiation. Sci Rep. 2017;7(1):4523.
- Thorsteinsdottir U, Sauvageau G, Hough MR, Dragowska W, Lansdorp PM, Lawrence HJ, Largman C, Humphries RK. Overexpression of HOXA10 in murine hematopoietic cells perturbs both myeloid and lymphoid differentiation and leads to acute myeloid leukemia. Mol Cell Biol. 1997;17(1):495–505.
- Darda L, Hakami F, Morgan R, Murdoch C, Lambert DW, Hunter KD. The role of HOXB9 and miR-196a in head and neck squamous cell carcinoma. PLoS One 2015;10(4):e0122285.
- Huang J, Meng Y, Liu Y, Chen Y, Yang H, Chen D, Shi J, Guo Y. MicroRNA-320a regulates the osteogenic differentiation of human bone marrow-derived mesenchymal stem cells by targeting HOXA10. Cell Physiol Biochem. 2016;38(1):40–8.
- Xiao ZD, Jiao CY, Huang HT, He LJ, Zhao JJ, Lu ZY, Liu LX. miR-218 modulate hepatocellular carcinoma cell proliferation through PTEN/AKT/PI3K pathway and HoxA10. Int J Clin Exp Pathol. 2014;7(7):4039–44.
- Liborio-Kimura TN, Jung HM, Chan EK. miR-494 represses HOXA10 expression and inhibits cell proliferation in oral cancer. Oral Oncol. 2015;51(2):151–7.
- Liu Y, Liao S, Quan H, Lin Y, Li J, Yang Q. Involvement of microRNA-135a-5p in the protective effects of hydrogen sulfide against parkinson's disease. Cell Physiol Biochem. 2016;40(1-2):18–26.
- Cheng Z, Li Z, Ma K, Li X, Tian N, Duan J, Xiao X, Wang Y. Long Non-coding RNA XIST promotes glioma tumorigenicity and angiogenesis by acting as a molecular sponge of miR-429. J Cancer 2017;8(19):4106–16.
- Tang JF, Yu ZH, Liu T, Lin ZY, Wang YH, Yang LW, He HJ, Cao J, Huang HL, Liu G. Five miRNAs as novel diagnostic biomarker candidates for primary nasopharyngeal carcinoma. Asian Pac J Cancer Prev. 2014;15(18):7575–81.
- Chen H, Xin Y, Zhou L, Huang JM, Tao L, Cheng L, Tian J. Cisplatin and paclitaxel target significant long noncoding RNAs in laryngeal squamous cell carcinoma. Med Oncol. 2014;31(11):246.
- Shen ZH, Zhao KM, Du T. HOXA10 promotes nasopharyngeal carcinoma cell proliferation and invasion via inducing the expression of ZIC2. Eur Rev Med Pharmacol Sci. 2017;21(5):945–52.
- Jager D, Barth TFE, Bruderlein S, Scheuerle A, Rinner B, von Witzleben A, Lechel A, Meyer P, Mayer-Steinacker R, Baer AV, et al. HOXA7, HOXA9, and HOXA10 are differentially expressed in clival and sacral chordomas. Sci Rep. 2017;7(1):2032.
- Yamatoji M, Kasamatsu A, Yamano Y, Sakuma K, Ogoshi K, Iyoda M, Shinozuka K, Ogawara K, Takiguchi Y, Shiiba M, et al. State of homeobox A10 expression as a putative prognostic marker for oral squamous cell carcinoma. Oncol Rep. 2010;23(1):61–7.
- Bromleigh VC, Freedman LP. p21 is a transcriptional target of HOXA10 in differentiating myelomonocytic cells. Genes Dev 2000;14(20):2581–6.
- Chu MC, Selam FB, Taylor HS. HOXA10 regulates p53 expression and matrigel invasion in human breast cancer cells. Cancer Biol Ther. 2004;3(6):568–72.
- Tang W, Jiang Y, Mu X, Xu L, Cheng W, Wang X. MiR-135a functions as a tumor suppressor in epithelial ovarian cancer and regulates HOXA10 expression. Cell Signal 2014;26(7):1420–6.
- Miyashita T, Krajewski S, Krajewska M, Wang HG, Lin HK, Liebermann DA, Hoffman B, Reed JC. Tumor suppressor p53 is a regulator of bcl-2 and bax gene expression in vitro and in vivo. Oncogene 1994;9(6):1799–805.
- Cui XP, Qin CK, Zhang ZH, Su ZX, Liu X, Wang SK, Tian XS. HOXA10 promotes cell invasion and MMP-3 expression via TGFbeta2-mediated activation of the p38 MAPK pathway in pancreatic cancer cells. Dig Dis Sci. 2014;59(7):1442–51.
- Bhise NS, Chauhan L, Shin M, Cao X, Pounds S, Lamba V, Lamba JK. MicroRNA-mRNA pairs associated with outcome in AML: From In vitro cell-based studies to AML patients. Front Pharmacol 2015;6:324.
- Chen Y, Zhang J, Wang H, Zhao J, Xu C, Du Y, Luo X, Zheng F, Liu R, Zhang H, et al. miRNA-135a promotes breast cancer cell migration and invasion by targeting HOXA10. BMC Cancer 2012;12:111.
- Ueda T, Volinia S, Okumura H, Shimizu M, Taccioli C, Rossi S, Alder H, Liu CG, Oue N, Yasui W, et al. Relation between microRNA expression and progression and prognosis of gastric cancer: A microRNA expression analysis. Lancet Oncol 2010;11(2):136–46.
- Lehmann BD, Bauer JA, Chen X, Sanders ME, Chakravarthy AB, Shyr Y, Pietenpol JA. Identification of human triple-negative breast cancer subtypes and preclinical models for selection of targeted therapies. J Clin Invest. 2011;121(7):2750–67.
- Kasinski AL, Slack FJ. Epigenetics and genetics. MicroRNAs en route to the clinic: progress in validating and targeting microRNAs for cancer therapy. Nat Rev Cancer 2011;11(12):849–64.
- Zhao F, Qu Y, Zhu J, Zhang L, Huang L, Liu H, Li S, Mu D. miR-30d-5p Plays an important role in autophagy and apoptosis in developing rat brains after hypoxic-ischemic injury. J Neuropathol Exp Neurol. 2017;76(8):709–19.