
ABSTRACT
Aberrant methylation of tumour suppressor genes is associated with the progression to a blast crisis in chronic myeloid leukaemia (CML). Methyl-CpG-binding domain protein 2 (MBD2) has been studied as a “reader” of DNA methylation in many cancers, but its role in CML is unclear. We constructed cell models of a homozygous deletion mutation of MBD2 using gene-editing technology in K562 cells and BV173 cells. Here, we demonstrated that the deletion of MBD2 inhibited cell proliferation capacity in vitro. MBD2 deletion also significantly inhibited K562 cell proliferation in a xenograft tumour model in vivo. Additionally, the JAK2/STAT3 signalling pathway, which is abnormally active in CML, was inhibited by MBD2 deletion, and MBD2 deletion could up-regulate the expression of SHP1. In conclusion, our findings suggest that MBD2 is a candidate therapeutic strategy for the CML blast phase.
Introduction
Chronic myeloid leukaemia (CML) is characterized by a reciprocal translocation between chromosome 9 and 22, named the Philadelphia (Ph) chromosome, which gives rise to the oncogenic BCR-ABL fusion gene.Citation1 The natural course of CML includes three different clinical pathological phases: chronic phase (CP), accelerated phase (AP) and blast phase (BP). The blast phase is the final phase in the evolution of CML and is characterized by rapid progression and short survival.Citation2,Citation3 Recently, some studies have revealed that DNA methylation in CML patients clearly increases during disease progression. Moreover, a large number of genes, including some tumour suppressor genes, which are transcriptionally regulated by methylation, were identified in the blast phase.Citation4,Citation5
Because of targeted therapy with tyrosine kinase inhibitors (TKIs), which targeted the BCR-ABL fusion gene, the median survival of CML patients was significantly extended.Citation1 However, while TKI therapy had good clinical outcomes in CML chronic phase (CML-CP) patients, it has shown dismal responses in the treatment of CML blast phase (CML-BP) patients.Citation2,Citation3,Citation6 It is obvious that CML-BP patients need effective approaches for treatment. In a CML mouse model, it was verified that a demethylation drug with TKI can restore myeloid differentiation, decreasing the malignancy of leukaemia cells, and the combination treatments are more effective than a TKI single-drug treatment.Citation7 However, the clinical utility of DNA methylation inhibitors has been limited somewhat by opposing effects associated with nonspecific demethylation, and new approaches for targeted therapy are important.
Regulating the level of DNA methylation has become a research hot spot in the field of cancer therapy, because previous studies have revealed that selective DNA hypermethylation of specific gene promoters are associated with cancer development and progression.Citation4,Citation5,Citation8 DNA methylation, a type of epigenetic modification, causes a reversible change in gene expression by the function of methyl-CpG binding (MBD) proteins.Citation9 The MBD protein family has five members, including MBD1, MBD2, MBD3, MBD4, and MeCP2. Mice deficient in MBD2 have no differences in survival and normal development except for a minor phenotype in maternal behaviour, whereas mice deficient in other members show embryonic lethality or apparent changes in development.Citation10–Citation13 Furthermore, Cook PC and his co-workers have demonstrated that a difference in dendritic cell function and T cell differentiation in MBD2 deficient mouse model, and revealed MBD2 as possible therapeutic targets for type2 inflammation.Citation14 By binding to methylated DNA, MBD2 inhibited transcription of the methylated target genes. In addition, the absence of MBD2 can restore expression of the hypermethylated genes but does not cause genome nonspecific demethylation.Citation15 Some studies have demonstrated that the absence of MBD2 suppresses the growth of human lung, colorectal and breast cancer cells in vitro and xenograft models in vivo.Citation16–Citation18 Our previous study defined essential roles for MBD2 in lymphopoiesis and T-cell acute lymphoblastic leukaemia (T-ALL) and suggested MBD2 as a candidate therapeutic target in T-ALL.Citation19 The expression of MBD2 was high in CML-BP patients.Citation20 Therefore, we can speculate that MBD2 may be a selective target for CML therapy.
In this study, we investigated the effect of MBD2 deletion on the CML blast phase. We detected the expression of MBD2 in CML blast crisis cell lines and patients. The gene editing technology CRISPR/Cas9 system was used for disruption of MBD2 expression in K562 and BV173 cells. We detected the association between MBD2 deletion and the proliferation of K562 and BV173 cells in vitro, and found that MBD2 deletion significantly inhibited K562 cell proliferation in a xenograft model in vivo. Furthermore, we found that the effects of MBD2 deletion on CML cell proliferation were attained through re-expression of SHP1 and inhibition of the JAK2/STAT3 signalling pathway. We demonstrated that MBD2 might be a therapeutic target for the CML blast phase.
Results
MBD2 was overexpressed in CML blast crisis patients
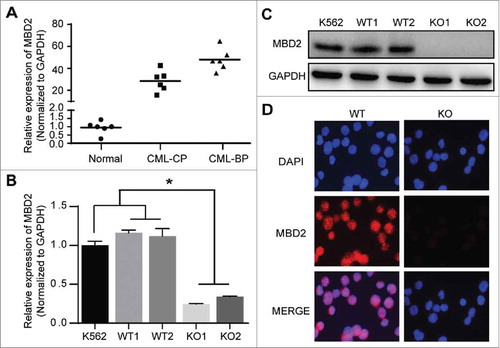
We detected the mRNA level of MBD2 in bone marrow mononuclear cells from 6 blast crisis patients, 6 chronic phase patients and 6 healthy controls. MBD2 expression was higher in CML patients than in healthy controls, especially in blast phase CML patients (), which was consistent with previous studies.Citation20 Therefore, we assumed that MBD2 might be a potential target for therapy of CML-BP patients.
Figure 1. MBD2 was Overexpressed in CML-BP Patients, and MBD2 Expression was Deleted by CRISPR/Cas9-mediated Gene Disruption in K562 Cells. (A) Normal BM samples were collected from healthy volunteer donors as healthy controls. The mRNA levels of MBD2 were detected in CML-CP, CML-BP patients and healthy controls via qRT-PCR. (B, C) The cell model of homozygous deletion mutation of MBD2 was constructed by using the CRISPR/Cas9 gene editing system in K562 cells. QRT-PCR (B) and Western blotting (C) were used to measure the different expression levels of MBD2 in K562 (MBD2 WT vs. MBD2 KO) cells. (D) The representative pictures of immunofluorescence in MBD2 WT and MBD2 KO cells, which demonstrate the expression level of MBD2. Blue, DAPI; Red, MBD2; magnification of x400. *P < 0.05 by Student's t-test.
Stable knockout of MBD2 by the CRISPR/Cas9 system in the K562 cell line
To address the effect of MBD2 in CML-BP, we used the gene editing technology of the CRISPR/Cas9 system to delete MBD2 in K562 cells. We designed a gRNA that directed exon2 of MBD2 (Supplement Fig. 1A), which was shared by all different transcripts, and we inverted it into the Cas9 and GFP expressing vector. After the editing and subsequent screening process, we picked out the clones and screened out mutated clones by DNA sequencing. DNA sequencing results showed that mutated clones had a homozygous deletion mutation compared to wild-type clones (Supplement Fig. 1B). We randomly chose two homozygous deletion mutation clones and two wild-type clones, named KO1, KO2 and WT1, WT2, respectively, for further experiments. The mRNA and protein expression of MBD2 were obviously depleted in mutant clones compared to wild-type clones. (–).
Deletion of MBD2 inhibits the proliferation of K562 cells in vitro
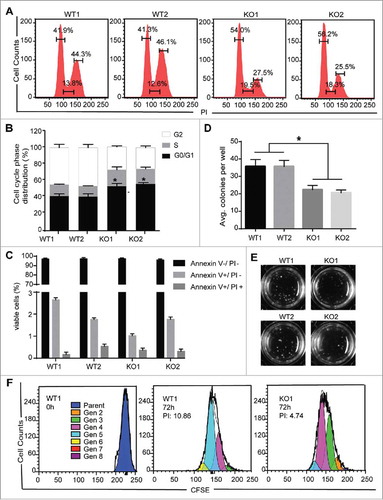
To assess the effects of MBD2 on K562 cells, we evaluated the cell-cycle distribution between the WT and KO using flow cytometry analysis. The results showed an accumulation of cells in the G0/G1 phase from 41.9% and 41.3% in WT1 and WT2, respectively, to 54.0% and 56.2% in KO1 and KO2, respectively, with a reduction in the number of cells in the S phase and the G2 phase in KO compared to WT cells ( and ). Furthermore, the number of colony forming unit (CFU) blasts was observed to be significantly decreased ( and ), indicating that MBD2 deletion inhibited the colony formation efficiency of K562 cells (P < 0.01). In addition, CFSE assays in K562 WT and KO cells show that the proliferation capacity in MBD2 deletion cells were consistently reduced (). However, as measured by flow cytometry with Annexin V/PI staining, the percentage of apoptotic KO cells was almost the same as that of apoptotic WT cells (, Supplement Fig. 1C). Furthermore, the expressions of myeloid differentiation markers (CD11b, CD11c and CD14) were detected by flow cytometry.Citation21–Citation23 Only the level of CD11b and CD14 were slightly higher in KO cells than in WT cells, but these changes were not statistically significant (Supplement Fig. 1D). These data strongly suggest that MBD2 is of great importance in the proliferation of K562 cells.
Figure 2. MBD2 Deletion Inhibited the Proliferation of K562 Cells in Vitro. (A) A cell-cycle analysis of the WT and KO group cells was performed by flow cytometry and PI staining. (B) The relative distribution of the cell cycle of K562 (MBD2 WT vs. MBD2 KO) cells showed evident arrest of the cell cycle. (C) Apoptosis was monitored on K562 (MBD2 WT vs. MBD2 KO) cells using flow cytometry and Annexin V/PI staining. The graph shows quantifications of apoptotic cells as a per cent of Annexin V and PI-positive cells. (D) K562 (MBD2 WT vs. MBD2 KO) cells were placed in methylcellulose media. The graph represents the calculation of colonies formed after culturing for 10 d. (E) Representative images of colony formation in WT (left) and KO (right) groups. (F) The WT and KO group cells were stained with CFSE and cultured for an additional 72h. The number of cells in each generation was estimated by deconvolution of the FACS data, and the proliferation index (PI) was calculated using ModiFit software. Representative modeled generational subsets (colored curves; Gen 2 to 8, generation 2 to 8) are shown. Each experiment was repeated three times. *, P < 0.05 by Student's t-test.
Inactivation of MBD2 arrested the cell cycle of K562 and BV173 cells
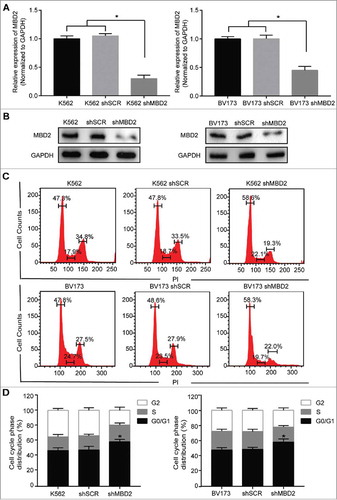
To make our data more sufficient, we constructed the second leukemic cell line model of blast crisis in BV173 cells and got pooled MBD2 knockout cells in K562 and BV173 cells. We employed lentivirus including Cas9 system with the MBD2 sgRNA (shMBD2) or scramble sgRNA (shSCR) to transfect K562 and BV173 cells, and virus-infected GFP+ cells were sorted for further study. Established shMBD2 cells were confirmed by the decreased mRNA and protein expressions of MBD2 compared with shSCR cells ( and ). Using flow cytometry analysis, we evaluated the differences of cell-cycle distribution after MBD2 deletion in K562 and BV173 cells, respectively ( and ). The results showed cell cycle arrest in the G0/G1 phase after MBD2 depletion, 47.3% in K562 cells and 47.8% in K562 shSCR cells compared with 56.8% in K562 shMBD2 cells, along with 47.8% in BV173 cells and 48.6% in BV173 shSCR cells compared with 58.3% in BV173 shMBD2 cells. In addition, we detected the similar effect after siRNA mediated MBD2 knockdown in K562 cells (Supplement Fig. 2). In summary, inactivation of MBD2 arrested the cell cycle in both K562 and BV173 cells.
Figure 3. Inactivation of MBD2 Affected the Cell Cycle of K562 and BV173 Cells. The inactivation of MBD2 was constructed by transfecting lentivirus with Cas9 system in K562 and BV173 cells. QRT-PCR (A) and Western blotting (B) were used to measure the expression levels of MBD2 in shMBD2 and shSCR groups of K562 and BV173 cells, respectively. (C)Cell-cycle analysis of the shMBD2 and shSCR groups of K562 and BV173 cells was performed by flow cytometry and PI staining. Each experiment was repeated three times. (D) The relative distribution of the cell cycle of K562 group cells and BV173 group cells were shown. Each experiment was repeated three times. *, P < 0.05 by Student's t-test.
MBD2 deficiency inhibited JAK2/STAT3 pathway in K562 cell lines
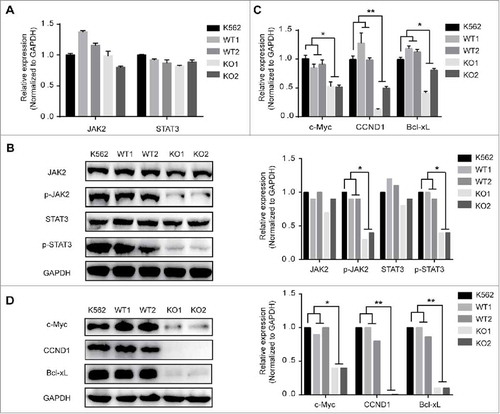
Constitutive activation of JAK2 and STAT3 is believed to mediate neoplastic transformation and abnormal proliferation of tumour cells, and JAK2 and STAT3 are the essential members of the JAK/STAT pathway.Citation24–Citation26 Given that the aberrant activation of JAK/STAT signalling is critical in CML-BP patients, we examined the effect of MBD2 down-regulation on JAK2, STAT3 and the downstream genes (c-Myc, Bcl-xL and cyclin D1). The results show that the cells in the homozygous deletion mutation of MBD2 groups exhibited inactivation of the JAK2/STAT3 pathway compared with the two wild-type groups. As shown in and , the protein levels of the phosphorylated JAK2 and phosphorylated STAT3 were obviously decreased after down-regulation of MBD2, but the mRNA and total protein levels of JAK2 and STAT3 were not changed. Furthermore, phosphorylated JAK2 and phosphorylated STAT3 are the activated forms of JAK2 and STAT3, respectively. Down-regulation of p-JAK2 and p-STAT3 indicated the inhibition of the JAK2/STAT3 pathway. Next, we found that the expression levels of c-Myc, Bcl-xL, and CCND1 were much lower for both mRNA and protein in KO cells than in WT cells ( and ). CCND1, which is a protein required for progression of the cell cycle and is degraded as the cell enters the S phase, was significantly decreased in KO cells. In summary, knockout of MBD2 could inhibit the JAK2/STAT3 pathway in K562 cell lines.
Figure 4. The Effects of MBD2 Deletion on JAK2/STAT3 Signalling Pathways in K562 Cells. The K562 (MBD2 WT vs. MBD2 KO) cells were prepared and subjected to qRT-PCR and WB analysis. (A, B) The mRNA and protein levels of JAK2/ STAT3 signalling pathways were tested in the WT and KO group cells. (C, D) C-Myc, CCND1 and Bcl-xL were measured using qRT-PCR and WB. The quantitative analysis of WB density were shown (B right panel and D right panel). Each experiment was repeated three times. *P < 0.05 and **P < 0.01 by Student's t-test.
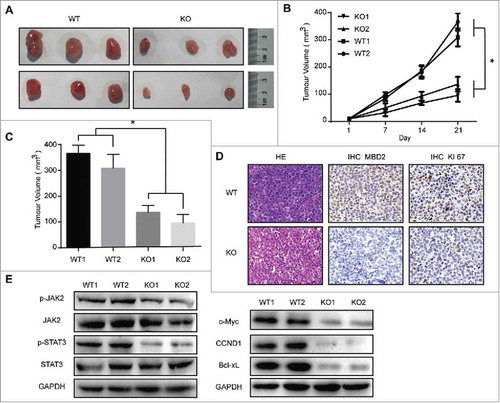
Deletion of MBD2 inhibited the oncogenic potential of K562 cells in a xenograft model
Next, we detected whether inhibition of MBD2 affected the oncogenic capacity of K562 cells in vivo. The K562 (MBD2 WT vs. MBD2 KO) cells were inoculated subcutaneously. We measured the subcutaneous tumours every two days and found that the groups of MBD2 KO had a much slower tumour outgrowth than the control groups (–). The immunohistochemistry (IHC) results revealed an obvious reduction in the expression of MBD2 and Ki67 in the tumour tissues of the MBD2 KO cells group compared with the MBD2 WT cells group was observed (). Then, we examined the JAK2/STAT3 pathway in the subcutaneous tumours of both KO and WT groups. The WB analysis showed that the levels of phosphorylated JAK2 and phosphorylated STAT3 were significantly decreased in KO groups compared to the WT groups, while the total protein levels of JAK2 and STAT3 were almost unchanged. As downstream targets of the JAK/STAT signalling pathway, c-Myc, CCND1 and Bcl-xL were detected by WB (). Meeting our expectation, the expression of c-Myc, CCND1 and Bcl-xL was decreased upon MBD2 deletion. In conclusion, our study strongly suggests that the down-regulation of MBD2 inhibits the oncogenic capacity of K562 cells in vivo, probably by inhibiting the JAK2/STAT3 pathway.
Figure 5. Deletion of MBD2 Impacted CML Cell Proliferation in Vivo. (A) Representative images of tumours at 21 d post-infection are shown. (B) Volume of subcutaneously formed tumours. Tumour volume was calculated as πLW2/6 for 3 weeks. (C) Subcutaneous tumour outgrowth of K562 WT and KO cells. (D) Representative images of haematoxylin and eosin stained section of K562 (MBD2 WT vs. MBD2 KO) cell-produced xenograft tumours, magnification × 400. For immunohistochemical inspection, MBD2 (the middle panel) and Ki67 (the right panel) are shown in the tumour tissues from each group. (E) The protein of the tumour cells was extracted and subjected to Western blot analysis. JAK2, p-JAK2, STAT3 and p-STAT3 were measured to analyse the effect on the JAK2/STAT3 signalling pathway; c-Myc, CCND1 and Bcl-xL were also detected. The data shown are averages of three mice in each group. Each experiment was repeated three times. *, P < 0.05 by Student's t-test.
SHP-1 was hypermethylated in CML-BP, and deletion of MBD2 restored the expression of SHP1 in CML
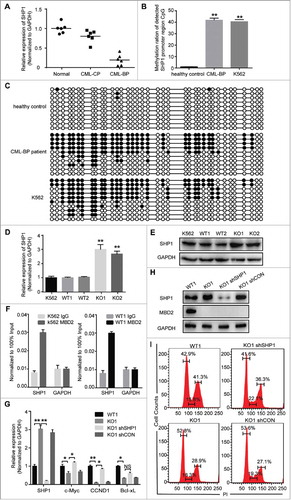
Previous studies have revealed that SHP1 is the upstream gene of the JAK/STAT pathway, and the DNA methylation of the SHP1 promoter was reported in many cancers.Citation20,Citation27–Citation32 We assumed that the function of SHP1 might be regulated by MBD2, which acts as a “reader” of DNA methylation. We observed that the mRNA levels of SHP1 were lower in BC-CML patients than CP-CML patients and healthy controls (). Bisulphite sequencing analysis further suggested that the methylation rates of the detected SHP1 promoter region were much higher in CML-BP patients (average 41.89%) and K562 cells (40.54%) than in normal controls (average 1.08%) ( and , Supplement Fig. 3). Furthermore, we measured the mRNA levels of SHP1 in K562 (MBD2 WT vs. MBD2 KO) cells and found that the expression of SHP1 was increased with the deletion of MBD2 (). At the protein level, SHP1 was also increased 2-fold in KO cells compared to K562 and WT cells (). We demonstrated that the expression of SHP1 was restored after MBD2 down-regulation in K562 cells. We demonstrated that the expression of SHP1 was restored after deletion of MBD2 in K562 cells. By Chromatin immunoprecipitation (ChIP) assay, the binding of MBD2 protein to the SHP1 promoter region was demonstrated in K562 and WT1 cells (). These results supported that MBD2 suppressed the transcriptional expression of SHP1 by directly binding to its promoter in leukemic cells. Furthermore, the decreased expression of JAK2/STAT3 target genes, including c-Myc and CCND1, could be obviously rescued by transfection with lentivirus mediated SHP1 knockdown into MBD2 deletion K562 cells (–). Down-regulation of SHP1 in MBD2 deletion K562 cells did not affect MBD2 ablation (). In conclusion, MBD2 might regulate the JAK2/STAT3 pathway by restoring the expression of SHP1.
Figure 6. CpG Methylation Levels of the SHP1 Promoter Region in K562, CML-BP patients and healthy controls. The methylation of SHP1 promoter region was read by MBD2 in CML. (A) The mRNA levels of SHP1 in CML-BP, CML-CP patients and healthy controls by qRT-PCR. CpG islands of the SHP-1 promoter region were from -2201 bp to -1814 bp, including 37 CpG sites. (B) The graph represents the average value of methylated rates of the detected region in three healthy controls, three CML-BP patients and K562 cell line. (C) Representative pictures of DNA bisulphite analysis results in healthy controls, CML-BP patients and K562 cell line. Every row represents a distinct clone. Each black or white circle represents a methylated or unmethylated CpG dinucleotide, respectively. (D, E) The expression levels of SHP1 were analysed in K562 (MBD2 WT vs. MBD2 KO) cells by qRT-PCR and WB. (F) By ChIP assay, binding of MBD2 to the SHP1 promoter was demonstrated in K562 and WT1 cells. DNA expression levels were normalized to input group (100%). GAPDH was selected as a negative control. (G-I) SHP1 shRNA and shCON were transfected into MBD2 deficient K562 cells (KO1). (G) qRT-PCR confirmed the down-regulation of SHP1 at the mRNA level. The transcription levels of CCND1, c-Myc and Bcl-xL, the downstream target genes, were analyzed by qRT-PCR. (H) WB analysis of SHP1 and MBD2 expression in WT1, KO1, KO1 shRNA and KO1 shCON cells. (I)The cell cycle was analyzed in WT1, KO1, KO1 shSHP1 and KO1 shCON cells using PI staining. Typical flow cytometry profiles show representative data from three independent experiments. Each experiment was repeated three times. *, P < 0.05 and **, P < 0.01 by Student's t-test.
Discussion
The first human immortalised myeloid leukaemia line, K562, was derived from a 53-year-old female CML patient in blast crisis, while BV173 was established from a 45-year-old man with CML in blast crisis. We found that MBD2 inactivation blocked cell cycle in K562 and BV173 cells. For the first time, we constructed a cell model of a homozygous deletion mutation of MBD2 using the CRISPR/Cas9 gene editing system in K562 cells. In the present report, we obtained results showing that deletion of MBD2 inhibited the proliferation of CML blast crisis cells by restoring the expression of SHP1 and inhibiting the JAK2/STAT3 pathway.
Janus tyrosine kinase-signal transducer and activator of transcription (JAK/STAT) signalling takes part in many cellular processes, including cell proliferation, survival and differentiation.Citation26 It is known that the constitutive activation of the JAK/STAT pathway not only occurs in solid cancers but is also involved in the development of leukaemia and lymphoma.Citation3,Citation24,Citation26 Many members of the JAK/STAT pathway have been abnormally activated in CML, including JAK2, STAT3 and STAT5. Our further study showed that the effect of MBD2 deletion was accomplished by the inhibition of the JAK2/STAT3 pathway. Mouse subcutaneous tumour model was consistent with the data in vitro. The expression levels of three genes, CCND1, c-Myc and Bcl-xL, were obviously reduced upon MBD2 disruption, especially the gene for CCND1, which varied the most significantly. The three genes are downstream of the JAK2/STAT3 pathway. The study from Li Lin et al. has shown that the STAT3 inhibitor FLLL32 inhibits the expression of CCND1, which is one of the STAT3 downstream targets in cancer cells.Citation33 Previous studies have revealed that JAK2 mediates the increase in c-Myc expression in CML cells,Citation34 while the increase expression of Bcl-xL is associated with activation of JAK2 and STAT323. Consistent with our data, Ma Lingdi and co-workers have found that inactivation of JAK2/STAT3 and down-regulation of c-Myc and CCND1 induced cell cycle arrest in K562 cells.Citation35 CCND1 is known as a proto-oncogene and involved in regulating cell cycle progression with regulating the G1/S phase transition. As a regulator of G1-specific Cyclin-dependent kinases (CDKs), the expression level of c-Myc is closely related to cell proliferation. Meanwhile, Bcl-xL belongs to the anti-apoptotic Bcl-2 family. While the JAK2 inhibitor and STAT3 inhibitor have shown a good effect in inhibiting the proliferation of many kinds of cancer cells,Citation24,Citation25,Citation33,Citation36 MBD2 deletion also showed an obvious inhibitory effect in CML.
SHP1, Src homology 2 domain-containing phosphatase, acts as a negative regulator of the JAK/STAT signalling pathway and is directly associated with dephosphorylation of JAK2 kinase.Citation37 Low expression of SHP1 due to DNA hypermethylation of CpG islands in the promoter region has been reported in various haematological diseases.Citation32 We found that SHP1 was also low expression in CML-BP and further tested whether it was regulated by MBD2. One previous study has shown that induction of SHP1 expression in K562 leads to cell cycle arrest,Citation38 and functional inactivation of SHP1 may take part in the progression to blast phase. Our study suggests that restoration of the SHP1 gene by MBD2 deletion arrests the cell cycle of K562 at the G0/G1 phase, mainly by inhibition of the JAK2/STAT3 pathway.
To improve the prognosis of CML-BP, TKIs combined with other agents were used in clinical trials, including decitabine, carboplatin, plicamycin, etoposide, cladribine and hydroxyurea.Citation2 Decitabine is a classical DNA methylation inhibitor and has been successfully used in the treatment of some haematological diseases, especially myelodysplastic syndrome and acute myeloid leukaemia. Several clinical studies demonstrated that decitabine monotherapy alone or in combination with TKI has shown a promising response rate in CML-BP.Citation7,Citation39,Citation40 However, limited by toxicity and opposing effects associated with nonspecific demethylation, the clinical utility of decitabine in CML was not promoted. However, MBD2 functions as a mediator of the biological consequences of the methylation signal and specifically regulates the expression of genes that are silenced by DNA methylation in the promoter regions.Citation9 In our study, disruption of MBD2 is effective to inhibit the proliferation of CML-BP cell lines. Unlike DNA methylation inhibitors, targeting MBD2 will not lead to widespread demethylation.Citation15
Based on the studies reported here, we conclude that disruption of MBD2 can inhibit the proliferation of CML-BP cells in vivo and in vitro. Given the striking effect in CML blast crisis cell lines, we believe that targeting MBD2 could be a candidate therapeutic strategy for CML-BP patients.
Materials and methods
Cell culture and patients
The chronic myeloid leukaemia blast crisis cell lines, K562 was originally purchased from American Type Culture Collection (ATCC, Manassas, VA), and BV173 from German Collection of Microorganisms and Cell Cultures (DMSZ, Leibniz, Germany). K562 cells were cultured in RPMI-1640 (HyClone) supplemented with 10% foetal bovine serum (Gibco) at 37°C in a humidified atmosphere containing 5% CO2, while BV173 cell with 20% Gibco. Bone marrow (BM) specimens were collected from twelve patients older than 16 y who had been diagnosed with CML at the chronic or blast phase at Tongji Hospital, Wuhan, China, according to the 2008 criteria of the World Health Organization (WHO). Normal BM samples were also collected from six healthy volunteer donors. Leukocytes were isolated from these specimens on Ficoll gradients and stored frozen in aliquots. All BM specimens were collected before chemotherapy. In accordance with the Declaration of Helsinki, appropriate informed consent was signed by each patient and healthy volunteer donor before specimen collection, and the research protocol was approved by the ethics committees of Tongji Hospital.
Deletion of MBD2 via customized CRISPR/CAS9 expression vector
The vector pSpCas9 (BB)-2A-GFP (PX458) (Plasmid #48138) was purchased from Addgene (Massachusetts, USA). Targeting the MBD2 exon2 locus, the oligo-DNA was designed on the MIT online software ZhangFeng lab: http://crispr.mit.edu/.Citation41–Citation43 The sequences of the oligonucleotides (guide-up, 5′-CAC CGC CTC AGT TGG CAA GGT ACC T; and guide-down, 5′-AAA CAG GTA CCT TGC CAA CTG AGG C) were used to create double-stranded guide RNAs. For transient transfection, 3 µg of the constructed vector was nucleo-transfected into 1 × 10⁶ K562 cells with the 4D-Nucleofector and 4D-Nucleofector™ X Unit Kit (Lonza, Basel, Switzerland) applying the program SF-FF120. The GFP positive cells were FACS sorted 48 hours after transfection for single cell cloning. After culturing for two weeks, a portion of the cells in each clone was collected for PCR analysis to detect insertions or deletions using the primers forward, 5′- TCG CGC CTA GCA AAA CTT TA-3′; and reverse, 5′- TGA AAT GCT GTT TTC TAC TGT GC-3′. To confirm the mutation of a single allele, the fragments for PCR amplification were subcloned into the pEASY-T1Simple Cloning Vector (TransGen Biotech, Beijing, China). Cell clones with homozygous deletion mutations of MBD2 were selected for further experiments.
The pooled MBD2 knockout cells were generated by CRISPR/Cas9 system using lentiviral particles. The corresponding single guide RNAs (sgRNAs) were cloned into GV393 plasmid (U6-sgRNA-EF1a-Cas9-FLAG-P2A-EGFP) by GeneChem (GeneChem, Shanghai, China). The sequence of MBD2 sgRNA (shMBD2) is CCTCAGTTGGCAAGGTACCT and the sequence of scramble sgRNA (shSCR) is CGCTTCCGCGGCCCGTTCAA. Lentiviral particles were used to deliver the corresponding plasmid to K562 and BV173 cell lines according to the manufacturer's instruction. Virus-infected GFP+ cell were sorted by the BD FACS Aria cell sorter.
Immunofluorescence
First, 4% paraformaldehyde was used to fix the K562 WT and KO cells for 30 min. The cell membranes were ruptured with 0.2% Triton X-100. After being blocked with 5% BSA for 15 minutes at room temperature, the primary antibody MBD2 (sc-10752, Santa Cruz) was used for incubation overnight at 4°C. According to the manufacturer's guidelines, Alexa Fluor 594-Donkey Anti-Rabbit IgG (H+L) Conjugate was used as the secondary antibody from AntGene. The nuclei were stained with 1 μg/μl DAPI. Images were taken using an OLYMPUS microscope (Tokyo, Japan).
Western blotting and antibodies
The cell protein was extracted by RIPA buffer with protease inhibitor cocktail. Equal amounts of total protein were separated by SDS-PAGE, transferred to polyvinylidene fluoride (PVDF) membranes (Millipore, Bedford, MA), and incubated with primary antibodies overnight at 4°C after being blocked in 5% skim milk for 1 h. The next day, the blots were incubated with HRP-conjugated secondary antibodies for 1 hour at room temperature. After washing twice, immunoblotting analysis was performed with the Enhanced Chemiluminescence (ECL) Western Blotting Detection reagents (Pierce, USA). Anti-GAPDH (10494-1-AP) and anti-Bcl-xl (26967-1-AP) were purchased from Proteintech. Antibodies specific for STAT3 (#12640S), phospho-STAT3 (#9145S), JAK2 (#3230P), and phospho-JAK2 (#8082S) were purchased from Cell Signaling Technologies. Cyclin D1 (ab134175) and c-Myc (ab32072) were from Abcam. MBD2 (sc-10752) was obtained from Santa Cruz.
Quantitative RT-PCR (qRT-PCR) analysis
A TRIzol Kit (Invitrogen, Grand Island, NY) was used to isolate the total RNA from cells, and a High-Capacity cDNA Reverse Transcription Kit (Applied Biosystems™; Thermo Fisher Scientific) was used to reverse transcribe the total RNA in cDNA. Then, qRT-PCR was performed with the ABI Prism 7900 Sequence Detection System (Applied Biosystems, Grand Island, NY) with SYBR Green Supermix (Applied Biosystems) as instructed (see for primers). All data were normalized using the endogenous GAPDH control, and the ΔΔCt method was used to calculate the relative gene expression.
Table 1. The sequences of the primers used in qRT-PCR.
Flow cytometry analysis
Using the FITC Annexin V Apoptosis Detection kit (BD Pharmingen, San Diego, CA, USA), apoptosis assay cells were examined by flow cytometry following double staining with Annexin V-FITC and PI according to the manufacturer's instructions. After fixation in 75% ethanol overnight at −20°C, cells were washed with PBS and stained with PI for 30 min at 4°C. Stained cells were analysed for DNA content in FACS Calibur (Becton Dickinson, USA) using the Cell Quest program (Becton Dickinson, USA). For assessment of myeloid differentiation, K562 WTs and KOs cells were incubated with anti-CD11b conjugated to APC, anti-CD11c-APC and anti-CD14-APC (Bio Legend, San Diego, CA) respectively and monitored by flow cytometry.
Carboxyfluorescein diacetate succinimidyl ester (CFSE) assay
The K562 cells were stained with CFSE (Molecular Probes) as previous studyCitation44 and cultured at 1 × 10⁶/well. Cell proliferation was determined via flow cytometry (FACS Calibur, CA, USA) on day 3 using ModFit software.
Colony formation assay
K562 (MBD2 WT vs. MBD2 KO) cells were plated in 24-well plates (200/ml/well) into methylcellulose media (Methocut H4435; Stem Cell Technologies, Vancouver, BC, Canada) and incubated at 37°C and 5% CO2. After 10 d, colonies were observed and photographed under light microscopy (Zeiss, Munchen, Germany).
Immunohistochemistry (IHC)
The tumour tissues were fixed by 10% formalin and cut into 4 μm paraffin-embedded sections. After the pretreatment, the slides were incubated with the primary antibody rabbit anti-Ki67 (ab15580, Abcam) and MBD2 (sc-10752, Santa Cruz) overnight at 4°C. Antibody detection was performed using DAB according to the manufactures' protocol. Photographs of typical images were taken using an OLYMPUS microscope (Tokyo, Japan).
Tumour xenografts in nude mice and grouping
All animal experiments were performed in accordance with the guidelines of the Institutional Committee of Animal Care and Treatment at Tongji Hospital. Using nude mice, K562 (MBD2 WT vs. MBD2 KO) cells were tested for their oncogenic potential in vivo. Five 4-week-old female nude mice were included in each group. In subcutaneous models, 8 × 10⁶ cells were suspended in 0.1 ml PBS and injected into the right flank of each mouse at a single site. Tumour length (L) and width (W) were measured every two days after injection. Tumour volume was calculated as πLW2/ 6. All mice were kept in a pathogen-free animal facility at Tongji Hospital of Tongji Medical College, Huazhong University of Science and Technology, Wuhan, China and euthanized by cervical dislocation 3 weeks after inoculation.
Bisulphite sequencing PCR (BSP)
Genomic DNA from the cells of patients, healthy controls and the K562 cell line was extracted using a QIAamp DNA mini kit (QIAGEN, Valencia, CA). A quantity of 0.5 μg DNA from each sample was then subjected to bisulphite conversion using an EZ DNA Methylation Kit (Zymo, Orange, CA) according to the manufacturer's instructions. After obtaining the converted DNA, the SHP1 promoter region was amplified (product size, 364 bp). The primers used were as follows: forward, 5′-TTGGGATTTTATTGGGTTATT-3′; reverse, 5′- CCAAAAATATTAATCAAATTATAACTACC −3′. The program was as follows: 95°C for 10 minutes; followed by 38 cycles of 95°C for 30 s, 50°C for 30 s and 72°C for 30 s; and a final extension at 72°C for 7 min. The PCR products were purified using a DNA purification kit (Tiangen, Beijing, China) and then cloned in the pEASY-T1 Simple Cloning Vector (TransGen Biotech, Beijing, China). Ten positive clones derived from each PCR product were randomly selected for DNA sequencing analysis using an ABI3750 sequencer. DNA sequencing results were analysed by DNA Baser (Heracle BioSoft, Romania).
Knockdown of SHP1 expression by lentivirus mediated shRNA
Lentiviral particles containing the GV248 expression vector against human SHP1 and randomized flanking sequence control were purchased from GeneChem (GeneChem, Shanghai, China) and transduced into K562 WT and KO cells following the manufacturer's instructions. The shRNA sequences were as follows: targeting SHP1 (shSHP1): 5′-TCTCCCTGACCCTGTATAT-3′and the negative control shRNA (shCON): 5′- TTCTCCGAACGTGTCACGT-3′. With the BD FACS Aria cell sorter, the virus-infected GFP+ cells were sorted for further analysis.
SiRNA mediated MBD2 knockdown
Non-specific controland MBD2 siRNA were purchased from Thermo. For siRNA knock-down assays, K562 cells (1-2 × 10⁶ cells per 100 μl) were transfected with 1 μm MBD2 siRNA (siMBD2) or control siRNA (siCON) by nucleofection with the 4D-Nucleofector and 4D-Nucleofector™ X Unit Kit (Lonza, Basel, Switzerland) applying the program SF-FF120. The sequence of the siRNA was as follows: 5′-GGAAGAAGGAGGAAGUGAUCCGAAA-3′ and 5′-UUUCGGAUCACUUCCUCCUUCUUCC −3′.
Chromatin immunoprecipitation (ChIP) assay
ChIP assays were performed as previously described.Citation19 Antibody anti-MBD2 was from Bethyl Laboratories, and isotypic IgG from Beyotime Biotechnology. The DNA Purification Kit (TIANGEN, Beijing, China) was used to purify the coprecipitated DNA. The purified DNA was then removed to amplify MBD2-targeted DNA sequences by qRT-PCR in ChIP assays, with the primers used for GADPH (5′-AACTAGGATGGTGTGGCTCC-3′and 5′-ATCGCCCCACTTGATTTTGG-3′) and for SHP1 (5′- GCCTGGACTGTGACATTGAC-3′ and 5′- ATGTTCCCGTACTCCGACTC-3′).
Statistical analysis
Data were expressed as the mean ± standard deviation (SD) of three independent experiments. Significant differences between groups were statistically analysed using Student's t-test. All tests were performed with GraphPad Prism 6 (GraphPad Software, Inc., La Jolla, CA, USA). * P value of < 0.05 and ** P value of < 0.01 were considered statistically significant.
Abbreviations
| GAPDH | = | glyceraldehyde-3-phosphate dehydrogenase |
| MBD2 | = | ethyl-CpG binding domain protein 2 |
| JAK2 | = | Janus kinase 2 |
| STAT3 | = | signal transducer and activator of transcription 3 |
| c-Myc | = | MYC proto-oncogene, bHLH transcription factor |
| CCND1 | = | Cyclin D1 |
| Bcl-xL | = | B-cell lymphoma-extra large |
| SHP1 | = | protein tyrosine phosphatase, non-receptor type 6. |
Disclosure of potential conflicts of interest
No potential conflicts of interest were disclosed.
2017CBT10703R-f07-z-4c.docx
Download MS Word (4.9 MB)Additional information
Funding
References
- Apperley JF. Chronic myeloid leukaemia. Lancet. 2015;385:1447–59. doi:10.1016/S0140-6736(13)62120-0. PMID:25484026.
- Karbasian Esfahani M, Morris EL, Dutcher JP, Wiernik PH. Blastic phase of chronic myelogenous leukemia. Curr Treat Options Onco.l. 2006;7:189–99. doi:10.1007/s11864-006-0012-y.
- Perrotti D, Jamieson C, Goldman J, Skorski T. Chronic myeloid leukemia: Mechanisms of blastic transformation. J Clin Invest. 2010;120:2254–64. doi:10.1172/JCI41246. PMID:20592475.
- Koschmieder S, Vetrie D. Epigenetic dysregulation in chronic myeloid leukaemia: A myriad of mechanisms and therapeutic options. Semin Cancer Biol. 2017; S1044-579X(17)30152–9. doi:10.1016/j.semcancer.2017.07.006. PMID:28778403.
- Heller G, Topakian T, Altenberger C, Cerny-Reiterer S, Herndlhofer S, Ziegler B, Datlinger P, Byrgazov K, Bock C, Mannhalter C, et al. Next generation sequencing identifies major DNA methylation changes during progression of Ph+ chronic myeloid leukemia. Leukemia. 2016;30:1861–8. doi:10.1038/leu.2016.143. PMID:27211271.
- Tabarestani S, Movafagh A. New developments in chronic myeloid leukemia: Implications for therapy. Iran J Cancer Prev. 2016;9:1–8.
- Amabile G, Di Ruscio A, Müller F, Welner RS, Yang H, Ebralidze AK, Zhang H, Levantini E, Qi L, Martinelli G, et al. Dissecting the role of aberrant DNA methylation in human leukaemia. Nat Commun. 2015;6:7091. doi:10.1038/ncomms8091. PMID:25997600.
- Jelinek J, Gharibyan V, Estecio MRH, Kondo K, He R, Chung W, Lu Y, Zhang N, Liang S, Kantarjian HM, et al. Aberrant DNA methylation is associated with disease progression, resistance to imatinib and shortened survival in chronic myelogenous leukemia. PLoS One. 2011;6:1–9. doi:10.1371/journal.pone.0022110.
- Fatemi M, Wade PA. MBD family proteins: reading the epigenetic code. J Cell Sci 2006;119:3033–7. doi:10.1242/jcs.03099. PMID:16868031.
- Zhao X, Ueba T, Christie BR, Barkho B, McConnell MJ, Nakashima K, Lein ES, Eadie BD, Willhoite AR, Muotri AR, et al. Mice lacking methyl-CpG binding protein 1 have deficits in adult neurogenesis and hippocampal function. Proc Natl Acad Sci. 2003;100:6777–82. doi:10.1073/pnas.1131928100. PMID:12748381.
- Hendrich B, Guy J, Ramsahoye B, Wilson VA, Bird A. Closely related proteins MBD2 and MBD3 play distinctive but interacting roles in mouse development. Genes Dev. 2001;15:710–23. doi:10.1101/gad.194101. PMID:11274056.
- Guy J, Hendrich B, Holmes M, Martin JE, Bird A. A mouse Mecp2-null mutation causes neurological symptoms that mimic Rett syndrome. Nat Genet. 2001;27:322–6. doi:10.1038/85899. PMID:11242117.
- Sansom OJ, Zabkiewicz J, Bishop SM, Guy J, Bird A, Clarke AR. MBD4 deficiency reduces the apoptotic response to DNA-damaging agents in the murine small intestine. Oncogene. 2003;22:7130–6. doi:10.1038/sj.onc.1206850. PMID:14562041.
- Cook PC, Owen H, Deaton AM, Borger JG, Brown SL, Clouaire T, Jones GR, Jones LH, Lundie RJ, Marley AK, et al. A dominant role for the methyl-CpG-binding protein Mbd2 in controlling Th2 induction by dendritic cells. Nat Commun. 2015;6:1–11. doi:10.1038/ncomms7920.
- Berger J, Bird A. Role of MBD2 in gene regulation and tumorigenesis. Biochem Soc Trans. 2005;33:1537–40. doi:10.1042/BST0331537. PMID:16246164.
- Mian OY, Wang SZ, Zhu SZ, Gnanapragasam MN, Graham L, Bear HD, Ginder GD. Methyl-binding domain protein 2-dependent proliferation and survival of breast cancer cells. Mol Cancer Res. 2011;9:1152–62. doi:10.1158/1541-7786.MCR-11-0252. PMID:21693597.
- Stefanska B, Suderman M, Machnes Z, Bhattacharyya B, Hallett M, Szyf M. Transcription onset of genes critical in liver carcinogenesis is epigenetically regulated by methylated DNA-binding protein MBD2. Carcinogenesis. 2013;34:2738–49. doi:10.1093/carcin/bgt273. PMID:23955541.
- Campbell PM, Bovenzi V, Szyf M. Methylated DNA-binding protein 2 antisense inhibitors suppress tumourigenesis of human cancer cell lines in vitro and in vivo. Carcinogenesis. 2004;25:499–507. doi:10.1093/carcin/bgh045. PMID:14688029.
- Zhou M, Zhou K, Cheng L, Chen X, Wang J, Wang X-M, Zhang Y, Yu Q, Zhang S, Wang D, et al. MBD2 ablation impairs lymphopoiesis and impedes progression and maintenance of T-ALL. Cancer Res. 2018; canres.1434.2017. doi:10.1158/0008-5472.CAN-17-1434. PMID:29330145.
- Zhang XK, Yang L, Liu XJ, Nie ZY, Wang XZ, Pan YX, Luo JM. Research on the epigenetic regulation mechanism of the PTPN6 gene in advanced chronic myeloid leukaemia. Br J Haematol. 2017;178(5):728–38. doi:10.1111/bjh.14739. PMID:28480959.
- Yin L, Ahmad R, Kosugi M, Kawano T, Avigan D, Stone R, Kharbanda S, Kufe D. Terminal differentiation of chronic myelogenous leukemia cells is induced by targeting of the MUC1-C oncoprotein. Cancer Biol Ther. 2010;10:483–91. doi:10.4161/cbt.10.5.12584. PMID:20592495.
- Hongy Z, Xiaoy M, Yang Y, Han Z, Cao Y, Li C, Wu Y, Gong Q, Zhou X, Xu D, et al. Arsenic disulfide synergizes with the phosphoinositide 3-kinase inhibitor PI-103 to eradicate acute myeloid leukemia stem cells by inducing differentiation. Carcinogenesis. 2011;32:1550–8. doi:10.1093/carcin/bgr176. PMID:21803735.
- Cai H, Qin X, Yang C. Dehydrocostus lactone suppresses proliferation of human chronic myeloid leukemia cells through Bcr/Abl-JAK/STAT signaling pathways. J Cell Biochem. 2017;118:3381–90. doi:10.1002/jcb.25994. PMID:28300289.
- Hedvat M, Huszar D, Herrmann A, Gozgit JM, Sheehy A, Buettner R, Proia D, Kowolik CM, Xin H, Armstrong B, et al. The JAK2 Inhibitor, AZD1480, Potently Blocks Stat3 Signaling and Oncogenesis in Solid Tumors. Cancer Cell. 2009;16(6):487–497. doi:10.1016/j.ccr.2009.10.015. PMID:19962667.
- Stechishin OD, Luchman HA, Ruan Y, Blough MD, Nguyen SA, Kelly JJ, Cairncross JG, Weiss S. On-target JAK2 / STAT3 inhibition slows disease progression in orthotopic xenografts of human glioblastoma brain tumor stem cells. Neuro-oncology. 2012;15:198–207. doi:10.1093/neuonc/nos302. PMID:23262510
- Valentino L, Pierre J. JAK/STAT signal transduction: Regulators and implication in hematological malignancies. Biochem Pharmacol. 2006;71:713–21. doi:10.1016/j.bcp.2005.12.017. PMID:16426581.
- Chim CS, Wong ASY, Kwong YL. Epigenetic dysregulation of the Jak/STAT pathway by frequent aberrant methylation of SHP1 but not SOCS1 in acute leukaemias. Ann Hematol. 2004;83:527–32. doi:10.1007/s00277-004-0843-1. PMID:14762685.
- Witzig TE, Hu G, Offer SM, Wellik LE, Han JJ, Stenson MJ, Dogan A, Diasio RB, Gupta M. Epigenetic mechanisms of protein tyrosine phosphatase 6 suppression in diffuse large B-cell lymphoma: implications for epigenetic therapy. Leukemia. 2014;28:147–54. doi:10.1038/leu.2013.251. PMID:23979523.
- Oka T, Ouchida M, Koyama M, Lymphomas L. Gene silencing of the tyrosine phosphatase SHP1 gene by aberrant methylation in leukemias / lymphomas. Cancer Res. 2002 Nov 15;62(22):6390–4.
- Zhang Y, Zhao D, Zhao H, Wu X, Zhao W, Wang Y, Xia B, Da W. Hypermethylation of SHP-1 promoter in patient with high-risk myelodysplastic syndrome and it predicts poor prognosis. Med Oncol. 2012;29:2359–63 doi:10.1007/s12032-012-0163-6. PMID:22258937.
- Chim CS, Fung TK, Cheung WC, Liang R, Kwong YL. SOCS1 and SHP1 hypermethylation in multiple myeloma: implications for epigenetic activation of the Jak/STAT pathway. Blood. 2004;103:4630–5. doi:10.1182/blood-2003-06-2007. PMID:14976049.
- Han Y, Amin HM, Franko B, Frantz C, Shi X, Lai R. Loss of SHP1 enhances JAK3/STAT3 signaling and decreases proteosome degradation of JAK3 and NPM-ALK in ALK+ anaplastic large-cell lymphoma. Blood. 2006;108:2796–803. doi:10.1182/blood-2006-04-017434. PMID:16825495.
- Lin L, Deangelis S, Foust E, Fuchs J, Li C, Li P-K, Schwartz EB, Lesinski GB, Benson D, Lü J, et al. A novel small molecule inhibits STAT3 phosphorylation and DNA binding activity and exhibits potent growth suppressive activity in human cancer cells. Mol Cancer. 2010;9:217. doi:10.1186/1476-4598-9-217. PMID:20712901.
- Xie S, Lin H, Sun T, Arlinghaus RB. Jak2 is involved in c-Myc induction by Bcr-Abl. Oncogene. 2002;21:7137–46 doi:10.1038/sj.onc.1205942. PMID:12370803.
- Ma L, Zhu Z, Jiang L, Sun X, Lu X, Zhou M, Qian S, Jianyong L. Matrine suppresses cell growth of human chronic myeloid leukemia cells via its inhibition of the interleukin-6/Janus activated kinase/signal transducer and activator of transcription 3 signaling cohort. Leuk Lymphoma. 2015;56:2923–30. doi:10.3109/10428194.2015.1007507. PMID:25629992.
- Jung JH, Kwon T, Jeong S, Kim E, Sohn EJ, Yun M, Kim S. Apoptosis induced by tanshinone IIA and cryptotanshinone is mediated by distinct JAK / STAT3 / 5 and SHP1 / 2 signaling in chronic myeloid leukemia K562 cells. Evid Based Complement Alternat Med. 2013;2013:805639. doi:10.1155/2013/805639. PMID:23878608.
- Jiao H, Berrada K, Yang W, Tabrizi M, Platanias LC, Yi T. Direct association with and dephosphorylation of Jak2 kinase by the SH2-domain-containing protein tyrosine phosphatase SHP-1. Mol Cell Biol. 1996;16:6985–92. doi:10.1128/MCB.16.12.6985. PMID:8943354.
- Bruecher-Encke B, Griffin JD, Neel BG, Lorenz U. Role of the tyrosine phosphatase SHP-1 in K 562 cell differentiation. Leukemia. 2001 Sep;15(9):1424–32. doi:10.1038/sj.leu.2402214.
- Jiang L, Luo J. Role and mechanism of decitabine combined with tyrosine kinase inhibitors in advanced chronic myeloid leukemia cells. Oncol Lett. 2017;14(2):1295–302. doi:10.3892/ol.2017.6318. PMID:28789344.
- Oki Y, Kantarjian HM, Gharibyan V, Jones D, O'Brien S, Verstovsek S, Cortes J, Morris GM, Garcia-Manero G, Issa JPJ. Phase II study of low-dose decitabine in combination with imatinib mesylate in patients with accelerated or myeloid blastic phase of chronic myelogenous leukemia. Cancer. 2007;109:899–906. doi:10.1002/cncr.22470. PMID:17236224.
- Gu J, Li TJ, Zhao L, Liang X, Fu X, Wang J, Shang Z, Huang W, Zhou J. Identification of significant pathways induced by PAX5 haploinsufficiency based on protein-protein interaction networks and Cluster analysis in Raji Cell Line. Biomed Res Int. 2017;2017(7):5326370. doi:10.1155/2017/5326370. PMID: 28316978.
- Jung Y-S, Jun S, Lee SH, Sharma A, Park J-I. Wnt2 complements Wnt/β-catenin signaling in colorectal cancer. Oncotarget. 2015;6:37257–68. doi:10.18632/oncotarget.6133. PMID:26484565.
- Ran FA, Hsu PD, Wright J, Agarwala V, Scott DA, Zhang F. Genome engineering using the CRISPR-Cas9 system. Nat Protoc. 2013;8:2281–308. doi:10.1038/nprot.2013.143. PMID:24157548.
- Wang J, Li T, Zhou M, Hu Z, Zhou X, Zhou S, Wang N, Huang L, Zhao L, Cao Y, et al. TALENs-mediated gene disruption of FLT3 in leukemia cells: using genome-editing approach for exploring the molecular basis of gene abnormality. Sci Rep. 2015;5:1–13.