
ABSTRACT
Cancer stem cells (CSCs) are considered to be responsible for tumorigenesis and cancer relapse. EpCAMhighCD44+ tumor cells are putative colorectal CSCs that express high levels of stem cell genes, while the EpCAMhighCD44− population mostly contains differentiated tumor cells (DTCs). This study aims to determine whether single CSC (EpCAMhighCD44+) and DTC (EpCAMhighCD44−) can be distinguished in terms of somatic copy number alterations (SCNAs). We applied fluorescence-activated cell sorting to isolate the CD45−EpCAMhighCD44+ and CD45−EpCAMhighCD44− populations from two primary colon tumors, on which low-coverage single-cell whole-genome sequencing (WGS) was then performed ∼0.1x depth. We compared the SCNAs of the CSCs and DTCs at single-cell resolution. In total, 47 qualified single cells of the two populations underwent WGS. The single-cell SCNA profiles showed that there were obvious SCNAs in both the CSCs and DTCs of each patient, and each patient had a specific copy number alteration pattern. Hierarchical clustering and correlation analysis both showed that the SCNA profiles of CSCs and DTCs from the same patient had similar SCNA pattern, while there were regional differences in the CSCs and DTCs in certain patient. SCNAs of CSCs in the same patient were highly reproducible. Our data suggest that major SCNAs occurred at an early stage and were inherited steadily. The similarity of ubiquitous SCNAs between the CSCs and DTCs might have arisen from lineage differentiation. CSCs from the same patient had reproducible SCNA profiles, indicating that gain or loss in certain chromosome is required for colon cancer development.
Introduction
Colon cancer, which has a high incidence rate, is one of the leading causes of cancer-related deaths worldwide.Citation1 Its metastasis and relapse raise the question of which cells give rise to the disease and somehow escape from the first-line treatment, reside in the body undetected, and finally initiate malignant tumor growth in a suitable microenvironment. Increasing experimental evidence suggests that cancer stem cells (CSCs) may play a decisive role in the initiation and progression of tumors.Citation2,Citation3 These cells are relatively rare and have the ability to self-renew, giving rise to other malignant stem cells as well as cells that undergo massive proliferation and differentiation to generate phenotypically and functionally more mature cancer cells.Citation3 Therefore, the eradication of CSCs is of great importance in curing cancer.Citation2
CSCs have been reported in many solid tumors,Citation4-Citation6 including colon cancer.Citation7 In colon cancer, several putative CSC markers have been reported, such as EpCAM,Citation8 CD44,Citation9 ALDH,Citation10 and Lgr5.Citation11 CSCs and differentiated tumor cells (DTCs) differ in their tumor initiating capacities. For instance, in colon cancer, EpCAMhighCD44+-enriched CSCs were able to initiate tumors with only 200–500 cells, whereas EpCAMlowCD44− cells could not form tumors even with 104 cells.Citation7 A single cell of the Lineage−EpCAMhighCD44+ population expressing stemness-associated genes was able to form single-cell-derived xenografts, whereas the Lineage−EpCAMhighCD44− population contained mostly DTCs that were unable to form a tumor with up to 500 cells.Citation12 Transcriptional analysis has shown the differences between EpCAMhighCD44+ CSCs and EpCAMhighCD44− DTCs in colon cancer.Citation12 Somatic copy number alterations (SCNAs), one feature of the genomic changes,Citation13 have been widely investigated during the tumorigenesis and progression of colorectal cancer.Citation14 However, it is unknown whether CSCs differ from DTCs in genomic features.
Because traditional sequencing techniques can only obtain average scenarios of tissue mixtures, the subtle variations of single cells and the unique features of rare populations may be missed. In heterogeneous tumors containing millions of diverse cells, these details could play important roles during tumor progression. In order to discriminate the heterogeneous cancer cell population,Citation15 we used the single-cell technique to compare CSCs and DTCs at high resolution. Single-cell sequencing is expected to shed light on cell-to-cell heterogeneity and obtain more comprehensive genomic scenarios of colon tumors.
In this study, we applied fluorescence-activated cell sorting (FACS) to isolate the CD45−EpCAMhighCD44+ and CD45−EpCAMhighCD44− populations from two primary colon tumors, on which low-coverage single-cell whole-genome sequencing was then performed. We compared the SCNA profiles of the CSCs and DTCs at single-cell resolution. It turned out that the SCNA profiles were shared by CSCs and DTCs in the same patient, confirming that such alterations were early events during tumorigenesis. Our statistical analyses also suggest that the genomes of CSCs with higher correlation coefficients are more stable than those of DTCs in certain patient.
Results
Isolation and MALBAC amplification of single CSC and DTC
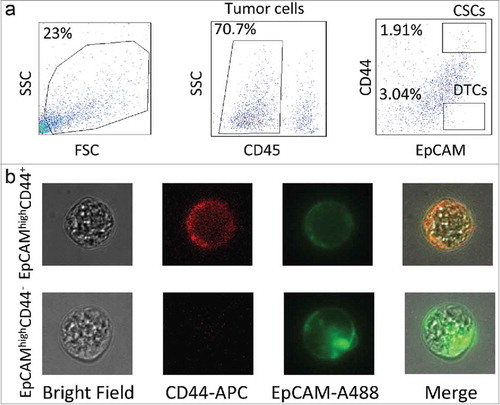
The clinicopathological features of the two patients are listed in . The tumors from both patients were adenocarcinomas of the ascending colon, with moderate differentiation. Single cells of the CD45−EpCAMhighCD44+ (CSC population) and the CD45−EpCAMhighCD44− (DTC population) phenotypes were isolated by FACS (). After the cells were checked for fluorescence signals under microscopy, they were extracted (by mouth pipetting) (), each cell was amplified by multiple annealing and looping based amplification cycles (MALBAC).Citation16 After the amplification, a qPCR quality test was carried out according to a previously described method.Citation17 In total, eleven CSCs and nine DTCs of patent 1 (P1) and thirteen CSCs and fourteen DTCs of patient 2 (P2) passed this filter.
Table 1. Clinicopathological characteristics of the colon cancer patients.
Figure 1. Experimental design. (a) Gating strategy of cancer stem cell (CSC) and differentiated tumor cell (DTC) isolation by FACS. Tumor cells were separated on the basis of the CD45− phenotype, and tumor-infiltrating lymphocytes were eliminated. CSCs were identified as CD45−EpCAMhighCD44+, whereas DTCs were CD45−EpCAMhighCD44−. (b) Fluorescence signals of CSCs and DTCs under confocal microscopy.
Multiple bioinformatic methods verified the qualification of single-cell data
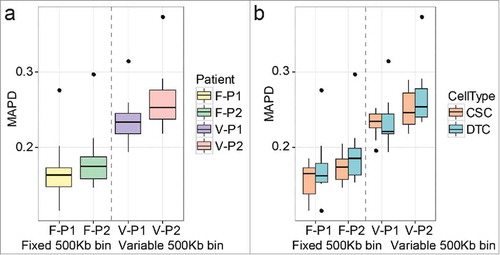
Median of the absolute values of all pairwise differences (MAPD) analysis was applied to check the quality of the single-cell genomic sequencing data,Citation18 where the MAPD score reveals whether the data are qualified for SCNA analysis. The MAPD scores of the fixed bin method (mean ± SD: 0.17 ± 0.032) were lower than those of the variable bin method (mean ± SD: 0.25 ± 0.032, and ), meaning that the fixed bin method was better at removing the noise with our established control. For P1 and P2, the MAPD scores inferred by the fixed bin method were 0.17 ± 0.003 and 0.18 ± 0.030, respectively, whereas the scores inferred by the variable bin method were 0.23 ± 0.030 and 0.26 ± 0.031, respectively (). In each method, the MAPD scores of CSCs and DTCs from the same patient were similar (two-tailed Mann-Whitney U test, p > 0.05, ). Although one DTC (P2T4) had a higher score (fixed bin method, 0.37; variable bin method, 0.30), it still conformed to the previous standard.Citation19 Therefore, the data of 47 single cells were qualified for the subsequent single-cell analyses.
Figure 2. The median of the absolute values of all pairwise differences (MAPD) scores of single-cell libraries in each patient. (a) Comparison between the fixed and variable bin methods. (b) Comparisons between cancer stem cells (CSCs) and differentiated tumor cells (DTCs) in each method. F: fixed bin method; V: variable bin method.
Patient specificity and interpatient heterogeneity shown by SCNAs of the CSCs and DTCs
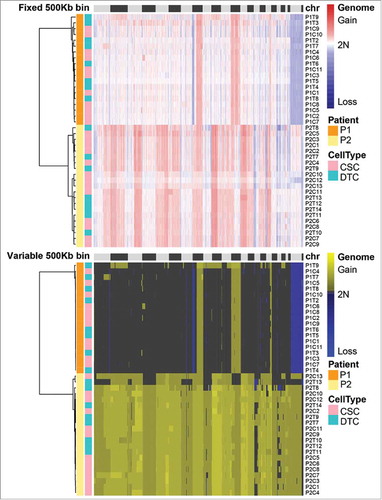
The single-cell SCNA profiles showed that there were obvious SCNAs in both the CSCs and DTCs of each patient (). Seven DTCs (P1T1, P2T1–T6) were considered to be diploid cells and were removed from the subsequent comparisons of CSCs and DTCs. The frequent copy number gains previously observed in chr8 in colorectal cancerCitation20,Citation14 were found in both P1 and P2, whereas frequent gains in chr20 and chr10Citation14 were observed only in P2. In P1, there were copy number gains in chr8q, chr12, and chr17q, as well as losses in chr8p. In P2, copy number gains in chr2p, chr3q, chr5, chr6, chr10p, chr8, chr13, chr17q, and chrX, and losses in chr17p were observed. We also observed that each patient had a specific SCNA pattern, suggesting individual differences among colon cancer patients. The number of chromosomes containing SCNAs in P1 was less than that in P2, implying interpatient heterogeneity in colon cancer.
Figure 3. Somatic copy number alteration (SCNA) profiles of cancer stem cells (CSCs) and differentiated tumor cells (DTCs) analyzed by two methods. Single cells from the same patient clustered in the same group. The SCNA profiles of the two populations within one tumor were highly similar. The clusters were based on the Euclidean distance and ward.D method.
SCNA profiles of CSCs and DTCs in the same patient
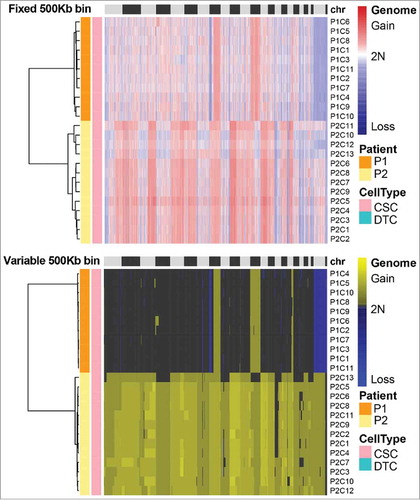
The hierarchical clustering heatmap showed that the SCNA profiles of CSCs and DTCs from the same patient were mixed together, suggesting that the profiles were similar (). Such shared SCNA profiles of CSCs and DTCs in one patient, which support observations in oligodendroglioma that hierarchical lineage exists in each SCNA-based subclone,Citation4 imply that major SCNAs occurred at an early stage and were inherited steadily during tumorigenesis.
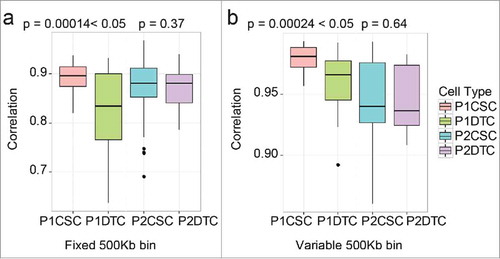
To compare the SCNAs in CSCs and DTCs more accurately, we performed a correlation analysis. To compare the CSC and DTC populations within one patient, we summarized the correlation coefficients (Pearson coefficient) of each cell population and performed a two-tailed Mann-Whitney U test on the data. The quality control of MAPD ensured that these results did not arise from single-cell amplification noise. As shown in , the correlation coefficients of the CSC population and DTC population of P1 were significantly different (p < 0.05), whereas those of P2 were similar (p > 0.05). These results indicate that CSCs in certain patients might be more stable, with high similarity among one another; in other words, DTCs were more heterogeneous than CSCs.
Figure 4. Comparison of the cancer stem cell (CSC) and differentiated tumor cell (DTC) populations from each patient. The correlation values of each population are shown in the boxplot diagram. The p-value was calculated according to a two-tailed Mann-Whitney U test. (a) Fixed bin method; (b) variable bin method.
Regional differences revealed by single-cell sequencing
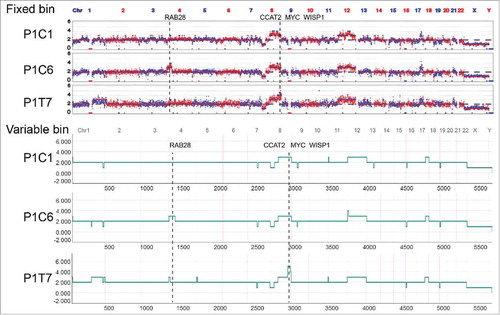
Single-cell sequencing showed that there were regional differences in the CSCs and DTCs (). In single cells, copy number changes will lead to corresponding changes of gene expression in terms of transcripts.Citation21 In the genome of P1, regional amplifications of chr4p16.2-4p14 and chr8q24.1-q24.3 were observed in one CSC (P1C6) and one DTC (P1T7), respectively (). In chr4p16.2-4p14, RAB28 (a member of the RAS oncogene family) can affect cell metabolism and growth.Citation22 In chr8q24.1-q24.3, MYC and WISP1 can promote cell proliferationCitation23 and contribute to tumorigenesis.Citation24 In addition, CCAT2 can upregulate the expression of MYC, which is related to metastasis and chromosomal instability in colon cancer.Citation25 In summary, the regional differences in copy number might give rise to different growth advantages at a later stage because of the affected expression of cancer-associated genes.
Figure 5. Regional differences of somatic copy number alterations (SCNAs) analyzed by two methods in patient 1 (P1). Amplification of chr4p16.2-4p14 containing the cancer-associated gene RAB28. Amplification of chr8q24.1-q24.3 containing the cancer-associated genes MYC, CCAT2, and WISP1.
Reproducible SCNA patterns among single CSCs of the same patient
Previous transcriptional analysis of colorectal CSCs bearing the surface markers EpCAM and CD44 had revealed that they are a heterogeneous population, containing multiple cell types.Citation12 We therefore wondered whether the SCNA patterns of transcriptionally heterogeneous EpCAMhighCD44+ cells differ. As shown in , hierarchical clustering analysis showed that the CSCs from each patient had a unique SCNA pattern. However, the gains and losses of SCNAs of individual CSCs within the same patient were highly reproducible. Such reproducible global SCNA patterns might be hidden in bulk-sequencing analyses of tumors and only made visible by the high accuracy afforded by MALBAC. The reproducible SCNA patterns might stem from the possibility that the CSCs originated from one clone in the tumor or were due to the CSC selection criterion.
Figure 6. Somatic copy number alteration (SCNA) profiles of cancer stem cells (CSCs) analyzed by two methods. CSCs from the same patient clustered in the same group. The SCNA profiles of the CSCs within one tumor were highly reproducible. The clusters were based on the Euclidean distance and ward.D method.
SCNA profiles revealed by single-cell sequencing and micro bulk sequencing
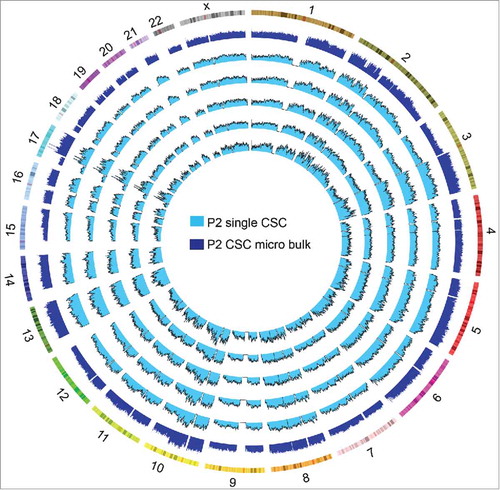
We also sequenced the micro bulk of the CSC population in P2 (nanogram units of gDNA extracted from <500 single cells). The gDNA of the micro bulk was also amplified by MALBAC. The SCNA profiles of the single CSCs and the micro bulk were similar, although the micro bulk had less technical noise (). Therefore, to detect the pervasive SCNA profiles of any one tumor, several cells or a single biopsy might be enough, whereas single-cell differences can only be detected by the single-cell technique.
Figure 7. SCNA profiles of the cancer stem cells (CSCs) and the micro bulk in patient 2 (P2).
Discussion
In this study, we analyzed the SCNA profiles of putative CSCs and DTCs at single-cell resolution with low-coverage whole-genome sequencing. The SCNA profiles of the CSCs and DTCs were similar, and the two populations were not distinguishable from each other on the basis of SCNAs only. We found that the DTC population was more heterogeneous than the CSC population in P1, but not in P2, suggesting that CSCs might be more stable, with high similarity among one another, than DTCs in certain patients. In addition to this, the regional differences of SCNAs related to cancer-associated genes at the single-cell level can only be shown by single-cell sequencing.
Our finding of the similar SCNA profiles of CSCs and DTCs supports the results observed in oligodendrogliomas, in which hierarchical lineage exists in each SCNA-based subclone.Citation4 Accordingly, we speculate that major SCNAs occur at an early stage before tumor expansion, and are inherited steadily in colon cancer, just like in previous studies of breast cancer.Citation26,Citation27 The “Big Bang” model for colorectal cancerCitation28 and neutral evolutionCitation29 demonstrate that clonal mutational diversification appeared at an early stage and was inherited during tumor expansion. These viewpoints were concordant with our results, suggesting that clonal mutations and clonal SCNAs occurred at an early stage of tumorigenesis, and subsequent selective sweeps might have increased the heterogeneity but could not substitute the established inherent characteristics.
Moreover, we found that the CSCs had higher similarity among one another than did the DTCs in P1, which confirmed that our hypothesis of CSCs being more stable than DTCs was an objective fact, although not true for every patient. In the CSC model, the CSCs undergo half-reserved proliferation, dividing into one committed progenitor and one daughter CSC.Citation3 A previous report showed that major mutations are shared by CSCs and DTCs in breast cancer owing to the dynamic transitions and the plasticity between CSCs and tumor cells.Citation30 We found that the SCNA profiles were stably inherited in the tumor mass, and were similar between CSCs and DTCs in colon cancer, which might arise from lineage differentiation as well.
Our data showed that EpCAMhighCD44+ cells from the same patient had highly reproducible SCNA profiles. However, transcriptional analysis of this population by Dalerba et al identified three subpopulations of cells; namely, a subpopulation expressing genes linked to goblet cells (MUC2+, TFF3high, SPDEF+, and SPINK4+), a subpopulation coexpressing genes associated with immature cells and genes expressed by enterocytes (OLFM4+ and CA2high), and a subpopulation expressing genes involved in stemness in the mouse small intestine (LGR5+, ASCL2+, PTPRO+, and RGMB+).Citation12 The discordant SCNAs and transcripts suggest that the copy number change might occur earlier than massive gene alteration during tumor development, and the gain and loss of copy numbers at certain chromosome regions are probably selected for cancer cell survival in the colon during tumorigenesis. The individually unique SCNA patterns could be due to individual subject-specific requirements for successful tumorigenesis.
Punctuated evolution was first demonstrated in breast cancer,Citation26,Citation27 and our findings in colon cancer were also compatible with this viewpoint. The intermediate SCNA patterns were not found within each cell population or between CSCs and DTCs, which illustrates punctuated evolution rather than gradual evolution. Colon tumors differ from other solid tumors because crypts metabolize dynamically, and colon CSCs are in dynamic convergence.Citation31 For instance, although P1T9 and P2T8 still inherited the pervasive copy number patterns, they also had unique SCNAs, which implied that they had formed later. Moreover, the microenvironment of the niches affects the CSCs and interacts with diverse factors that lead to more unpredictability.
Furthermore, single-cell sequencing revealed regional differences that might be hidden in traditional bulk sequencing, and several single cells or a single biopsy should be enough for detecting pervasive SCNAs. Because the quantity of CSCs within one tumor is quite rare, single-cell sequencing is an appropriate approach for sophisticated CSC studies.
In summary, the SCNAs were similar in putative CSCs and DTCs in colon cancer patients, since SCNAs are early events that occur during colon tumorigenesis. The similarity of ubiquitous SCNAs between the CSCs and DTCs might have arisen from lineage differentiation. Reproducible SCNAs in CSCs indicate alterations in certain chromosomes are required for tumorigenesis. Our results are also compatible with punctuated evolution in colon cancer.
Materials and methods
Sample collection and preparation
This study was approved by the Research Ethics Committee of Peking University Cancer Hospital & Institute, Beijing, China (No. 2014KT98), and patient consents were obtained. Primary colon tumors of two patients were collected immediately after surgery. The tumor tissues were washed and then minced into small pieces with sterile blades. The tumor pieces were dissociated by incubation for 1 h at 37°C in DMEM containing collagenase type IA (50 μg/mL, Sigma), hyaluronidase (20 μg/uL, Sigma), and antibiotics–antimyotics. After digestion, the suspensions were filtered through a 70-μm cell strainer (BD Falcon) and erythrocytes were removed by using NH4Cl–EDTA. The single-cell suspensions were then cryopreserved in liquid nitrogen.
Single-cell isolation
To isolate single tumor cells from the single-cell suspensions, the cryopreserved cells were thawed and stained with the following reagent combinations: anti-EpCAM Alexa Fluor 488 (eBioscience), anti-CD44-APC (BD Pharmingen), and anti-CD45-PE (BD Pharmingen). After incubation for 30 min at 4°C, followed by washing, the cells were sorted into CD45−EpCAMhighCD44+ and CD45−EpCAMhighCD44− populations using the BD FACS Aria III cell sorter (BD Biosciences). Individual tumor cells were verified under a fluorescence microscope (Nikon Eclipse Ti) and isolated manually by micropipetting. The single cells were then lysed and immediately stored at −80°C.
Whole-genome library preparation and sequencing
The single-cell genomes were amplified by MALBAC.Citation16 The cells that passed quantitative PCR (qPCR) quality controlCitation17 were used for next-generation sequencing. For each cell, 500 ng of DNA from the single-cell MALBAC product was sheared into ∼300-bp fragments by the Covaris system (Covaris), and the indexed libraries were prepared with the NEBNext Ultra DNA Library Prep Kit for Illumina (New England Biolabs). Then, the libraries were sequenced with Illumina MiSeq 2 × 75-bp paired-end reads and HiSeq 2 × 150-bp paired-end reads at a ∼0.1 × depth.
Single-cell SCNA profiling
The single-cell SCNA profiles were inferred using two methods to ensure accuracy. One method with fixed 500-Kb bins was developed by our laboratory,Citation16,Citation17 and the other method used was Ginkgo, an open-source web platform based on circular binary segmentation algorithm with variable 500-Kb bins.Citation32 The raw data in fastq format have been deposited to the NCBI Sequence Read Archive under the SRA study accession number SRP106932. The raw reads were aligned to the human reference genome (hg19, UCSC) by using the Burrows-Wheeler AlignerCitation33 to generate bam files. In the fixed bin method, the bam files were then sorted and merged with SAMtools 0.1.19.Citation34 The genome was sorted into ∼500-Kb bins, and the depth of each bin was inferred by the hidden Markov model normalized with the method control.Citation17 In the variable bin method, the bam files were converted into bed files by using bedtools.Citation35 The bed files were then analyzed by Ginkgo. Segmentation was performed with the global method (sample with the lowest index of dispersion) to normalize the bin counts and eliminate biases.
Analyses of single-cell genome data
We applied MAPD to assess the quality of the single-cell data based on previously reported method described in reference.Citation18 The clustered heatmap of the SCNA profiles was visualized by using the pheatmap package with the Euclidean distance and ward.D method. The correlation analysis was performed with the R stats package. In each patient, the Pearson correlation coefficients between CSCs in CSC population were calculated, so as DTCs in DTC population. Then two sets of coefficients were collected separately from the CSC and DTC populations in each patient. Then the affinity within CSCs and DTCs was compared using single-cell SCNA data from the two methods, fixed 500-Kb bins and Ginkgo.
Compliance with ethical standards
Ethical approval : This study was approved by the Research Ethics Committee of Peking University Cancer Hospital & Institute, Beijing, China (No. 2014KT98). All procedures performed in studies involving human participants were in accordance with the ethical standards of the institutional research committee and with the 1964 Helsinki declaration and its later amendments or comparable ethical standards.
Disclosure of potential conflicts of interest
No potential conflicts of interest were disclosed.
Informed consent
Informed consent was obtained from all individual participants included in the study.
Acknowledgments
We thank Mr. Zhonglin Fu and Ms. Xuefang Zhang from the National Center for Protein Sciences Beijing (Peking University) for assistance with FACS; Ms. Yu Hou from BIOPIC in Peking University for academic assistance, and Dr. Ying Hu, Yixue Wang, Lijie Song and Meng Chen from the Department of Biobank, Peking University Cancer Hospital & Institute for collecting specimens.
Additional information
Funding
References
- Torre LA, Bray F, Siegel RL, Ferlay J, Lortet-Tieulent J, Jemal A. Global cancer statistics, 2012. CA: a cancer journal for clinicians. 2015;65(2):87–108. doi:10.3322/caac.21262. PMID:25651787.
- Nguyen LV, Vanner R, Dirks P, Eaves CJ. Cancer stem cells: an evolving concept. Nat Rev Cancer. 2012;12(2):133–43. doi:10.1038/nrc3184. PMID:22237392.
- Beck B, Blanpain C. Unravelling cancer stem cell potential. Nat Rev Cancer. 2013;13(10):727–38. doi:10.1038/nrc3597. PMID:24060864.
- Tirosh I, Venteicher AS, Hebert C, Escalante LE, Patel AP, Yizhak K, Fisher JM, Rodman C, Mount C, Filbin MG, et al. Single-cell RNA-seq supports a developmental hierarchy in human oligodendroglioma. Nature. 2016;539(7628):309–13. doi:10.1038/nature20123. http://www.nature.com/nature/journal/v539/n7628/abs/nature20123.html#supplementary-information.
- Ye X, Tam WL, Shibue T, Kaygusuz Y, Reinhardt F, Ng Eaton E, Weinberg RA. Distinct EMT programs control normal mammary stem cells and tumour-initiating cells. Nature. 2015;525(7568):256–60. doi:10.1038/nature14897. http://www.nature.com/nature/journal/v525/n7568/abs/nature14897.html#supplementary-information.
- Pattabiraman DR, Bierie B, Kober KI, Thiru P, Krall JA, Zill C, Reinhardt F, Tam WL, Weinberg RA. Activation of PKA leads to mesenchymal-to-epithelial transition and loss of tumor-initiating ability. Science (New York, NY). 2016;351(6277): aad3680. doi:10.1126/science.aad3680.
- Dalerba P, Dylla SJ, Park IK, Liu R, Wang X, Cho RW, Hoey T, Gurney A, Huang EH, Simeone DM, et al. Phenotypic characterization of human colorectal cancer stem cells. Proc Natl Acad Sci U S A. 2007;104(24):10158–63. doi:10.1073/pnas.0703478104. PMID:17548814.
- Went PT, Lugli A, Meier S, Bundi M, Mirlacher M, Sauter G, Dirnhofer S. Frequent EpCam protein expression in human carcinomas. Human pathology. 2004;35(1):122–8 PMID:14745734.
- Du L, Wang H, He L, Zhang J, Ni B, Wang X, Jin H, Cahuzac N, Mehrpour M, Lu Y, Chen Q. CD44 is of functional importance for colorectal cancer stem cells. Clin Cancer Res: an official journal of the American Association for Cancer Research. 2008;14(21):6751–60. doi:10.1158/1078-0432.ccr-08-1034. PMID:18980968.
- Carpentino JE, Hynes MJ, Appelman HD, Zheng T, Steindler DA, Scott EW, Huang EH. Aldehyde dehydrogenase-expressing colon stem cells contribute to tumorigenesis in the transition from colitis to cancer. Cancer Res. 2009;69(20):8208–15. doi:10.1158/0008-5472.CAN-09-1132. PMID:19808966.
- Kemper K, Prasetyanti PR, De Lau W, Rodermond H, Clevers H, Medema JP. Monoclonal antibodies against Lgr5 identify human colorectal cancer stem cells. Stem cells (Dayton, Ohio). 2012;30(11):2378–86. doi:10.1002/stem.1233. PMID:22969042.
- Dalerba P, Kalisky T, Sahoo D, Rajendran PS, Rothenberg ME, Leyrat AA, Sim S, Okamoto J, Johnston DM, Qian D, et al. Single-cell dissection of transcriptional heterogeneity in human colon tumors. Nat Biotech. 2011;29(12):1120–7. http://www.nature.com/nbt/journal/v29/n12/abs/nbt.2038.html#supplementary-information doi:10.1038/nbt.2038.
- Redon R, Ishikawa S, Fitch KR, Feuk L, Perry GH, Andrews TD, Fiegler H, Shapero MH, Carson AR, Chen W, et al. Global variation in copy number in the human genome. Nature. 2006;444(7118):444–54. doi:10.1038/nature05329. PMID:17122850.
- Wang H, Liang L, Fang JY, Xu J. Somatic gene copy number alterations in colorectal cancer: new quest for cancer drivers and biomarkers. Oncogene. 2016;35(16):2011–9. doi:10.1038/onc.2015.304. PMID:26257062.
- McGranahan N, Swanton C. Clonal Heterogeneity and Tumor Evolution: Past, Present, and the Future. Cell. 2017;168(4):613–28. doi:10.1016/j.cell.2017.01.018. PMID:28187284.
- Zong C, Lu S, Chapman AR, Xie XS. Genome-wide detection of single-nucleotide and copy-number variations of a single human cell. Science (New York, NY). 2012;338(6114):1622–6. doi:10.1126/science.1229164.
- Ni X, Zhuo M, Su Z, Duan J, Gao Y, Wang Z, Zong C, Bai H, Chapman AR, Zhao J, et al. Reproducible copy number variation patterns among single circulating tumor cells of lung cancer patients. Proc Natl Acad Sci U S A. 2013;110(52):21083–8. doi:10.1073/pnas.1320659110. PMID:24324171.
- Cai X, Evrony Gilad D, Lehmann Hillel S, Elhosary Princess C, Mehta Bhaven K, Poduri A, Walsh Christopher A. Single-Cell, Genome-wide Sequencing Identifies Clonal Somatic Copy-Number Variation in the Human Brain. Cell Rep. 2014;8(5):1280–9. doi:10.1016/j.celrep.2014.07.043. PMID:25159146.
- Ning L, Li Z, Wang G, Hu W, Hou Q, Tong Y, Zhang M, Chen Y, Qin L, Chen X, Man H-Y, Liu P, He J. Quantitative assessment of single-cell whole genome amplification methods for detecting copy number variation using hippocampal neurons. Scientific Rep. 2015;5:11415. http://www.nature.com/articles/srep11415#supplementary-information doi:10.1038/srep11415. PMID:26091148.
- Xie T, Cho YB, Wang K, Huang D, Hong HK, Choi YL, Ko YH, Nam DH, Jin J, Yang H, et al. Patterns of somatic alterations between matched primary and metastatic colorectal tumors characterized by whole-genome sequencing. Genomics. 2014;104(4):234–41. doi:10.1016/j.ygeno.2014.07.012. PMID:25066378.
- Macaulay IC, Haerty W, Kumar P, Li YI, Hu TX, Teng MJ, Goolam M, Saurat N, Coupland P, Shirley LM, et al. G&T-seq: parallel sequencing of single-cell genomes and transcriptomes. Nature methods. 2015;12(6):519–22. doi:10.1038/nmeth.3370. PMID:25915121.
- Brauers A, Schurmann A, Massmann S, Muhl-Zurbes P, Becker W, Kainulainen H, Lie C, Joost HG. Alternative mRNA splicing of the novel GTPase Rab28 generates isoforms with different C-termini. European journal of biochemistry. 1996;237(3):833–40 doi:10.1111/j.1432-1033.1996.0833p.x. PMID:8647132.
- Lee TC, Li L, Philipson L, Ziff EB. Myc represses transcription of the growth arrest gene gas1. Proc Natl Acad Sci U S A. 1997;94(24):12886–91 doi:10.1073/pnas.94.24.12886. PMID:9371770.
- Xu L, Corcoran RB, Welsh JW, Pennica D, Levine AJ. WISP-1 is a Wnt-1- and beta-catenin-responsive oncogene. Genes & development. 2000;14(5):585–95.
- Ling H, Spizzo R, Atlasi Y, Nicoloso M, Shimizu M, Redis RS, Nishida N, Gafa R, Song J, Guo Z, et al. CCAT2, a novel noncoding RNA mapping to 8q24, underlies metastatic progression and chromosomal instability in colon cancer. Genome Research. 2013;23(9):1446–61. doi:10.1101/gr.152942.112. PMID:23796952.
- Wang Y, Waters J, Leung ML, Unruh A, Roh W, Shi X, Chen K, Scheet P, Vattathil S, Liang H, et al. Clonal evolution in breast cancer revealed by single nucleus genome sequencing. Nature. 2014;512(7513):155–60. doi:10.1038/nature13600. PMID:25079324.
- Gao R, Davis A, McDonald TO, Sei E, Shi X, Wang Y, Tsai PC, Casasent A, Waters J, et al. Punctuated copy number evolution and clonal stasis in triple-negative breast cancer. Nature genetics. 2016;48(10):1119–30. doi:10.1038/ng.3641. PMID:27526321.
- Sottoriva A, Kang H, Ma Z, Graham TA. A Big Bang model of human colorectal tumor growth. Nature Genet. 2015;47(3):209–16. doi:10.1038/ng.3214.
- Williams MJ, Werner B, Barnes CP, Graham TA. Identification of neutral tumor evolution across cancer types. Nature Genet. 2016;48(3):238–44. doi:10.1038/ng.3489.
- Klevebring D, Rosin G, Ma R, Lindberg J, Czene K, Kere J, Fredriksson I, Bergh J, Hartman J. Sequencing of breast cancer stem cell populations indicates a dynamic conversion between differentiation states in vivo. Breast Cancer Research. 2014;16(4):R72. doi:10.1186/bcr3687. PMID:24998755.
- Zeuner A, Todaro M, Stassi G, De Maria R. Colorectal Cancer Stem Cells: From the Crypt to the Clinic. Cell Stem Cell. 2014;15(6):692–705. doi:10.1016/j.stem.2014.11.012. PMID:25479747.
- Garvin T, Aboukhalil R, Kendall J, Baslan T, Atwal GS, Hicks J, Wigler M, Schatz MC. Interactive analysis and assessment of single-cell copy-number variations. Nature methods. 2015;12(11):1058–60. doi:10.1038/nmeth.3578.
- Li H, Durbin R. Fast and accurate short read alignment with Burrows-Wheeler transform. Bioinformatics (Oxford, England). 2009;25(14):1754–60. doi:10.1093/bioinformatics/btp324.
- Li H, Handsaker B, Wysoker A, Fennell T, Ruan J, Homer N, Marth G, Abecasis G, Durbin R. The Sequence Alignment/Map format and SAMtools. Bioinformatics (Oxford, England). 2009;25(16):2078–9. doi:10.1093/bioinformatics/btp352.
- Quinlan AR, Hall IM. BEDTools: a flexible suite of utilities for comparing genomic features. Bioinformatics (Oxford, England). 2010;26(6):841–2. doi:10.1093/bioinformatics/btq033.