
Abstract
Objectives: The study was designed to investigate the tumor vessel-associated CD105 expression in monocytes from tumor tissue and peripheral blood (PB) in patients with advanced hepatocellular carcinoma (HCC), in order to provide support and reference for clinical pharmaceutical therapy. Methods: A total of 50 patients with advanced HCC who were administered with sunitinib were collected. Immunohistochemistry (IHC) was utilized to assess the CD105 expression in tumor tissue, and real-time quantitative PCR (qPCR) was used to determine the mRNA expression of CD105 of monocytes in tumor tissue and PB, as well as the mRNA expression of TGFβ1, Smad1-4 in tumor tissue. Afterwards, enzyme-linked immunosorbent assay (ELISA) was performed to determine the expression level of TGFβ1 and Smad1-4 in tumor tissues. Moreover, the correlation of CD105 expression with clinicopathological characteristics, overall survival (OS) and progression-free survival (PFS) was analyzed. Results: The Cd105 expression was detected both in tumor tissue and PB, and there was a correlation between them (r = 0.7791, P < 0.001). The OS and PSF were significantly increased in patients with lower expression of CD105 in tumor tissue compared to those with higher expression (10.9 vs 4.5, P < 0.001, 8.3 vs 6.15, P < 0.001). Consistently, the OS and PSF were significantly elevated in patients with lower expression of CD105 in PB than those with higher expression (10.3 vs 5.0, P < 0.001, 8.5 vs 6.3, P < 0.001). The OS and PSF were significantly enhanced in patients with lower expression of CD105 in both tumor tissue and PB compared to those with higher expression of CD105 in both tumor tissue and PB (12.4 vs 8.5, P < 0.001, 8.5 vs 6.5, P < 0.001). Both protein and mRNA expression of TGFβ1, Smad1, Smad2 and Smad4 in patients with high CD105 expression in tumor tissue were significantly higher than those with low CD105 expression (P < 0.001), while the protein and mRNA expression of Smad3 in patients with high CD105 expression in tumor tissue were significantly lower compared to those with low CD105 expression (P < 0.001). In analysis of correlation with tumor stage, both protein and mRNA expression of TGFβ1, Smad1, Smad2 and Smad4 in patients with stage III HCC were significantly lower than those with stage IV HCC (P < 0.001), while the protein and mRNA expression of Smad3 in patients with IV stage HCC was significantly higher in comparison to those with stage IV HCC (P < 0.001). Cox regression analysis indicated that CD105 expression in tumor tissue and PB was an independent predictive factor for the OS and PFS of advanced HCC patients who received sunitinib. Conclusions: Advanced HCC patients with lower CD105 expression in tumor tissue and PB benefited more from sunitinib administration. Moreover, CD105 expression was an independent prognostic indicator for sunitinib administration in advanced HCC, which could be used as a predictive approach for sunitinib efficacy in clinical practice.
Hepatocellular carcinoma (HCC) is a type of rather malignant tumor. Only 10–30% of patients with primary HCC can receive surgical resection in the clinic [Citation1]. For patients who cannot be surgically treated, comprehensive treatment, such as TACE, radiofrequency ablation and cryotherapy is generally performed. The currently used gemcitabine, fluorouracil and etc. can achieve certain effect in HCC patients, which, however, lead to great toxicity and a lack of duplication of efficacy [Citation2-3]. Patients with advanced HCC harbor poor prognosis and high mortality rate in a short period due to rapid tumor progression. As the tumor progresses and the frequency of chemotherapeutic drugs increases, the emergence of drug resistance may result in poor efficacy of chemotherapy. Therefore, the application of tyrosine kinase inhibitors (TKIs) for advanced HCC is one of the effective approahes.
Sunitinib is a multi-targeted RTK inhibitor, which is structurally modified based on SU5416 (an elective inhibitor of vascular endothelial growth factor receptor, VEGFR) and SU6668 (a selective inhibitor of platelet derived growth factor receptor, PDGFR). The current inhibitory targets of sunitinib mainly include PDGFR, VEGFR, C-Kit, FLT3 and etc., and the numerous targets have contributed to the various mechanisms of action [Citation4]. Therefore, a number of clinical trials have proved that its single use or combined with chemotherapy can prolong the survival of patients with advanced cancer and improve their prognosis. Sunitinib is also a good tumor vessel inhibitor, which can inhibit the formation of tumor blood vessels to control tumor growth [Citation5]. CD105 is one of the tumor angiogenesis markers, which can be used as an indicator of endothelial cell proliferation status. Moreover, CD105 has been found as a prognostic marker of breast cancer in clinical studies [Citation6]. Precisely because CD105 is one of the important indicators of tumor angiogenesis, and sunitinib is an inhibitor of tumor angiogenesis, there is a certain mechanism between the two, and the expression level of CD105 may affect the clinical prognosis of HCC patients treated by sunitinib. Hence, this study was mainly designed to investigate the CD105 expression in HCC tissue and PB with the prognosis of sunitinib treatment, providing reference for clinical treatment of advanced HCC.
Materials and methods
1. Origins of cases
A total of 50 patients with advanced HCC (TNM stage III and IV) were enrolled in this study. None of the patients underwent any anti-tumor therapy (including chemotherapy, radiotherapy and biotherapy). All of the patients were confirmed with HCC after physical examinations, laboratory examinations andimageological examinations. Neither surgery or local treatment could be conducted on these patients. Biopsy obtained tumor tissue was pathologically diagnosed with TNM stage III and IV according to the Union for International Cancer Control (UICC) and American Joint Committee on Cancer (AJCC) TNM staging version 7. Among the 50 patients, there were 27 males and 23 females. ECOG score was 0–2 before treatment, Barcelona stage was B or C, Child-pugh liver function was A or B.
Fifty patients received sunitinib monotherapy. Specifically, sunitinib was administered at a dose of 37.5mg once daily, which was continuous taken for four weeks as a cycle. In the case of drug-associated dose-limiting side effects, treatment could be reduced or discontinued based on patient tolerance until the progression or death occurred. The dose reduction was based on the type and severity of adverse reaction, with a dose reduction of 12.5 mg at the gradient dose level.
One dose level could be reduced in the case of two consecutive adverse reactions of grade 3. While sunitinib administration was ceased in the case of adverse effect of grade 4, who was given a reduced dose after recovery. The minimum dose for all patients was 12.5 mg, with permanent discontinuation in the case of a second unacceptable condition. All patients signed written informed consent form. This study was approved by the Ethics Committee of Second Hospital of Jiaxing City.
2.Immunohistochemistry (IHC)
Paraffin-embedded tumor tissue was sliced into 4μm serial sections. After baking at 60°C for 2h baking slices 2h, dewaxing in xylene for 3 times (5min each), soaking in graded ethanol (absolute ethyl alcohol for 5min; 95% ethanol for twice, 2min each; 85% ethanol for 2min), the sections were washed under tap water for 5min, followed by washing with distilled water for 3min. The slices were then placed in 0.01 mol / L citrate buffer (pH = 6.0) and microwaved at 98°C for 20 min, followed by cooling down at room temperature for 30 min before rinsing with distilled water. The slides were incubated with 3% hydrogen peroxide at room temperature for 10min to eliminate endogenous peroxidase. Each section was blocked with 2% bovine serum albumin (BSA) at 37°C for 30min. After discarding BSA, the sections were incubated with primary anti-CD105 (ab169545, dilution ratio 1: 300, ABR company, USA). Then, the sections were washed with TBS for 3 times (5min each), followed by incubation with proper secondary antibody at 37°C for 15min and subsequent incubation with peroxidase-labeled streptomycin (Maixin biotechnology development company, Fuzhou, China) for 15min. After rinsing in TBS for 3 times (5min each). Each section was reacted with freshly prepared DAB solution color (DAKO, company Denmark), and the reaction was ceased according to microscopic observation. After washing thoroughly with tap water, the sections were counterstained with hematoxylin, and further sealed. TBS was used for negative control of primary antibody. All sections were photographed and quantified under Olympus-BX51 upright microscope with Olympus-DP72 image acquisition system and CRi Nauance multispectral imaging system (Cambridge Research & Instrumentation, USA). Briefly, the areas with the highest expression of tumor neovascularization (CD105) were found at low magnification (100X), followed by selection of the three areas to acquire images in the high power field (200X). The mean number of tumor neovascularization was calculated and used as the number of tumor neovascularization indicated by CD105 in HCC tissue.
3.The extraction of total RNA from PB and tumor tissue and real-time quantitative PCR (qPCR)
The pre-treatment PB and tumor tissue were obtained from 50 patients. Specifically, after the patient was fasted for 12 hours, 5 ml of peripheral blood was drawn from the elbow, which was stored in a heparin anticoagulant tube. After dilution with the same volume of PBS at room temperature, lymphocyte separation medium (Histopaque-1077, Sigma, USA) at a volume of half of the mixture was slowly added to the mixture along the tube wall, followed by centrifugation at 3000 rpm for 30 min to obtain peripheral blood mononuclear cells (PBMCs). EZNA Blood RNA Mini Kit (Omega, US) was purchased for RNA extraction from PBMCs. Total RNA was immediately stored at -80 °C after extraction, and cDNA was synthesized within one week, which was further stored at -20 °C. The RNA extraction from tumor tissue was briefly described as follows. A small amount of liquid nitrogen was added into the mortar until the liquid nitrogen volatilized to make the mortar completely cool. Then, appropriate amount of liquid nitrogen was added into the tissue, which was thoroughly grinded. Afterwards, 1 ml of Trizol was added into the powder to completely dissolve the tissue, and the homogenate was subsequently transferred to an EP tube. The RNA was stored at -80 °C after extraction by Invitrogen TRIZOL kit (Invitrogen, US), and cDNA was synthesized within one week and further stored at -20 °C.
RealMasterMix SYBR Green kit was purchased (TIANGEN Beijing, China) for qPCR. β-actin was used as an internal control. The primers used were as follows: CD105 (product length: 396bp), forward: 5’-CGCACCGATCCAGACCACTC-3’, reverse: 5’-CCCGGCTCGATGGTGTTGGA-3’; TGFβ1 (product length: 290bp), forward: 5’-AAACTAAGGCTCGCCACTCC-3’, reverse: 5’-TTGTTGCGGTCCACCATT-3’; Smad1 (product length: 360bp), forward: 5’-ACAGTCTGTGAACCATGGATTTGA-3’, reverse: 5’-TGAGGTGAACCCATTTGAGTAAGAA-3’; Smad2 (product length: 268bp), forward: 5’-CATCAGCCAATGGCAAGTGAA-3’, reverse: 5’-AGAACAGGGTCTGCATCCATCATA-3’; Smad3 (product length: 288bp), forward: 5’-GAACGGGCAGGAGGAGAAAT-3’, reverse: 5’-CCACAGGCGGCAGTAGATGA-3’; Smad4 (product length: 649bp), forward: 5’-CAACACCCGCCAAGTAATC-3’, reverse: 5’-GACCCAAACGTCACCTTCA-3’. β-actin (product length: 216bp), forward: 5’-AAGAGAGGCATCCTCACCCT-3’; reverse: 5’-TACATGGCTGGGGTGTTGAA-3’. The reaction conditions were as follows: reserve transcription at 42°C for 30min, inactivation at 94°C for 5min, 30 cycles of amplification including degeneration at 94°C for 1min, annealing at 60 °C for 1min and extension at 72 °C for 80s. The reaction volume was 50 μl. The reaction conditions were the same for CD105 and β-actin. The relative mRNA expression of CD105 was calculated after normalizing to β-actin
4. Enzyme linked immunosorbent assay (ELISA) was used to determine the protein expression of TGFβ1, Smad1, Smad2 and Smad4 in tumor tissues. Briefly, tumor tissue was resected, ground and homogenized under liquid nitrogen, followed by addition of NP-40 lysis buffer and subsequent lysis at -20˚C for 30 min. After the tissue was completely lysed, without any particulate substance, the lysis was centrifuged at 3000r/min for 30 min in a pre-cooled centrifuge, followed by collection of supernatant. The protein concentration was determined by BCA method, and the absorbance was measured under a microplate reader after adjusting the amount of total protein in each group according to the instructions of the Elisa kit. Finally, the amount of target protein was calculated in each sample.
5.Statistical analysis
SPSS 19.0 software was utilized for statistical analysis. t-test, ANOVA and Mann-Whitney U test were used to compare the measurement data. Kaplan-Merier method was utilized for survival analysis. Log-rank test and Cox regression analysis were used for univariate analysis and multivariate analysis between groups. A P < 0.05 was considered as statistical significance.
Results
1.Basic information of patients
In total, 50 patients were diagnosed with advance HCC in Second Hospital of Jiaxing City from June, 2015 to June, 2017. There were 30, 20 patients diagnosed with stage III and IV, respectively. There were 28 males and 22 females. The median overall survival (OS) was 9.4 months, ranging from 5 to 19.2 months, and the median progression-free survival (PFS) was 7.5 months, ranging from 3.2 to 12.3 months. The basic data of patients were listed in .
Table 1 Basic information of patients.
Table 2 The correlation between CD105 expression and the clinicopathological characteristics of patients (n %).
2.The expression levels of CD105 in PB and tumor tissue and the correlation between them
The mRNA expression of CD105 in tumor tissue was 0.51 (range: 0.12-0.88, mean: 0.51, SD: 0.23), and the mRNA expression of CD105 in PB was 0.40 (range: 0.10-0.88, mean: 0.40, SD: 0.18). The mRNA expression of CD105 in tumor tissue of stage III patients was 0.38 (range: 0.12-0.62, mean: 0.38, SD: 0.12), and the mRNA expression of CD105 in PB of stage III patients was 0.27 (range: 0.10-0.60, mean: 0.27, SD: 0.15). The mRNA expression of CD105 in tumor tissue of stage IV patients was 0.63 (range: 0.38-0.88, mean: 0.63, SD: 0.18), and the mRNA expression of CD105 in PB of stage IV patients was 0.52 (range: 0.40-0.88, mean:0.52, SD: 0.17). The median of mRNA expression of CD105 in tumor tissue and PB was 0.51 and 0.35, respectively. The median was used a cut-off value to divide the patients into CD105-high expression group and CD105-low expression group (N = 25 per group), followed by IHC, which was shown in . The mRNA expression of CD105 in tumor tissue and PB was positively correlated (r = 0.7791, P < 0.0001, 95%CI: 0.0012-0.7973, )
Figure 1 The IHC of CD105 in tumor tissue. (IHC X200. A: Low expression of CD105 in tumor tissue; B: High expression of CD105 in tumor tissue).
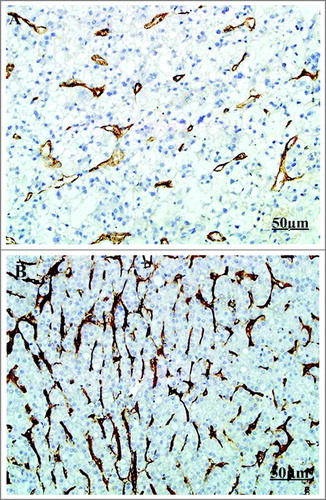
Figure 2 The correlation of CD105 mRNA in tumor tissue and PB.
3.The correlation between CD105 expression and the clinicopathological characteristics of patients
Mann-Whitney U test indicated that the expression level of CD105 was not statistically associated with the clinicopathological characteristics of patients, including age (P = 0.902, 0.354), gender (P = 0.510, 0.250), alcohol drinking (P = 0.811, 0.852), performance status (P = 0.678, 0.782), tumor stage (P = 0.312, 0.682) and hepatocirrhosis (P = 0.522, 0.285). The outcome shown in .
3.The correlation of the mRNA expression of CD105 with OS and PFS
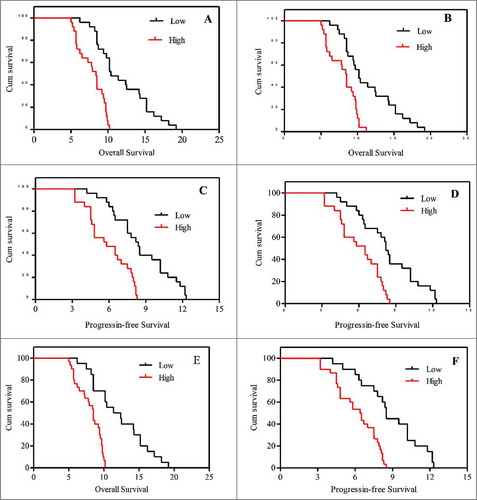
The median OS in patients with low and high mRNA expression of CD105 in tumor tissue was 10.9 and 8.4.5 months, respectively (Log-Rank 23.93, P < 0.001, ). The median OS in in patients with low and high mRNA expression of CD105 in PB was 10.3 and 8.5.0 months (Log-Rank 15.77, P < 0.001, ). The median PFS in patients with low and high mRNA expression of CD105 in tumor tissue was 8.3 and 6.15 months, respectively (Log-Rank 17.91, P < 0.001, ). The median PFS in patients with low and high mRNA expression of CD105 in PB was 8.5 and 6.3 months, respectively (Log-Rank 15.13, P < 0.001, ). The median OS was significantly increased in patients with lower mRNA expression of CD105 in both tumor tissue and PB (12.4 months) compared to that in those with higher mRNA expression of CD105 in both tumor tissue and PB (8.5 months) (Log-Rank 22.18, P < 0.001, ). The median PFS was significantly enhanced in patients with lower mRNA expression of CD105 in both tumor tissue and PB (8.5 months) compared to that in the remaining subjects (6.5 months) (Log-Rank 19.12, P < 0.001, ).
Figure 3 The correlation of CD105 expression with OS and PFS.
4.The correlation between OS and clinicopathological characteristics
The tumor stage and performance status of patients were significantly correlated with OS (Log-rank 5.421, 6.152; P = 0.021, 0.015, respectively). Cos regression analysis indicated that patients with lower expression of CD105 in tumor tissue and PB harbored a significantly prolonged OS (HR: 3.387, 2.274, respectively, both P < 0.05). Moreover, the OS was further prolonged in patients with lower expression of CD105 in both tumor tissue and PB (HR: 8.521, P < 0.001). In addition, the expression of CD105 was an independent prognostic factor for OS of patients treated by sunitinib. The outcomes were show in .
Table 3: The correlation between OS and clinicopathological characteristics.
5.The correlation between PFS and clinicopathological characteristics
The tumor stage and performance status of patients were significantly correlated with PFS (Log-rank 8.120, 4.521, P = 0.021, 0.042, respectively). Cos regression analysis indicated that patients with lower expression of CD105 in tumor tissue and PB harbored a significantly prolonged OS (HR: 3.210、3.852, respectively, both P < 0.05). Moreover, the OS was further prolonged in patients with lower expression of CD105 in both tumor tissue and PB (HR: 8.214, P < 0.001). In addition, the expression of CD105 was an independent prognostic factor for PFS of patients treated by sunitinib. The results were shown .
Table. 4: The correlation between PFS and clinicopathological characteristics.
6.The correlation between CD105 mRNA expression and the mRNA expression of TGFβ1, Smad1-4 in tumor tissue
The mRNA expression of TGFβ1, Smad1, Smad2, Smad3 and Smad4 in tumor tissue was 0.32±0.17, 0.28±0.16, 0.30±0.15, 0.28±0.16, 0.27±0.16, respectively. The expression of the four factors were correlated with CD105 mRNA in tumor tissue. Among them, the expression of TGFβ1, Smad1, Smad2 and Smad4 was positively correlated with CD105 mRNA expression (r = 0.799, 0.833, 0.681 and 0.767, respectively, all P < 0.0001), while Smad3 expression was negatively correlated with CD105 mRNA expression (r = -0.287, P = 0.041). The expression of TGFβ1, Smad1, Smad2 and Smad4 in patients with high mRNA expression of CD105 was significantly higher than those with low mRNA expression of CD105 (all P < 0.0001), while Smad3 expression in patients with high mRNA expression of CD105 was significantly lower compared to those low mRNA expression of CD105 (P<0.0001) (shown in ).
Figure 4 The correlation between CD105 mRNA expression and the mRNA expression of TGFβ1, Smad1-4 in tumor tissue (n = 50). High-CD105 expression group, low-CD105 expression group, * indicated P < 0.05 in comparison between groups.
7.The correlation of the protein expression of TGFβ1 and Smad1-4 with pathological stages and CD105 expression in tumor tissues
The protein expression of TGFβ1, Smad1, Smad2, Smad3 and Smad4 was 12.54±4.52, 8.34±2.54, 7.22±3.57, 5.11±2.16 and 6.34±2.85 pg/ml, respectively, in tumor tissue. The protein expression of TGFβ1, Smad1, Smad2 and Smad4 in patients with stage III HCC was significantly lower than those with stage IV HCC (all P < 0.0001), while Smad3 protein expression in patients with stage III HCC was significantly higher compared to those with patients with stage IV HCC (P < 0.0001). In addition, the protein expression of TGFβ1, Smad1, Smad2 and Smad4 in patients with high mRNA expression of CD105 in tumor tissue was significantly higher compared to those with low mRNA expression of CD105 (all P < 0.0001), while Smad3 expression in patients with high mRNA expression of CD105 in tumor tissue was significantly lower than those with low mRNA expression of CD105 (P < 0.0001) (shown in ).
Figure 5 The correlation of the protein expression of TGFβ1 and Smad1-4 with pathological stages and CD105 expression in tumor tissues (n = 50). *indicated P < 0.05 in comparison between groups.
Discussion
Primary HCC is one of the most common malignant tumors in clinical practice. The national incidence has been increasing year by year, reaching more than 626,000 people per year, ranking fifth in malignant tumors. The cases in high-incidence region of HCC in China account for 55% of global cases. Clinical treatment of HCC involves surgical treatment, radiochemotherapy and Chinese medicine treatment, the effect of which, however, is not satisfactory. In recent years, the profound researches into molecular target therapy for cancer have brought new hope for the clinical treatment of HCC. The main clinical drugs are as follows: (1) anti-epidermal growth factor receptor (EGFR) (cetuximab) [Citation7], (2) antiangiogenic drugs (bevacizumab) [Citation8], (3) inhibitors of signaling transduction (everolimus) [Citation9], (4) multi-target TKIs (sorafenib, sunitinib). In current Chinese market, sunitinib has been listed for the treatment of HCC in clinical practice.
Sunitinib is a multikinase small molecule compound that inhibits tyrosine kinase targets such as VEGFR (VEGFR1-3) and PDGFR. In a phase II, multicenter, European/Asian clinical trial using sunitinib monotherapy in patients with advanced HCC, the median OS was 44 weeks and the TPP was 21 weeks, and over 30% of tumor underwent necrosis according to the RECST criteria, suggesting that sunitinib exerted an anti-HCC efficacy [Citation10]. The second phase II clinical trial [Citation11] demonstrated that in 45 patients with advanced HCC who were treated with 37.5mg/D sunitinib, 15 patients were still alive without significant progression after 12 weeks, and the median TPP was 3.2 months, median OS was 9.3 months. In consistent with the above two studies, the median OS was 9.4 months (range: 5.0-19.2 months) and the median PFS was 7.5 months (range: 3.2-12.3 months) in this study, which suggested the consistency of therapeutic efficacy of sunitinib in treating HCC. However, in previous studies, we found that the effect of sunitinib on the prognosis of patients with HCC was quite different, and there are no relevant indexes for the prediction of their efficacy in the literature yet. CD105 is a glycoprotein specifically expressed in the neovascular endothelium. The interaction of CD105 and TGF-β is involved in the development of tumor blood vessels and is closely related to tumor metastasis and invasion [Citation12]. In the study of tumor diagnosis and prognosis, it has been found that the proliferative capacity of endothelial cells in tumor tissue is 20–200 times that of normal cells. The blood vessels formed by rapid proliferation of endothelial cells provide support for the proliferation of tumor. Miller et al. [Citation13] found that CD105 is mainly expressed in vascular endothelial cells on the edge of tumor tissue, which is consistent with the expression of Cyclin A and Ki-67. Tanaka et al [Citation14] found that apoptosis index of non-small cell lung cancer with high expression of CD105 microvessel density was lower than that with low expression of CD105 microvessel density. CD105 is a standard indicator for proliferation of endothelial cells, and angiogenesis marked by CD105 plays an important role in the tumorigenesis and progression of malignant tumors.
TGF-β1 is a dimeric peptidase secreted by various normal cells and tumor cells. In the carcinogenesis and cancer progression, TGF-β1 can regulate multiple signaling pathways by inducing its downstream Smad signal. In terms of tumor angiogenesis, high expression of TGF-β1 can promote tumor angiogenesis, whose expression is also associated with tumor invasion and metastasis [Citation15]. During carcinogenesis and cancer progression, TGF-β1 and CD105 interact closely, are both highly expressed in tumor tissues, and are closely associated with tumor microvessel density (MVD) [Citation16]. In the study of downstream signal Smad, Smad1-4 have been demonstrated to play a dual role in tumor angiogenesis. Specifically, Smad1, Smad2 and Smad4 can further promote tumor metastasis and progression after receiving TGF-β1 signal, while Smad3 plays an inhibitory role during the early stage of tumorigenesis, and high expression of Smad3 can suppress the generation and metastasis of tumor cells. However, with tumor progression, the expression of Smad3 is down-regulated, while that of Smad1, Smad2, and Smad4 is up-regulated [Citation17-18]. Therefore, TGF-β1-Smad signal is a double-edged sword in tumor progression, which can not only promote tumor progression, but also inhibit tumor progression in the early stage.
Sunitinib, belonging to the tumor vascular blocking drug, is able to block VEGFR. In this study, the expression of CD105 in tumor tissue and PB is highly correlated (r = 0.7791, P < 0.0001, 95% CI; 0.0012-0.7973). Patients with low expression of CD105 mRNA in tumor tissue or PB benefit more from sunitinib, with prolonged OS and PFS, which is correlated with tumor angiogenesis. High expression of CD105 suggests obvious trends of tumor angiogenesis and enhanced ability of endothelial cell proliferation. The formation of blood vessels can promote the tumor progression, resulting in the difficulty of patients to benefit from drug treatment. More notably, OS and PFS were longer in patients with lower expression of CD105 in both tumor tissue and PB (12.4 vs. 8.5, P <0.001, 8.5 vs. 6.5 months, P < 0.001). Cox regression analysis also showed that the expression of CD105 can be used as an independent indicator of the prognosis of HCC patients treated by sunitinib.
In the detection of downstream signals, TGF-β1, Smad1, Smad2, and Smad4 were highly expressed in tumor tissues of patients with stage III and IV HCC, while Smad3 was lowly expressed. Additionally, TGF-β1, Smad1, Smad2 and Smad4 were positively correlated with CD105 expression (r = 0.799, 0.833, 0.681 and 0.767, respectively, all P < 0.0001), while Smad3 was negatively correlated with CD105 expression (r = -0.287, P = 0.041). In the study of pathological stage, the expression of TGF-β1, Smad1, Smad2, and Smad4 were significantly up-regulated along with advanced pathological stage, while Smad3 expression was down-regulated. This trend was consistent with the expression of CD105. In consideration of the synergistic role of TGF-β1-Smad and CD105 in tumor progression, it is feasible to believe that the high expression of CD105 also activates the expression of downstream TGF-β1-Smad signal, both of which interact synergistically.
Collectively, we demonstrated that the expression level of CD105 was significantly correlated with the prognosis of advanced HCC patients administered with sunitinib. In addition, the expression of CD105 of patients was directly associated with TGF-β1-Smad signal. Patients with low expression of CD105 in tumor tissue or PB benefited more from sunitinib, which, however, requires verification from large-scale studies.
Conflicts of interest
None of the authors have any conflocts of interest.
References
- Duffy AG, Ulahannan SV, Makorovarusher O, et al. Tremelimumab in combination with ablation in patients with advanced hepatocellular carcinoma[J]. Journal of Hepatology. 2017;66(3):545.
- Hammond J S, Franko J, Holloway SE, et al. Gemcitabine transcatheter arterial chemoembolization for unresectable hepatocellular carcinoma[J]. Hepatogastroenterology. 2014;61(133):1339–1343.
- Ippolito D, Fior D, Bonaffini PA, et al. Quantitative evaluation of CT-perfusion map as indicator of tumor response to transarterial chemoembolization and radiofrequency ablation in HCC patients[J]. European Journal of Radiology. 2014;83(9):1665–1671.
- Ruiz-Morales JM, Swierkowski M, Wells JC, et al. First-line sunitinib versus pazopanib in metastatic renal cell carcinoma: Results from the International Metastatic Renal Cell Carcinoma Database Consortium[J]. European Journal of Cancer. 2016;65:102.
- Saber MM, Bahrainian S, Dinarvand R, et al. Targeted drug delivery of Sunitinib Malate to tumor blood vessels by cRGD-chiotosan-gold nanoparticles[J]. International Journal of Pharmaceutics. 2017;517(1-2):269.
- Fonsatti E, Altomonte M, Nicotra MR, et al. Endoglin (CD105): a powerful therapeutic target on tumor-associated angiogenetic blood vessels[J]. Oncogene. 2003;22(42):6557–6563.
- Weekes C, Lockhart AC, Lenz HJ, et al. Abstract CT148: A phase Ib study evaluating the safety and pharmacokinetics of regorafenib in combination with cetuximab in patients with advanced solid tumors[J]. Cancer Research. 2016;76(14 Supplement):CT148–CT148.
- Shao Y, Chen B, Lin Z, et al. Lenalidomide as second-line therapy for advanced hepatocellular carcinoma (HCC): biomarker exploration[J]. Annals of Oncology. 2016;27(suppl_6).
- Zhu AX, Kudo M, Assenat E, et al. EVOLVE-1: Phase 3 study of everolimus for advanced HCC that progressed during or after sorafenib[J]. Journal of Clinical Oncology. 2014;32(3_suppl):172–172.
- Motzer RJ, Hutson TE, Tomczak P, et al. Sunitinib versus interferon alfa in metastatic renal-cell carcinoma[J]. New England Journal of Medicine. 2007;356(2):115.
- Koeberle D, Montemurro M, Samaras P, et al. Continuous Sunitinib Treatment in Patients with Advanced Hepatocellular Carcinoma: A Swiss Group for Clinical Cancer Research (SAKK) and Swiss Association for the Study of the Liver (SASL) Multicenter Phase II Trial (SAKK 77/06)[J]. Oncologist. 2010;15(3):285–292.
- Li Y, Zhai Z, Liu D, et al. CD105 promotes hepatocarcinoma cell invasion and metastasis through VEGF[J]. Tumour Biology the Journal of the International Society for Oncodevelopmental Biology & Medicine. 2015;36(2):737.
- Miller C D, Miller W L. Transcriptional repression of the ovine follicle-stimulating hormone-beta gene by 17 beta-estradiol[J]. Endocrinology. 1996;137(8):3437–46.
- Fujiwara K, Ohuchida K, Shindo K, et al. Migratory activity of CD105+ pancreatic cancer cells is strongly enhanced by pancreatic stellate cells[J]. Pancreas. 2013;42(8):1283.
- Soares R, Guo S, Gärtner F, et al. 17 beta -estradiol-mediated vessel assembly and stabilization in tumor angiogenesis requires TGF beta and EGFR crosstalk[J]. Angiogenesis. 2003;6(4):271–281.
- She X, Matsuno F, Harada N, et al. Synergy between anti‐endoglin (CD105) monoclonal antibodies and TGF‐β in suppression of growth of human endothelial cells[J]. International Journal of Cancer. 2004;108(2):251.
- Lu S, Lee J, Revelo M, et al. Smad3 is overexpressed in advanced human prostate cancer and necessary for progressive growth of prostate cancer cells in nude mice[J]. Clinical Cancer Research An Official Journal of the American Association for Cancer Research. 2007;13(19):5692–702.
- Yang J, Wang Y, Zeng Z, et al. Smad4 deletion in blood vessel endothelial cells promotes ovarian cancer metastasis[J]. International Journal of Oncology. 2017;50(5):1693.