
ABSTRACT
Inhibitors of PARP1 are approved therapeutic agents in ovarian carcinomas. We determined whether the novel clinically relevant CHK1 inhibitor SRA737 interacted with PARP1 inhibitors to kill carcinoma cells. In multiple mammary and ovarian cancer lines SRA737 synergized with the PARP1 inhibitors olaparib and niraparib to cause cell death. The [SRA737 + niraparib] drug combination activated an ATM-AMPK-ULK1-mTOR pathway which resulted in the formation of autophagosomes, temporally followed by autolysosome formation. Phosphorylation of ULK1 S317 was essential for kinase activation against ATG13. The drug combination elevated eIF2α phosphorylation which was causal at increasing Beclin1 and ATG5 expression, reducing MCL-1 and BCL-XL levels, and causing CD95 activation. Knock down of CD95, eIF2α, ATM, AMPKα, ULK1, Beclin1 or ATG5 reduced drug combination lethality. Blockade of either caspase 9 function or that of AIF each partially prevented cell death. Expression of activated mTOR or of c-FLIP-s or of BCL-XL reduced cell killing. In vivo, SRA737 and niraparib interacted in an additive fashion to suppress the growth of mammary tumors. Multiplex analyses revealed that drug combination treated tumors had reduced their plasma levels of sERBB1, sERBB2, sVEGFR1, sVEGFR2, sIL-6R, HGF, PDGFAB/BB and CXCL16 and enhanced the levels of CCL26, IL-8 and MIF. Surviving tumors had activated ERK1/2 and AKT. This finding argues that IL-8/ERK/AKT signaling may be an evolutionary survival response to [SRA737 + niraparib].
Introduction
DNA damage causes activation of multiple signal transduction pathways that cause growth arrest and DNA damage repair responses.Citation1 By halting the cell cycle following DNA damage, cells can repair their DNA prior to mitosis; the inheritance of a single double stranded DNA break is clonogenically lethal.Citation2 DNA damage associated cell cycle checkpoints are regulated by ataxia telangiectasia (ATM) and Rad3-related and ataxia telangiectasia-related (ATR) kinases.Citation3 ATR phosphorylates CHK1 that in turn phosphorylates CDC25 protein phosphatases at regulatory sites.Citation4 CHK1-mediated phosphorylation of CDC25A and CDC25C causes both their inactivation and/or degradation and prevents these phosphatases from dephosphorylating and activating cyclin dependent kinases.Citation5,Citation6 As inhibition of CHK1 could result in enhanced killing by DNA damaging therapies, over the past 20 years, multiple inhibitors of CHK1 have been developed, but which have ultimately failed in the clinic for a variety of reasons, e.g. UCN-01, AZD7762, LY2603618.Citation7,Citation8 The present studies utilize a novel ATP binding site CHK1 inhibitor, SRA737, that is presently under clinical evaluation (NCT02797964, NCT02797977).Citation7 The C max for SRA737 in a patient ingesting 40 mg of the drug is approximately 250 nM; patients are routinely dosed with 80 mg of the drug (150 mg/m2).
Poly (ADP-ribose) polymerase (PARP) is essential for DNA repair via the base excision repair pathway and for genomic stability.Citation8 PARP1 associates with damaged DNA where its catalytic activity is enhanced, that results in the synthesis of branched, protein-conjugated poly (ADP-ribose) both to PARP1 and to additional proteins that control base excision repair.Citation9 Multiple PARP1 inhibitors have been developed and several have been approved for clinical use. Olaparib is FDA approved for the treatment of germline BRCA1/2 mutated ovarian cancer that has previously received three or more lines of chemotherapy.Citation10 In contrast to olaparib, niraparib is approved for use in all patients with recurrent ovarian, fallopian tube or peritoneal cancers, as well as in patients who have previously received carboplatin.Citation11 The C max for niraparib in a patient ingesting 100 mg of the drug is approximately 2.5 μM; dosing is 100 mg TID in patients. Multiple groups have demonstrated that compounds that inhibit PARP1 can synergize with conventional genotoxic chemotherapies, including topoisomerase I inhibitors, ionizing radiation and DNA alkylating agents to kill a wide variety of tumor cell types.Citation12–Citation15
Previous studies from our laboratory, using first generation CHK1 and PARP1 inhibitors, had demonstrated that the two classes of agents synergized in vitro to kill breast cancer cells.Citation16–Citation18 The agents also interacted in vivo to suppress mammary tumor growth. The present studies were designed to determine in mammary and ovarian cancer cells whether the FDA approved PARP1 inhibitors (olaparib, niraparib) synergized with the novel CHK1 inhibitor SRA737 to kill. Our findings demonstrated that the synergy of killing by these agents required the DNA damage -induced inactivation of mTOR and the formation of toxic autophagosomes, and the stimulation of endoplasmic reticulum stress signaling which reduced expression of short half-lived cyto-protective proteins.
Results
Initial studies employed a range of mammary and ovarian cancer cell lines to determine in short-term 24h cell viability assays whether SRA737 enhanced the lethality of the PARP1 inhibitor niraparib. Using either a live/dead assay based on membrane permeability and cell metabolism, or using a trypan blue assay, SRA737 and niraparib interacted in an additive to greater than additive fashion to kill tumor cells (). Similar data were obtained when SRA737 was combined with the PARP1 inhibitor olaparib (not shown). To fully define whether the interaction between SRA737 and niraparib was synergistic, we performed colony formation assays using median dose effect analyses based on the method of Chou and Tallallay. In mammary (BT474, SUM149) or ovarian (Spiky, SKOV3) lines, SRA737 synergized with niraparib to kill (). Similar synergy data were obtained when SRA737 was combined with the PARP1 inhibitor olaparib (Figure S1).
Figure 1. SRA737 and niraparib interact in an additive to greater-than-additive fashion to kill mammary and ovarian cancer cells. Twenty-four h after plating, mammary (BT474, SUM149, 4T1) and ovarian (OVCAR3, SKOV3, Spiky) cancer cells were treated with vehicle control, SRA737 (0.25 μM), niraparib (2.0 μM) or the drugs in combination for 12h or for 24h. At each time point cells were isolated and cell viability determined either by a live/dead assay or by a trypan blue assay (n = 2 separate studies, within each are multiple independent individual treatments +/- SD).
Figure 2. SRA737 and niraparib synergize to kill mammary and ovarian cancer cells. Tumor cells were plated in 6-well plates in sextuplicate as individual cells (500 cells per well). After 12h the cells were treated with vehicle control, SRA737, niraparib or the drugs combined, at the indicated concentrations in the figure, at a fixed ratio. After 24h, the media is removed, the cells washed with warm drug-free media, and fresh drug-free media placed on the cells. After 10 days, colonies of > 50 cells have formed and the cells are fixed in place and stained with crystal violet. The plating efficiency under each treatment condition is determined and the fraction affected determined. Synergy was determined using the Calcusyn for Windows program using the method of Cho and Tallalay (n = 2 independent studies in sextuplicate). A combination index of less than 1.00 indicates a synergy of drug interaction.
We next examined in an agnostic fashion the expression and phosphorylation of proteins that have previously been associated with the regulation cell signaling and cell survival. Treatment of cells with SRA737, niraparib or the drug combination enhanced the phosphorylation of γH2AX and of ATM, demonstrating that a DNA damage response was being induced ( and ). Increased ATM phosphorylation correlated with elevated phosphorylation of AMPKα T172, ULK1 S317, TSC2 S1469 and Raptor T792. Increased ATM phosphorylation correlated with reduced phosphorylation of ULK1 S757, mTOR S2481 and mTOR S2448. Upstream of mTOR, we examined the phosphorylation of AKT and ERK1/2. The drug combination reduced AKT T308 phosphorylation (). Similar reduced phosphorylation effects were observed for the transcription factors STAT3 Y705 and p65 NFκB S536. SRA737, neratinib and the drug combination all enhanced ERK1/2 phosphorylation, which was different to our prior studies using other CHK1 and PARP inhibitors, where we previously discovered that inhibition of PARP1 prevented CHK1 inhibitor -induced ERK1/2 activation. Very similar findings to those in were made in BT474 HER2+ and SUM149 TNBC mammary carcinoma cells (not shown).
Figure 3. SRA737 and niraparib combined to activate a DNA damage response that correlates with the activation of AMPKα and the inactivation of mTOR. (a) Spiky ovarian cancer cells 24h after plating were treated with vehicle control, SRA737 (0.25 μM), niraparib (2.0 μM) or the drugs in combination for 4h or for 8h. Cells were fixed in place and immunofluorescence staining performed to detect the expression and phosphorylation of the indicated proteins (n = 3 independent assessments from 40 cells per image +/- SD) # p < 0.05 greater than vehicle control; * p < 0.05 less than vehicle control. (b) Spiky ovarian cancer cells 24h after plating were treated with vehicle control, SRA737 (0.25 μM), niraparib (2.0 μM) or the drugs in combination for 4h or for 8h. Cells were fixed in place and immunofluorescence staining performed to detect the expression and phosphorylation of the indicated proteins (n = 3 independent assessments from 40 cells per image +/- SD) # p < 0.05 greater than vehicle control; * p < 0.05 less than vehicle control.
The mTOR and ULK1 phosphorylation data in argued that we may be stimulating autophagosome formation in our system, and we next investigated changes in autophagy-related biomarkers. The drug combination reduced expression of p62 and LAMP2, increased the expression of ATG5, ATG13 and Beclin1, and enhanced the phosphorylation of ATG13 S318 (). Similar data were obtained in BT474 and SUM149 mammary carcinoma cells (not shown). Based on prior experience developing anti-cancer drug combinations, we next examined the impact of SRA737 and niraparib on proteins that regulate mitochondrial function. SRA737, niraparib and the drug combination reduced the expression of the cyto-protective proteins BCL-XL and MCL-1 (). The drugs also enhanced expression of the cyto-toxic BH3 domain protein BIM. One mechanism we have previously established that can rapidly reduce MCL-1 and BCL-XL expression is via the induction of endoplasmic reticulum stress. SRA737, niraparib and the drug combination increased the phosphorylation of eIF2α S51, indicative of an ER stress response and inhibition of transcription being caused by the drugs ().
Figure 4. SRA737 and niraparib combine to increase the levels of autophagosomes followed temporally by increasing the levels of autolysosomes. (a) Spiky ovarian cancer cells 24h after plating were treated with vehicle control, SRA737 (0.25 μM), niraparib (2.0 μM) or the drugs in combination for 4h or for 8h. Cells were fixed in place and immunofluorescence staining performed to detect the expression and phosphorylation of the indicated proteins (n = 3 independent assessments from 40 cells per image +/- SD) # p < 0.05 greater than vehicle control; * p < 0.05 less than vehicle control. (b) Spiky (ovarian) and BT474 and SUM149 (mammary) carcinoma cells were transfected with a plasmid to express an LC3-GFP-RFP fusion protein. Twenty-four h after transfection, cells were treated with vehicle control, SRA737 (0.25 μM), niraparib (2.0 μM) or the drugs in combination for 4h or for 8h. At each time point cells under each condition were examined for the presence of intense GFP+ and RFP+ punctae, and the mean number of punctae determined (n = 3 +/- SD).
Collectively, the data in and suggested to us that autophagosome formation may be occurring. Thus, we transfected ovarian and mammary carcinoma cells with a plasmid to express LC3-GFP-RFP; GFP punctae detect autophagosomes, RFP punctae detect autolysosomes. SRA737, niraparib and, to a greater extent, the drug combination, enhanced autophagosome levels as judged by increased numbers of GFP+ punctae in the cells (). At the earliest time point (4h), the was almost no observation of a drug-stimulated increase in autolysosome levels, however, by 8h after drug exposure the levels of autophagosomes had declined and the levels of RFP+ punctae in the cells, indicative of autolysosome formation, had increased. This argues that autophagic flux was stimulated by our drug combination.
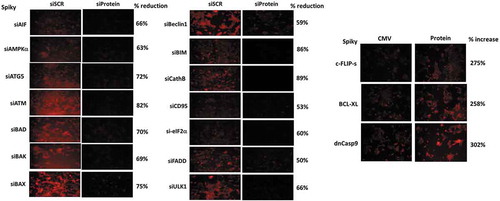
Additional studies, also performed in an agnostic fashion, then determined the relative importance of each protein in the death-response of cells treated with [SRA737 + niraparib]. Knock down of CD95, FADD, AIF, BAX, BAK, BAD and BIM all reduced drug combination lethality (). The drug combination increased cell surface levels of CD95 that was blocked in Spiky ovarian cancer cells by knockdown of AMPKα, ATM or eIF2α, whereas in BT474 mammary carcinoma cells only knockdown of AMPKα or eIF2α blocked CD95 activation (, inset panel). Knock down of ATM, AMPKα, ULK1, ATG5 and Beclin1 also reduced killing by the [SRA737 + niraparib] combination. Similar cell-viability findings were made when SRA737 was combined with olaparib (not shown).
Figure 5. [SRA737 + niraparib] lethality is mediated by death receptor signaling, toxic BH3 domain proteins and autophagy regulatory proteins. Tumor cells were transfected with a scrambled control siRNA (siSCR) or with siRNA molecules to knock down the expression of the proteins indicated in the Figure. Twenty-four h after transfection, cells were treated with vehicle control, SRA737 (0.25 μM), niraparib (2.0 μM) or the drugs in combination for 24h. After 24h, cells were isolated and cell viability determined by a live/dead assay (n = 2 separate studies, within each are multiple independent individual treatments +/- SD). Inset Panels: Spiky and BT474 cells were transfected with a scrambled control siRNA (siSCR) or with siRNA molecules to knock down the expression of ATM, AMPKα or eIF2α. Twenty-four h after transfection, cells were treated with vehicle control or with [SRA737 (0.25 μM) + niraparib (2.0 μM)] in combination for 4h. Cells were fixed in place without permeabilization and immunostaining performed to determine the cell surface levels of CD95. (n = 3 independent assessments from 40 cells per image +/- SD) * p < 0.05 less than corresponding value in siSCR control.
![Figure 5. [SRA737 + niraparib] lethality is mediated by death receptor signaling, toxic BH3 domain proteins and autophagy regulatory proteins. Tumor cells were transfected with a scrambled control siRNA (siSCR) or with siRNA molecules to knock down the expression of the proteins indicated in the Figure. Twenty-four h after transfection, cells were treated with vehicle control, SRA737 (0.25 μM), niraparib (2.0 μM) or the drugs in combination for 24h. After 24h, cells were isolated and cell viability determined by a live/dead assay (n = 2 separate studies, within each are multiple independent individual treatments +/- SD). Inset Panels: Spiky and BT474 cells were transfected with a scrambled control siRNA (siSCR) or with siRNA molecules to knock down the expression of ATM, AMPKα or eIF2α. Twenty-four h after transfection, cells were treated with vehicle control or with [SRA737 (0.25 μM) + niraparib (2.0 μM)] in combination for 4h. Cells were fixed in place without permeabilization and immunostaining performed to determine the cell surface levels of CD95. (n = 3 independent assessments from 40 cells per image +/- SD) * p < 0.05 less than corresponding value in siSCR control.](/cms/asset/655770af-6c7f-428c-b164-c64a003324c3/kcbt_a_1472189_f0005_oc.jpg)
In agreement with data demonstrating that knock down of CD95 or of FADD protected the cells, over-expression of the caspase 8/10 inhibitor c-FLIP-s reduced drug combination lethality (). We had previously observed that the [SRA737 + niraparib] combination reduced the expression of MCL-1 and BCL-XL, and that multiple toxic BH3 domain proteins played a role in the killing process. Over-expression of BCL-XL protected tumor cells from the drug combination (). In we discovered that AIF, downstream of the mitochondrion reduced the lethality of [SRA737 + niraparib] by ~ 50%. Expression of dominant negative caspase 9, which blocks cytochrome c – caspase 9 – caspase 3 apoptotic signaling, also reduced drug combination lethality by ~ 50% (). Collectively, our data argue that a toxic form of autophagy, death receptor signaling and mitochondrial dysfunction all play key roles in [SRA737 + niraparib] apoptotic/necroptotic killing.
Figure 6. Over-expression of c-FLIP-s, BCL-XL or dominant negative caspase 9 suppresses the lethality of [SRA737 + niraparib]. Tumor cells were transfected with an empty vector plasmid (CMV) or with plasmids to over-express c-FLIP-s, BCL-XL or dominant negative caspase 9, as indicated in the Figure. Twenty-four h after transfection, cells were treated with vehicle control, SRA737 (0.25 μM), niraparib (2.0 μM) or the drugs in combination for 24h. After 24h, cells were isolated and cell viability determined by a live/dead assay (n = 2 separate studies, within each are multiple independent individual treatments +/- SD).
![Figure 6. Over-expression of c-FLIP-s, BCL-XL or dominant negative caspase 9 suppresses the lethality of [SRA737 + niraparib]. Tumor cells were transfected with an empty vector plasmid (CMV) or with plasmids to over-express c-FLIP-s, BCL-XL or dominant negative caspase 9, as indicated in the Figure. Twenty-four h after transfection, cells were treated with vehicle control, SRA737 (0.25 μM), niraparib (2.0 μM) or the drugs in combination for 24h. After 24h, cells were isolated and cell viability determined by a live/dead assay (n = 2 separate studies, within each are multiple independent individual treatments +/- SD).](/cms/asset/c5f9f15b-0357-4116-8c31-121f1fdbc478/kcbt_a_1472189_f0006_b.gif)
Based on the data in –, we next performed focused assays using siRNA knock down or expression of constitutively activated kinases to define primary and secondary signal transduction pathways that acted to cause [SRA737 + niraparib] lethality. In Spiky ovarian cancer cells knock down of AMPKα, and to a greater extent knock down of ATM, prevented SRA737, niraparib or the drug combination from reducing ULK-1 S757 phosphorylation and enhancing ULK-1 S317 phosphorylation (). SRA737, niraparib and the drug combination inactivated mTORC1 (S2448) and mTORC2 (S2481) in Spiky cells, that was prevented by knock down of either AMPKα or ATM. In BT474 mammary carcinoma cells, however, whilst the drug-induced inactivation of mTORC1 (S2448) was blocked by knock down of AMPKα or of ATM, the activity of mTORC2 (S2481) was reduced by the drug combination regardless of AMPKα or ATM expression (). In BT474 cells the drug combination, regardless of AMPKα or ATM expression, reduced the phosphorylation of ULK-1 S757. This data argues that mTORC2 regulates ULK-1 S757 phosphorylation in our BT474 cell system. As was observed in Spiky ovarian cancer cells, the drug combination enhanced ULK-1 S317 phosphorylation in BT474 mammary carcinoma cells, an effect that was blocked by knock down of AMPKα or ATM.
Figure 7. Knock down of ATM or AMPKα prevents [SRA737 + niraparib] from inactivating mTORC1 and mTORC2. (a) Spiky cells were transfected with a scrambled siRNA control or with siRNA molecules to knock down ATM or AMPKα. Twenty-four h after transfection, the cells were treated for 4h with vehicle control, SRA737 (250 nM), niraparib (2.0 μM) or the drugs in combination. After 4h, cells were fixed in place and immunostaining performed to determine the total expression of ULK-1 and the phosphorylation of ULK-1 S757 and ULK-1 S317; and the phosphorylation of mTOR S2448 (mTORC1) and mTOR S2481 (mTORC2). (n = 3 independent assessments from 40 cells per image +/- SD) # p < 0.05 greater than vehicle control; * p < 0.05 less than vehicle control; ** p < 0.05 greater than corresponding value in siSCR and less than corresponding value in siATM cells. (b) BT474 cells were transfected with a scrambled siRNA control or with siRNA molecules to knock down ATM or AMPKα. Twenty-four h after transfection, the cells were treated for 4h with vehicle control, SRA737 (250 nM), niraparib (2.0 μM) or the drugs in combination. After 4h, cells were fixed in place and immunostaining performed to determine the total expression of ULK-1 and the phosphorylation of ULK-1 S757 and ULK-1 S317; and the phosphorylation of mTOR S2448 (mTORC1) and mTOR S2481 (mTORC2). (n = 3 independent assessments from 40 cells per image +/- SD) # p < 0.05 greater than vehicle control; * p < 0.05 less than vehicle control; ** p < 0.05 greater than corresponding value in siSCR and less than corresponding value in siATM cells.
![Figure 7. Knock down of ATM or AMPKα prevents [SRA737 + niraparib] from inactivating mTORC1 and mTORC2. (a) Spiky cells were transfected with a scrambled siRNA control or with siRNA molecules to knock down ATM or AMPKα. Twenty-four h after transfection, the cells were treated for 4h with vehicle control, SRA737 (250 nM), niraparib (2.0 μM) or the drugs in combination. After 4h, cells were fixed in place and immunostaining performed to determine the total expression of ULK-1 and the phosphorylation of ULK-1 S757 and ULK-1 S317; and the phosphorylation of mTOR S2448 (mTORC1) and mTOR S2481 (mTORC2). (n = 3 independent assessments from 40 cells per image +/- SD) # p < 0.05 greater than vehicle control; * p < 0.05 less than vehicle control; ** p < 0.05 greater than corresponding value in siSCR and less than corresponding value in siATM cells. (b) BT474 cells were transfected with a scrambled siRNA control or with siRNA molecules to knock down ATM or AMPKα. Twenty-four h after transfection, the cells were treated for 4h with vehicle control, SRA737 (250 nM), niraparib (2.0 μM) or the drugs in combination. After 4h, cells were fixed in place and immunostaining performed to determine the total expression of ULK-1 and the phosphorylation of ULK-1 S757 and ULK-1 S317; and the phosphorylation of mTOR S2448 (mTORC1) and mTOR S2481 (mTORC2). (n = 3 independent assessments from 40 cells per image +/- SD) # p < 0.05 greater than vehicle control; * p < 0.05 less than vehicle control; ** p < 0.05 greater than corresponding value in siSCR and less than corresponding value in siATM cells.](/cms/asset/17982ba3-8599-4d50-aba2-8e0cac33c8e6/kcbt_a_1472189_f0007_b.gif)
Knock down of AMPKα modestly reduced the ability of the drug combination to activate ATM in both Spiky and BT474 cells (). Knock down of either ATM or AMPKα also prevented SRA737, niraparib or the drug combination from increasing ATG13 S318 phosphorylation in both Spiky and BT474 cells (). Knock down of ATM abolished the abilities of SRA737, niraparib or the drug combination from enhancing AMPKα T172 phosphorylation (Figure S2). The drug combination inactivated ERK1/2, NFκB and AKT, which was prevented by knock down of either AMPKα or ATM (Figures S3 and S4). Expression of activated mTOR partially protected against drug combination lethality. (Figure S5). Collectively, our data in BT474 cells implies that whilst inactivation of mTORC2 results in reduced ULK-1 S757 phosphorylation levels, that reduction in S757 levels is insufficient to activate ULK-1 against ATG13. Our data argues that for functional activation of ULK-1, in addition to S757 dephosphorylation, requires increased ULK-1 S317 phosphorylation. And, that increase in ULK-1 S317 phosphorylation requires ATM-AMPK signaling.
Figure 8. Knock down of ATM or AMPKα prevents [SRA737 + niraparib] from stimulating ATG13 S318 phosphorylation. (a) Spiky and BT474 cells were transfected with a scrambled siRNA control or with siRNA molecules to knock down ATM or AMPKα. Twenty-four h after transfection, the cells were treated for 4h with vehicle control, SRA737 (250 nM), niraparib (2.0 μM) or the drugs in combination. After 4h, cells were fixed in place and immunostaining performed to determine the total expression of ATM and the phosphorylation of ATM S1981. (n = 3 independent assessments from 40 cells per image +/- SD) # p < 0.05 greater than vehicle control; * p < 0.05 less than siSCR control; ** p < 0.05 greater than corresponding value in siATM cells. (b) Spiky and BT474 cells were transfected with a scrambled siRNA control or with siRNA molecules to knock down ATM or AMPKα. Twenty-four h after transfection, the cells were treated for 4h with vehicle control, SRA737 (250 nM), niraparib (2.0 μM) or the drugs in combination. After 4h, cells were fixed in place and immunostaining performed to determine the total expression of ATG13 and the phosphorylation of ATG13 S318. (n = 3 independent assessments from 40 cells per image +/- SD) # p < 0.05 greater than vehicle control.
![Figure 8. Knock down of ATM or AMPKα prevents [SRA737 + niraparib] from stimulating ATG13 S318 phosphorylation. (a) Spiky and BT474 cells were transfected with a scrambled siRNA control or with siRNA molecules to knock down ATM or AMPKα. Twenty-four h after transfection, the cells were treated for 4h with vehicle control, SRA737 (250 nM), niraparib (2.0 μM) or the drugs in combination. After 4h, cells were fixed in place and immunostaining performed to determine the total expression of ATM and the phosphorylation of ATM S1981. (n = 3 independent assessments from 40 cells per image +/- SD) # p < 0.05 greater than vehicle control; * p < 0.05 less than siSCR control; ** p < 0.05 greater than corresponding value in siATM cells. (b) Spiky and BT474 cells were transfected with a scrambled siRNA control or with siRNA molecules to knock down ATM or AMPKα. Twenty-four h after transfection, the cells were treated for 4h with vehicle control, SRA737 (250 nM), niraparib (2.0 μM) or the drugs in combination. After 4h, cells were fixed in place and immunostaining performed to determine the total expression of ATG13 and the phosphorylation of ATG13 S318. (n = 3 independent assessments from 40 cells per image +/- SD) # p < 0.05 greater than vehicle control.](/cms/asset/f52d23df-a0e9-4db8-82b8-ef435116b77a/kcbt_a_1472189_f0008_b.gif)
Prior studies by our group have often shown that drug combinations can enhance endoplasmic reticulum stress signaling. The [SRA737 + niraparib] drug combination caused an endoplasmic reticulum stress response, as judged by enhanced eIF2α phosphorylation (). Knock down of eIF2α or the lysosomal protease cathepsin B suppressed drug combination lethality and prevented the drug combination from reducing the expression of MCL-1 and BCL-XL (). Knock down of eIF2α prevented the drug combination from increasing the expression of Beclin1 and of ATG5 ( and ). Knock down of eIF2α, AMPKα or ATM prevented the drug combination from increasing LC3-GFP+ (autophagosome) and LC3-RFP+ (autolysosome) punctae, arguing that the increases in autophagosome and autolysosome levels require the concerted signaling by multiple signal transduction pathways ().
Figure 9. Endoplasmic reticulum stress signaling plays a key role in mediating toxic autophagy caused by [SRA737 + niraparib]. (a) Spiky and BT474 cells were transfected with a scrambled siRNA (siSCR) or with siRNA molecules to knock down the expression of cathepsin B or eIF2α. Twenty-four h after transfection cells were treated with vehicle control, SRA737 (0.25 μM), niraparib (2.0 μM) or the drugs in combination for 24h. After 24h, cells were isolated and cell viability determined by a live/dead assay (n = 2 separate studies, within each are multiple independent individual treatments +/- SD). * p < 0.05 less than corresponding value in siSCR transfected cells. (b) and (c) Spiky and BT474 cells were transfected with a scrambled siRNA (siSCR) or with an siRNA molecule to knock down eIF2α. Twenty-four h after transfection cells were treated with vehicle control, SRA737 (0.25 μM), niraparib (2.0 μM) or the drugs in combination for 4h. Cells were fixed in place and immunostaining performed to determine the expression of MCL-1, BCL-XL, Beclin1 and ATG5. # p < 0.05 greater than corresponding value in vehicle treated cells; * p < 0.05 less than corresponding value in vehicle treated cells. (d) Spiky ovarian cancer cells were transfected with a plasmid to express LC3-GFP-RFP and in parallel transfected with a scrambled siRNA or with siRNA molecules to knock down eIF2α, ATM or AMPKα. Twenty-four h after transfection cells were treated for 4h and 8h with vehicle control or with [SRA737 (0.25 μM) + niraparib (2.0 μM)]. At each time point the numbers of intense staining GFP+ and RFP+ punctae were determined (n = 3 +/- SD). * p < 0.05 less than corresponding value in siSCR cells.
![Figure 9. Endoplasmic reticulum stress signaling plays a key role in mediating toxic autophagy caused by [SRA737 + niraparib]. (a) Spiky and BT474 cells were transfected with a scrambled siRNA (siSCR) or with siRNA molecules to knock down the expression of cathepsin B or eIF2α. Twenty-four h after transfection cells were treated with vehicle control, SRA737 (0.25 μM), niraparib (2.0 μM) or the drugs in combination for 24h. After 24h, cells were isolated and cell viability determined by a live/dead assay (n = 2 separate studies, within each are multiple independent individual treatments +/- SD). * p < 0.05 less than corresponding value in siSCR transfected cells. (b) and (c) Spiky and BT474 cells were transfected with a scrambled siRNA (siSCR) or with an siRNA molecule to knock down eIF2α. Twenty-four h after transfection cells were treated with vehicle control, SRA737 (0.25 μM), niraparib (2.0 μM) or the drugs in combination for 4h. Cells were fixed in place and immunostaining performed to determine the expression of MCL-1, BCL-XL, Beclin1 and ATG5. # p < 0.05 greater than corresponding value in vehicle treated cells; * p < 0.05 less than corresponding value in vehicle treated cells. (d) Spiky ovarian cancer cells were transfected with a plasmid to express LC3-GFP-RFP and in parallel transfected with a scrambled siRNA or with siRNA molecules to knock down eIF2α, ATM or AMPKα. Twenty-four h after transfection cells were treated for 4h and 8h with vehicle control or with [SRA737 (0.25 μM) + niraparib (2.0 μM)]. At each time point the numbers of intense staining GFP+ and RFP+ punctae were determined (n = 3 +/- SD). * p < 0.05 less than corresponding value in siSCR cells.](/cms/asset/7e74cfea-813e-4f9c-a1fc-0969788e8c5b/kcbt_a_1472189_f0009_b.gif)
Continuing studies next determined whether SRA737 and niraparib interacted in vivo to suppress tumor growth. SRA737 and niraparib interacted in an additive to greater-than additive manner to suppress the growth of BT474 mammary tumors (). Multiplex studies were performed on the plasma and tumor tissue from mice treated with the various drugs. In the plasma of animals carrying BT474 tumors previously treated 14 days previously with [SRA737 + niraparib] we found that the levels of IL-8, CXCL12, IL-10 and MIF were enhanced and the levels of sERBB1, sERBB2, sIL-6R, sTIE2, sVEGFR1, sVEGFR2, HGF, PDGFAB/BB, SCF, CXCL16, TGFβ1 and TGFβ2 were decreased (). No change in the plasma or tumor levels of interferon γ was observed. Similar data were obtained in the plasma of animals carrying Spiky tumors previously treated with [SRA737 + niraparib] (not shown). In the tumors themselves, BT474 tumors previously treated with [SRA737 + niraparib] exhibited reduced phosphorylation of ERBB1 Y1173 and enhanced phosphorylation of MEK1/2, AKT (S473), GSK3 (S9/S21) with little alteration in the phosphorylation of JNK1/2, p38 MAPK, p70 S6K or mTOR ().
Figure 10. SRA737 and niraparib interact in an additive fashion to suppress the growth of BT474 mammary tumors. (a) BT474 cells (2 × 10⁶) were implanted into the 4th mammary fat pad of athymic mice. Tumors permitted to form until the mean tumor volume was ~ 25 mm3. Animals were then segregated into groups with near identical mean volumes and the animals then treated for five days with the indicated therapeutic agents: vehicle control (cremophore); niraparib 25 mg/kg (QD Days 1–5); SRA737 25 mg/kg (QD Days 1–5)] or the drugs in combination. Tumor volumes were measured prior to drug administration and every three days after the initiation of therapeutic interventions. (n = 10 mice per group +/-SEM). For BT474 cells when the volume of the tumor reached > 500 mm3, animals were humanely sacrificed and the tumor and blood removed for further studies. * p < 0.05 less than SRA737 alone. (b)-(d). Multiplex assays were performed using a Bio-Rad MAGPIX machine. Serum/tumor material was obtained at Day 8 (D8) or at termination of the study (T). Material was obtained from three separate animals and assayed in duplicate (n = 6 determinations +/- SEM). # p < 0.05 greater than value in vehicle control treated mice; * p < 0.05 less than value in vehicle control treated mice.
![Figure 10. SRA737 and niraparib interact in an additive fashion to suppress the growth of BT474 mammary tumors. (a) BT474 cells (2 × 10⁶) were implanted into the 4th mammary fat pad of athymic mice. Tumors permitted to form until the mean tumor volume was ~ 25 mm3. Animals were then segregated into groups with near identical mean volumes and the animals then treated for five days with the indicated therapeutic agents: vehicle control (cremophore); niraparib 25 mg/kg (QD Days 1–5); SRA737 25 mg/kg (QD Days 1–5)] or the drugs in combination. Tumor volumes were measured prior to drug administration and every three days after the initiation of therapeutic interventions. (n = 10 mice per group +/-SEM). For BT474 cells when the volume of the tumor reached > 500 mm3, animals were humanely sacrificed and the tumor and blood removed for further studies. * p < 0.05 less than SRA737 alone. (b)-(d). Multiplex assays were performed using a Bio-Rad MAGPIX machine. Serum/tumor material was obtained at Day 8 (D8) or at termination of the study (T). Material was obtained from three separate animals and assayed in duplicate (n = 6 determinations +/- SEM). # p < 0.05 greater than value in vehicle control treated mice; * p < 0.05 less than value in vehicle control treated mice.](/cms/asset/2d2fc79d-d24d-4e0b-8ff4-f2c047fb866c/kcbt_a_1472189_f0010_b.gif)
Figure 11. Multiplex analyses of plasma and tumor tissues from drug-treated mice. Multiplex assays were performed using a Bio-Rad MAGPIX machine. Tumor material was obtained at Day 8 (D8) or at termination of the study (T). Material was obtained from three separate animals and assayed in duplicate for changes in protein phosphorylation (n = 6 determinations +/- SEM). # p < 0.05 greater than value in vehicle control treated mice; * p < 0.05 less than value in vehicle control treated mice; ¶ p < 0.05 greater than D8 value.
Discussion
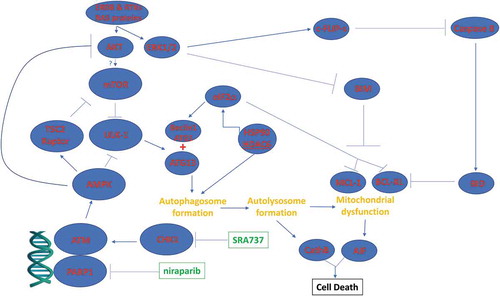
The present studies were performed to determine whether the novel CHK1 inhibitor SRA737 interacted with PARP1 inhibitors to kill ovarian and mammary carcinoma cells. SRA737 synergized with the FDA approved PARP1 inhibitors niraparib and olaparib to kill ovarian and mammary cancer cells. The mechanism of killing was multi-factorial. DNA damage signaling by ATM, induced by SRA737 as well as by the PARP1 inhibitors, was causal in stimulating an AMPK-dependent inactivation of mTOR, AKT, STAT3 and NFκB. In parallel the drug combination increased eIF2α phosphorylation that acted to suppress MCL-1 and BCL-XL expression and enhance ATG5 and Beclin1 levels. Collectively, these events resulted in the stimulation of toxic autophagosome formation, CD95 death receptor activation and downstream, mitochondrial dysfunction with caspase-dependent and AIF-dependent tumor cell execution ().
Figure 12. Possible molecular mechanisms by which SRA737 and PARP1 inhibitors interact to kill tumor cells. As a PARP1 inhibitor, niraparib facilitates a lack of DNA damage repair. SRA737 is a CHK1 inhibitor that can dysregulate cell cycle checkpoints and cause a compensatory activation of ATM. ATM signals to activate the AMPK. AMPK signaling inactivates RAPTOR and TSC2 resulting in the inactivation of mTORC1 and mTORC2. Downstream of mTOR is the kinase ULK-1; the drug combination via AMPK promotes ULK-1 S317 phosphorylation which activates the kinase; the drug combination via mTOR inactivation reduces ULK-1 S757 phosphorylation which also activates the kinase. Activated ULK-1 phosphorylates ATG13 which is the key gate-keeper step in permitting autophagosome formation. Enhanced eIF2α signaling reduces the transcription of proteins with short half-lives such as c-FLIP-s, MCL-1 and BCL-XL, and enhances expression of Beclin1. Enhanced Beclin1 expression converges with elevated ATG13 phosphorylation to produce high levels of autophagosome formation that acts to increase autophagosome production and their subsequent fusion with lysosomes. Cytosolic release of cathepsin proteases converges with to cleave BID and cause mitochondrial dysfunction. Tumor cell killing downstream of the mitochondrion was mediated by AIF and not caspases 3/7.
In contrast to other CHK1 inhibitors previously tested in our laboratory, SRA737 only weakly enhanced ERK1/2 activation, and when combined with PARP1 inhibitors, unlike prior studies, caused CD95 death receptor activation. Our prior studies using olaparib demonstrated than expression of dominant negative CHK1 increased tumor cell sensitivity to the PARP1 inhibitor, and that siRNA knock down of PARP1 enhanced CHK1 inhibitor lethality, arguing that our cell death effect was due to on-target actions of the drugs. Thus, it is probable that SRA737 may have a different spectrum of off-target effectors compared to other CHK1 inhibitors that in our present studies are beneficial at enhancing the killing potential of SRA737 when combined with PARP1 inhibitors.
The drug combination utilized an ATM-AMPK/DNA damage signaling pathway to mediate many of its tumoricidal effects, and at the same time surprisingly also caused an endoplasmic reticulum stress response, i.e. eIF2α activation. Enhanced eIF2α phosphorylation was associated with enhanced PERK phosphorylation (Booth & Dent, unpublished observations), which implies that either the functionality of the PERK inhibitor, the chaperone GRP78, or the Ser/Thr phosphatase that dephosphorylates PERK and eIF2α, PP1, had become reduced. Recent prior studies from our group have demonstrated how the PDE5 inhibitor sildenafil (Viagra) can enhance the DNA damage response activation of ATM by pemetrexed or an HDAC inhibitor.Citation19,Citation20 Sildenafil causes the tumor cells to generate nitric oxide, which reacts with tumor cell ROS to elevate the levels of peroxy-nitrate. Peroxy-nitrate is a potent inhibitor of protein phosphatases that inactivate ATM and PERK/eIF2α, i.e. PP1. Other recent studies from our laboratory have linked autophagy with the degradation of multiple HDAC proteins, including HDAC6 that regulates HSP90 activity.Citation21–Citation23 Reduced HSP90 activity would increase the levels of denatured proteins in the cytoplasm which ultimately could result in the triggering of an endoplasmic reticulum stress response, and eIF2α phosphorylation. Further studies will be required to define how the ER stress pathway is triggered.
As with all cancer chemotherapies, we predict that exposure of tumors to the [SRA737 + niraparib] drug combination will, through evolutionary changes in the biology of the tumor cells, result in altered cytokine production and intracellular signaling activities that in turn will result in the development of resistance to this drug combination. In animals carrying BT474 tumors previously exposed to [SRA737 + niraparib] multiplex analyses revealed that drug combination treated tumors had reduced their plasma levels of sERBB1, sERBB2, sVEGFR1, sVEGFR2, sIL-6R, HGF, PDGFAB/BB and CXCL16 and enhanced the levels of CCL26, IL-8 and MIF. Surviving tumors had activated ERK1/2 and AKT. In drug treated tumors the levels of TGFβ1 were enhanced whereas the levels of TGFβ2 were reduced.
In conclusion, we have demonstrated that the novel CHK1 inhibitor SRA737 synergizes with PARP1 inhibitors to kill mammary and ovarian carcinoma cells. Our mechanistic and in vivo findings provide a strong foundation to perform phase I clinical trials in these malignancies combining SRA737 with the PARP1 inhibitor niraparib. Recently, within the past two months, Sierra Oncology has signed a clinical supply agreement with Janssen Research & Development, LLC. for access to TESARO’s ZEJULA® (niraparib). Sierra intends to evaluate its CHK1 inhibitor, SRA737, in combination with niraparib in the United Kingdom in patients with metastatic castration-resistant prostate cancer (mCRPC).
Materials and methods
Materials
SRA737 was supplied by Sierra Oncology (Los Angeles CA, Vancouver BC). Olaparib and niraparib were purchased from Selleckchem (Houston TX). Cell culture materials were purchased from GIBCOBRL (GIBCOBRL Life Technologies, Grand Island, NY). Established cell lines were purchased from the ATCC. Spiky ovarian cancer cells were kindly provided by Dr. Karen Paz (Champions Oncology, NJ). Commercially available validated short hairpin RNA molecules to knock down RNA/protein levels were from Qiagen (Valencia, CA) (). Reagents and the performance of experimental procedures were all as described in refsCitation18–Citation23.
Figure 13. Control siRNA knock down immunofluorescence images for proteins whose expression was manipulated in the manuscript.
Methods
Culture, Transfection and in vitro exposure of cells to drugs. All cell lines were cultured at 37°C (5% (v/v CO2) in vitro using RPMI supplemented with 5% (v/v) fetal calf serum and 10% (v/v) Non-essential amino acids.Citation18–Citation23 Cells were transfected with siRNA molecules or plasmids as described in prior manuscripts.Citation18–Citation23
Detection of cell viability, protein expression and protein phosphorylation by immuno-fluorescence using a Hermes WiScan machine. http://www.idea-bio.com/.Citation18–Citation23 Live/dead assays used a live-dead reagent (Thermo Fisher Scientific, Waltham MA) and we visualized cells at 10X magnification. Green cells = viable; yellow/red cells = dying/dead. For immuno-fluorescence studies, cells were visualized at either 10X or 60X. All immuno-fluorescent images for each individual protein/phospho-protein were taken using the identical machine settings. Images were processed at 9999 dpi using Adobe Photoshop, and figures generated in Microsoft PowerPoint.Citation18–Citation23
Assessment of autophagy: Cells were transfected with a plasmid to express a green fluorescent protein (GFP) and red fluorescent protein (RFP) tagged form of LC3 (ATG8). GFP punctae detect autophagosome formation and RFP punctae detect autolysosome formation.Citation18–Citation23
Animal Studies with SRA737/Niraparib: Studies were performed per USDA regulations under VCU IACUC protocol AD20008. BT474 cells (2 × 10⁶) were implanted into the 4th mammary fat pad of athymic mice. Tumors permitted to form until the mean tumor volume was ~ 25 mm3. Animals were then segregated into groups with near identical mean volumes and the animals then treated for five days with the indicated therapeutic agents: vehicle control (cremophore); niraparib 25 mg/kg (QD Days 1–5); SRA737 25 mg/kg (QD Days 1–5)] or the drugs in combination. Tumor volumes were measured prior to drug administration and every three days after the initiation of therapeutic interventions. (n = 10 mice per group ± SEM). Before, during and after drug treatment tumors are calipered as indicated in the Figure and tumor volume was assessed up to 20–40 days later. For BT474 cells when the volume of the tumor reached > 500 mm3, animals were humanely sacrificed and the tumor and blood removed for further studies.
Multiplex assays. Were performed as previously described using a Bio-Rad MAGPIX machine in referencesCitation18–Citation23:
Data analysis. Comparison of the effects of various treatments (performed in triplicate three times) was using one-way analysis of variance and a two tailed Student’s t-test. Statistical examination of in vivo animal survival data utilized both a two tailed Student’s t-test and log rank statistical analyses between the different treatment groups. Differences with a p-value of < 0.05 were considered statistically significant. Experiments shown are the means of multiple individual points from multiple experiments (± SEM).
Disclosure of Potential Conflicts of Interest
No potential conflict of interest was reported by the authors.
Abbreviations
| PI3K | = | phosphatidyl inositol 3 kinase |
| ca | = | constitutively active |
| dn | = | dominant negative |
| ER | = | endoplasmic reticulum |
| mTOR | = | mammalian target of rapamycin |
| JAK | = | Janus Kinase |
| STAT | = | Signal Transducers and Activators of Transcription |
| MAPK | = | mitogen activated protein kinase |
| PTEN | = | phosphatase and tensin homologue on chromosome ten |
| ROS | = | reactive oxygen species |
| CMV | = | empty vector plasmid or virus |
| si | = | small interfering |
| SCR | = | scrambled |
| IP | = | immunoprecipitation |
| VEH | = | vehicle |
| 737 | = | SRA737 |
| OLAP | = | olaparib |
| NIR | = | niraparib |
| COBI | = | cobimetinib. |
Supplemental Material
Download PDF (1 MB)Acknowledgments
Support for the present study was funded from philanthropic funding from Massey Cancer Center, the Universal Inc. Chair in Signal Transduction Research and PHS R01-CA192613 (PD). Thanks to Dr. H.F. Young and the Betts family fund for support in the purchase of the Hermes Wiscan instrument. The authors have no conflicts of interest to report. The VCU team acknowledges the Sierra Oncology personnel: Dr. Ryan J. Hansen, Dr. Bryan Strouse, Dr. Snezana Milutinovic, and Dr. Christian Hassig who supplied SRA737 and reagents to perform the studies in the manuscript.
Supplemental data
Supplemental data for this article can be access on the publisher’s website.
Additional information
Funding
References
- Nickoloff JA. Paths from DNA damage and signaling to genome rearrangements via homologous recombination. Mutat Res. 2017;806:64–74. pii: S0027-5107: 30179-8. doi:10.1016/j.mrfmmm.2017.07.008.
- Nikitaki Z, Mavragani IV, Laskaratou DA, Gika V, Moskvin VP, Theofilatos K, Vougas K, Stewart RD, Georgakilas AG. Systemic mechanisms and effects of ionizing radiation: A new ‘old’ paradigm of how the bystanders and distant can become the players. Semin Cancer Biol. 2016;37-38:77–95. doi:10.1016/j.semcancer.2016.02.002.
- Blackford AN, Jackson SP. ATM, ATR, and DNA-PK: the trinity at the heart of the DNA damage response. Mol Cell. 2017;66:801–817. doi:10.1016/j.molcel.2017.05.015.
- Manic G, Obrist F, Sistigu A, Vitale I. Trial Watch: targeting ATM-CHK2 and ATR-CHK1 pathways for anticancer therapy. Mol Cell Oncol. 2015;2:e1012976. doi:10.1080/23723556.2015.1012976.
- Chen Y, Poon RY. The multiple checkpoint functions of CHK1 and CHK2 in maintenance of genome stability. Front Biosci. 2008;13:5016–5029.
- Langerak P, Russell P. Regulatory networks integrating cell cycle control with DNA damage checkpoints and double-strand break repair. Philos Trans R Soc Lond B Biol Sci. 2011;366:3562–3571. doi:10.1098/rstb.2011.0070.
- Zangarini M, Berry P, Sludden J, Raynaud FI, Banerji U, Jones P, Edwards D, Veal GJ. Development and validation of a LC-MS/MS method for the quantification of the checkpoint kinase 1 inhibitor SRA737 in human plasma. Bioanalysis. 2017;9:1001–1010. doi:10.4155/bio-2017-0043.
- Ray Chaudhuri A, Nussenzweig A. The multifaceted roles of PARP1 in DNA repair and chromatin remodelling. Nat Rev Mol Cell Biol. 2017;18:610–621. doi:10.1038/nrm.2017.53.
- Abbotts R, Wilson DM 3rd. Coordination of DNA single strand break repair. Free Radic Biol Med. 2017;107:228–244. doi:10.1016/j.freeradbiomed.2016.11.039.
- Rajawat J, Shukla N, Mishra DP. Therapeutic Targeting of Poly(ADP-Ribose) Polymerase-1 (PARP1) in cancer: current developments, therapeutic strategies, and future opportunities. Med Res Rev. 2017 May 16;37:1461–1491. doi:10.1002/med.21442.
- Kanjanapan Y, Lheureux S, Oza AM. Niraparib for the treatment of ovarian cancer. Expert Opin Pharmacother. 2017;18:631–640. doi:10.1080/14656566.2017.1297423.
- Liu FW, Tewari KS. New targeted agents in gynecologic cancers: synthetic lethality, homologous recombination deficiency, and PARP inhibitors. Curr Treat Options Oncol. 2016;17:12. doi:10.1007/s11864-015-0378-9.
- Wang Z, Wang F, Tang T, Guo C. The role of PARP1 in the DNA damage response and its application in tumor therapy. Front Med. 2012;6:156–164. doi:10.1007/s11684-012-0197-3.
- Nickoloff JA, Jones D, Lee SH, Williamson EA, Hromas R. Drugging the cancers addicted to DNA repair. J Natl Cancer Inst. 2017 Nov 1;109(11). doi:10.1093/jnci/djx007.
- Rajawat J, Shukla N, Mishra DP. Poly(ADP-Ribose) polymerase 1: a therapeutic hope in gynecologic cancers. Front Biosci (Schol Ed). 2017 Jun 1;9:343–356.
- Mitchell C, Park M, Eulitt P, Yang C, Yacoub A, Dent P. Poly(ADP-ribose) polymerase 1 modulates the lethality of CHK1 inhibitors in carcinoma cells. Mol Pharmacol. 2010;78:909–917. doi:10.1124/mol.110.067199.
- Tang Y, Hamed HA, Poklepovic A, Dai Y, Grant S, Dent P. Poly(ADP-ribose) polymerase 1 modulates the lethality of CHK1 inhibitors in mammary tumors. Mol Pharmacol. 2012;82:322–332. doi:10.1124/mol.112.078907.
- Booth L, Cruickshanks N, Ridder T, Dai Y, Grant S, Dent P. PARP and CHK inhibitors interact to cause DNA damage and cell death in mammary carcinoma cells. Cancer Biol Ther. 2013;14:458–465. doi:10.4161/cbt.24424.
- Booth L, Roberts JL, Poklepovic A, Gordon S, Dent P. PDE5 inhibitors enhance the lethality of pemetrexed through inhibition of multiple chaperone proteins and via the actions of cyclic GMP and nitric oxide. Oncotarget. 2017;8:1449–1468. doi:10.18632/oncotarget.13640.
- Booth L, Roberts JL, Sander C, Lee J, Kirkwood JM, Poklepovic A, Dent P. The HDAC inhibitor AR42 interacts with pazopanib to kill trametinib/dabrafenib-resistant melanoma cells in vitro and in vivo. Oncotarget. 2017;8:16367–16386. doi:10.18632/oncotarget.14829.
- Booth L, Roberts JL, Poklepovic A, Dent P. [pemetrexed + sildenafil], via autophagy-dependent HDAC down-regulation, enhances the immunotherapy response of NSCLC cells. Cancer Biol Ther. 2017 Aug 16;18:705–714. doi:10.1080/15384047.2017.1362511.
- Booth L, Roberts JL, Poklepovic A, Kirkwood J. Paul Dent HDAC inhibitors enhance the immunotherapy response of melanoma cells. Oncotarget. 2017. doi:10.18632/oncotarget.17950.
- Booth L, Roberts JL, Poklepovic A, Avogadri-Connors F, Cutler RE, Lalani AS, Dent P. HDAC inhibitors enhance neratinib activity and when combined enhance the actions of an anti-PD-1 immunomodulatory antibody in vivo. Oncotarget. 2017;8. doi:10.18632/oncotarget.v8i52.