
ABSTRACT
PARP1 inhibitors are approved therapeutic agents in ovarian carcinomas, and have clinical activity in some breast cancers. As a single agent, niraparib killed ovarian and mammary tumor cells via an ATM-AMPK-ULK1 pathway which resulted in mTOR inactivation and the formation of autophagosomes, temporally followed by autolysosome formation. In parallel, niraparib activated a CD95-FADD-caspase 8 pathway, and collectively these signals caused tumor cell death that was suppressed by knock down of Beclin1, ATG5, CD95, FADD or AIF; or by expression of c-FLIP-s, BCL-XL or dominant negative caspase 9. The HDAC inhibitors AR42 and sodium valproate enhanced niraparib lethality in a greater than additive fashion. HDAC inhibitors enhanced niraparib lethality by increasing activation of the ATM-AMPK-ULK1-autophagy and CD95-FADD-caspase 8 pathways. Knock down of eIF2α, ATM, AMPKα, ULK1, Beclin1 or ATG5 reduced tumor cell killing by the niraparib plus HDAC inhibitor combination. Blockade of either caspase 9 function or that of cathepsin B partially prevented cell death. As a single agent niraparib delayed tumor growth, but did not significantly alter the tumor control rate. Tumors previously exposed to niraparib had activated the ERK1/2 and AKT-mTOR pathways that correlated with increased plasma levels of IL-8, MIF, EGF, uPA and IL-12. Collectively our findings argue that the addition of HDAC inhibitors to niraparib enhances the anti-cancer activity of the PARP1 inhibitor niraparib.
Keywords:
Introduction
Recently, several inhibitors of poly-ADP ribose polymerase 1 (PARP1) have been approved for the treatment of ovarian cancer. The drug olaparib (Lynparza®) inhibits PARP1 and has been approved for the treatment of ovarian cancers that have been previously treated and have mutations in BRCA1/2; rucaparib (Rubraca®) has a similar mechanism of action as olaparib and is also approved for patients who have been previously treated and have BRCA1/2 mutations.Citation1,Citation2 Niraparib (Zejula) is an inhibitor of PARP1 and PARP2 and is approved for all ovarian cancer patients, regardless of BRCA mutational status, in the second line setting.Citation3
Prior studies from this laboratory have shown that inhibitors of PARP1 can synergize with inhibitors of CHK1 to kill a genetically diverse set tumor cells.Citation4–Citation6 More recently we have demonstrated that the irreversible ERBB1/2/4 inhibitor neratinib synergized with the PARP1 inhibitor niraparib to kill tumor cells.Citation7 In the studies using the CHK1 inhibitors, over-expression of BCL-XL or loss of [BAX/BAK] function, but not the function of the caspase 8/cathepsin substrate BID, suppressed [CHK1 inhibitor + PARP1 inhibitor] lethality. Inhibition of BCL-2 family protein function using chemical inhibitors enhanced CHK1 inhibitor + PARP1 inhibitor lethality and restored drug-induced cell-killing in cells overexpressing BCL-XL. Knock down of ATM enhanced tumor cell killing by PARP1 and CHK1 inhibitors. In the studies using neratinib; neratinib and niraparib interacted to cause an ATM-dependent activation of AMPK which in turn acted to cause mTOR inactivation, ULK-1 activation and ATG13 phosphorylation. Hence, the drugs alone and in combination increased autophagosome and autolysosome levels. Preventing ATM-AMPK signaling by knock down or preventing autophagosome formation by expressing activated mTOR or knocking down of Beclin1, or knock down of the autolysosome protein cathepsin B, reduced cell killing. The drug combination caused an endoplasmic reticulum stress response as judged by enhanced eIF2α phosphorylation that was responsible for reducing MCL-1 and BCL-XL levels and increasing ATG5 and Beclin1 expression. Drug lethality was partially reduced by knock down of apoptosis inducing factor (AIF) and expression of dominant negative caspase 9 was not protective. Thus, for this drug combination, cell killing required the induction of autophagy and was cathepsin B and AIF -dependent, and effector caspase independent.
Other recent studies from our group have demonstrated that HDAC inhibitors can strongly facilitate the induction of autophagosome levels when combined with a variety of agents that cause DNA damage, e.g. pemetrexed (Alimta®) or cause inhibition of protective signal transduction pathways, e.g. neratinib.Citation8–Citation12 As we discovered that niraparib could modestly enhance autophagosome formation, we wished to determine whether HDAC inhibitors, particularly the inexpensive inhibitor sodium valproate, would interact with this PARP1/2 inhibitor in a greater than additive fashion to cause autophagosome formation and to promote tumor cell death.
Results
The recommended dosing and scheduling of niraparib is 300 mg QD for 21 days of a 28-day cycle. This results in a plasma C max of ~ 2 μM after the first dose rising to ~ 3.5 μM at Day 21, with a bioavailability of ~ 75% and a plasma half-life of ~ 36 hours. We routinely performed studies with niraparib at a concentration of 2 μM. Within 12h of exposure, niraparib killed ~ 20% of a diverse range of ovarian and mammary carcinoma cells, that was not significantly further enhanced when tumor cell death was assessed after 24h (). We performed identical studies using the PARP1 inhibitor olaparib and the MEK1/2 inhibitor cobimetinib. As was observed for niraparib, the levels of olaparib-induced cell killing observed at 12h and 24h were very similar (). In contrast to the PARP1 inhibitors, the lethality of cobimetinib was elevated after 24h compared to data at the 12h time point.
Figure 1. PARP1 inhibitors kill ovarian and breast cancer cells. a. Tumor cells were treated with vehicle control or with niraparib (2.0 μM). After 12h and 24h, cells were isolated and viability determined by trypan blue exclusion (n = 3 +/- SD). b. Tumor cells were treated with vehicle control or with olaparib (2.0 μM) or with cobimetinib (100 nM). After 12h and 24h, cells were isolated and viability determined by trypan blue exclusion (n = 3 +/- SD).
PARP1 plays a regulatory role in DNA damage repair, and its absence in a tumor cell can lead to an accumulation of single and double stranded DNA damage. Cells deficient in PARP1 are less capable of activating the DNA damage sensing kinase ATM.Citation13 However, inhibition of PARP1 using PARP1 inhibitors causes double strand DNA breaks and a rapid activation of ATM. Based on this information and our prior studies with PARP1 inhibitors, we determined the molecular mechanisms by which niraparib killed tumor cells.Citation4–Citation6 Niraparib as a single agent caused activation of ATM as judged by increased phosphorylation of ATM S1981 and of γH2AX (). Niraparib also caused increased phosphorylation of AMPKα T172, ULK-1 S317, TSC2 S1469, Raptor T792 and ATG13 S318. Niraparib reduced the phosphorylation of mTOR S2448, mTOR S2481and ULK-1 S757. These changes in protein phosphorylation were associated with increased levels of LAMP2, ATG5, ATG13 and Beclin1 and with reduced expression of p62 (). Niraparib reduced the phosphorylation of AKT T308, STAT3 Y705, p65 NFγB S536 and enhanced the phosphorylation of ERK1/2, eIF2α S51, BAD S112 and JNK1/2 (not shown). Niraparib lowered the expression of MCL-1 and BCL-XL and elevated the levels of BIM (). Similar phosphorylation and protein expression data were obtained in SUM149 TNBC cells that were originally derived from a patient with inflammatory breast cancer (Figures S1 and S2). In agreement with ATG13 S318 becoming phosphorylated, niraparib caused autophagosome formation followed later by autolysosome formation, suggestive that niraparib was enhancing autophagic flux ().
Figure 2. Niraparib activates an ATM-AMPK-ULK1-autophagy pathway. Spiky ovarian cancer cells were treated with vehicle control or niraparib (2 μM), for 4h and 8h. Cells were fixed in place and at least forty cells per condition were imaged in independent triplicate and the intensity ratio of phosphorylated protein levels to total protein expression plotted as a percentage of control treatment (n = 3 +/- SD). # p < 0.05 greater than vehicle control; * p < 0.05 less than vehicle control.
Figure 3. Niraparib reduces the expression of MCL-1 and BCL-XL, enhances BIM levels, and promotes autophagic flux. a. Spiky ovarian cancer cells and SUM149 and BT474 mammary tumor cells were treated with vehicle control or niraparib (2 μM), for 4h and 8h. Cells were fixed in place and at least forty cells per condition were imaged in independent triplicate and the intensity ratio of phosphorylated protein levels to total protein expression plotted as a percentage of control treatment (n = 3 +/- SD). # p < 0.05 greater than vehicle control; * p < 0.05 less than vehicle control. b. Tumor cells were transfected with a plasmid to express LC3-GFP-RFP. Twenty-four h after transfection cells were treated with vehicle control or with niraparib (2 μM) for 4h and 8h. At each time point the mean number of intense GFP+ and RFP+ punctae were determined in at least 40 cells in independent triplicate (n = 3 +/- SD).
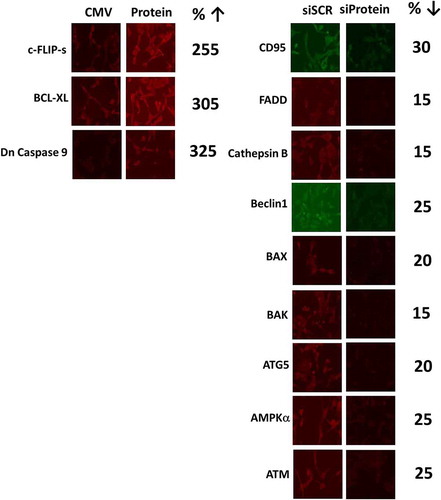
We next performed a broad agnostic screen to determine the molecular mechanisms by which niraparib was killing tumor cells. Knock down of ATM, AMPKα, AIF, BAK, BAX, BID, BIM, Beclin1, ULK-1 or ATG5 partially suppressed niraparib lethality (). Knock down of CD95 or FADD, or over-expression of the caspase 8 inhibitor c-FLIP-s partially prevented tumor cell death (,). Over-expression of the mitochondrial protective protein BCL-XL, to a greater extent than dominant negative caspase 9, suppressed niraparib lethality. Collectively, the data in , and argue that autophagy and the extrinsic apoptosis pathway play key roles in niraparib-induced killing.
Figure 4. Niraparib causes tumor cell killing is reduced by knock down of ATM, AMPK, Beclin1, ATG5 and AIF. a. and b. BT474 and SUM149 mammary cancer cells were transfected with a scrambled siRNA (siSCR) or with validated siRNA molecules to knock down expression of the indicated proteins. In parallel, other portions of cells were transfected to express empty vector (CMV) or to express the indicated proteins. Twenty-four h after transfection cells were treated with vehicle control or with niraparib (2.0 μM) for an additional 24h. Cells were treated with live/dead reagent and the percentage cell death under each condition above that in vehicle control plotted (n = 3 +/- SD). * p < 0.05 less cell death than in the corresponding value in siSCR/CMV treated cells ** p < 0.05 less than corresponding value in cells expressing c-FLIP-s.
Several recent prior studies from our laboratory have demonstrated that a variety of DNA damaging agents can activate an ATM-AMPKα-ULK1-ATG13 pathway to promote autophagosome formation, that is responsible for tumor cell killing.Citation8–Citation12 Niraparib-stimulated ULK-1 S317 and suppressed ULK-1 S757 phosphorylation which required expression of ATM and of AMPKα (,). The inactivation of mTOR was also dependent on signaling by ATM and AMPKα. Similar data were obtained in SUM149 cells (Figure S2). Niraparib-stimulated phosphorylation of ATG13 S318 also required expression of ATM and AMPKα (,). The enhanced phosphorylation of AMPKα T172 and decreased phosphorylation of AKT T308 and p65 NFγB S536 required expression of ATM (). ULK-1 S757 is phosphorylated by mTOR, which reduces ULK-1 activity. Expression of an activated form of mTOR suppressed niraparib-induced autophagosome formation and neratinib-induced lethality (, not shown). Although we were apparently observing a form of autophagic flux, our present data with LAMP2 suggested that some form of lysosomal dysfunction was occurring i.e. LAMP2 levels were increased, whereas with a robust flux they would be degraded. One lysosomal protease we have linked to tumor cell killing by agents that stimulate autophagy is cathepsin B.Citation14 Knock down of cathepsin B suppressed niraparib lethality (). Thus, the release of lysosomal cathepsin B from dysfunctional lysosomes likely plays a key role in niraparib-induced tumor cell killing.
Figure 5. Knock down of ATM or AMPK prevents the dephosphorylation of ULK-1 S757, mTOR S2448 and mTOR S2481, and the phosphorylation of ULK-1 S317. A. and B. Spiky ovarian cancer cells and BT474 mammary cancer cells were treated with vehicle control or with niraparib (2.0 μM), for 6h. Cells were fixed in place and at least forty cells per condition were imaged in independent triplicate and the intensity ratio of phosphorylated protein levels to total protein expression plotted as a percentage of control treatment (n = 3 +/- SD). # p < 0.05 greater than vehicle control; * p < 0.05 less than vehicle control.
Figure 6. Autophagy and lysosomal proteases, downstream of ATM and ATG13, play key roles in niraparib lethality. a. and b. Spiky and BT474 cells were transfected with a scrambled siRNA control or with siRNA molecules to knock down the expression of ATM or AMPKα. After 24h they were treated with vehicle control or with niraparib (2.0 μM). Cells were fixed in place and at least forty cells per condition were imaged in independent triplicate and the intensity ratio of phosphorylated protein levels to total protein expression plotted as a percentage of control treatment (n = 3 +/- SD). # p < 0.05 greater than vehicle control. c. Spiky ovarian cancer cells were transfected with a scrambled siRNA control or with siRNA molecules to knock down the expression of ATM or AMPKα. After 24h they were treated with vehicle control or with niraparib (2.0 μM). Cells were fixed in place and at least forty cells per condition were imaged in independent triplicate and the intensity ratio of phosphorylated protein levels to total protein expression plotted as a percentage of control treatment (n = 3 +/- SD). d. Spiky and BT474 cells were transfected with an empty vector control plasmid or with a plasmid to express activated mTOR. Twenty-four h after transfection cells were treated with vehicle control or with niraparib (2.0 μM). Cell viability after 24h of incubation was determined by live/dead assay (n = 3 +/- SD). * p < 0.05 less than corresponding value in CMV transfected cells. e. Spiky and BT474 cells were transfected with a scrambled siRNA (siSCR) or with siRNA molecules to knock down the expression of cathepsin B or eIF2α. Twenty-four h after transfection cells were treated with vehicle control or with niraparib (2.0 μM). Cell viability after 24h of incubation was determined by live/dead assay (n = 3 +/- SD). * p < 0.05 less than corresponding value in siSCR cells.
Thus, our data confirms that one mode of niraparib toxicity proceeds from the induction of DNA damage and the activation of ATM, through AMPKα which causes both TSC2 and Raptor phosphorylation leading to mTOR inactivation, and directly causes enhanced ULK-1 S317 phosphorylation. ULK-1 S757 is an mTOR substrate and in agreement with mTOR inactivation, niraparib reduces ULK-1 S757 phosphorylation. The changes in ULK-1 phosphorylation are associated with its kinase activation which is reflected in the enhanced phosphorylation of the ULK-1 direct substrate ATG13 S318. Increased ATG13 S318 phosphorylation promotes autophagosome formation, which, based on the knock down data for Beclin1, ATG5 and ULK-1 in viability assays, argues that autophagy is facilitating tumor cell death.
Studies from ourselves and others have demonstrated that HDAC inhibitors can enhance autophagosome formation, promote endoplasmic reticulum stress signaling and cause expression and activation of death receptor pathways.Citation15 The generic HDAC inhibitor sodium valproate enhanced the lethality of niraparib (,). Similar data were obtained using the more potent HDAC inhibitor AR42 (data not shown). We next determined the changes in protein phosphorylation and protein expression in cells exposed to [niraparib + valproate]. Niraparib and valproate interacted to cause greater phosphorylation of ATM S1981, AMPKα T172, ULK-1 S317 and ATG13 S318 (). Of particular note, whereas niraparib and valproate both predominantly caused activation of nuclear-localized ATM, the drug combination induced a profound cytoplasmic ATM signal. Valproate and niraparib interacted to cause greater dephosphorylation of ULK-1 S757, mTOR S2448, mTOR S2481, ERK1/2, AKT T308 and STAT3 Y705. The phosphorylation of eIF2α S51 was not significantly enhanced beyond the single agents by the drug combination nor was the expression of Beclin1. However, niraparib and valproate did interact to enhance ATG5 levels.
Figure 7. Sodium valproate enhances niraparib lethality. a. Tumor cells were treated with vehicle control, niraparib (2.0 μM), sodium valproate (250 μM) or the drugs in combination for 24h. Cells were isolated and viability determined by live/dead assay (n = 3 +/- SD). b. Tumor cells were treated with vehicle control, niraparib (2.0 μM), sodium valproate (250 μM) or the drugs in combination for 24h. Cells were isolated and viability determined by a trypan blue exclusion assay (n = 3 +/- SD).
Figure 8. The [niraparib + valproate] combination activates cytosolic ATM which is associated with elevated activation of AMPK and ULK-1, and enhanced inactivation of mTOR, AKT, ERK1/2 and STAT3. Upper Images: Spiky ovarian cancer cells were treated with vehicle control, niraparib (2.0 μM), sodium valproate (250 μM) or the drugs in combination for 6h. Cells were fixed in place and at least forty cells per condition were imaged in independent triplicate and the intensity ratio of phosphorylated protein levels to total protein expression indicated as a percentage of control treatment (n = 3 +/- SD). # p < 0.05 greater than vehicle control; * p < 0.05 less than vehicle control. Lower Graph: Spiky ovarian cancer cells were treated with vehicle control, niraparib (2.0 μM), sodium valproate (250 μM) or the drugs in combination for 6h. Cells were fixed in place and at least forty cells per condition were imaged in independent triplicate and the intensity ratio of phosphorylated protein levels to total protein expression plotted as a percentage of control treatment (n = 3 +/- SD). # p < 0.05 greater than vehicle control; * p < 0.05 less than vehicle control.
![Figure 8. The [niraparib + valproate] combination activates cytosolic ATM which is associated with elevated activation of AMPK and ULK-1, and enhanced inactivation of mTOR, AKT, ERK1/2 and STAT3. Upper Images: Spiky ovarian cancer cells were treated with vehicle control, niraparib (2.0 μM), sodium valproate (250 μM) or the drugs in combination for 6h. Cells were fixed in place and at least forty cells per condition were imaged in independent triplicate and the intensity ratio of phosphorylated protein levels to total protein expression indicated as a percentage of control treatment (n = 3 +/- SD). # p < 0.05 greater than vehicle control; * p < 0.05 less than vehicle control. Lower Graph: Spiky ovarian cancer cells were treated with vehicle control, niraparib (2.0 μM), sodium valproate (250 μM) or the drugs in combination for 6h. Cells were fixed in place and at least forty cells per condition were imaged in independent triplicate and the intensity ratio of phosphorylated protein levels to total protein expression plotted as a percentage of control treatment (n = 3 +/- SD). # p < 0.05 greater than vehicle control; * p < 0.05 less than vehicle control.](/cms/asset/b3ce83f7-6e70-486f-8060-1a5b851f69e4/kcbt_a_1472190_f0008_oc.jpg)
Valproate and niraparib interacted to cause greater levels of autophagosome and subsequent autolysosome formation (). As observed for niraparib alone, the lethality of the [niraparib + valproate] combination was reduced by knock down of ATM, AMPKα, Beclin1, ATG5, BAX, BAX and FADD (,). Over-expression of c-FLIP-s and BCL-XL, or expression of dominant negative caspase 9, also suppressed drug combination lethality. We next determined whether valproate and niraparib interacted to enhance activation of CD95. Niraparib and valproate interacted in a greater than additive fashion to cause CD95 activation (as judged by cell surface localization) (). Increased cell surface localization of CD95 was observed as early as 1 hour after exposure of cells to the drugs.
Figure 9. Valproate enhances the ability of niraparib to cause autophagy and CD95 activation. a. Spiky ovarian cancer cells were transfected with a plasmid to express LC3-GFP-RFP. Twenty-four h after transfection cells were treated with vehicle control, niraparib (2 μM), valproate (250 μM) or the drugs in combination for 4h and 8h. At each time point the mean number of intense GFP+ and RFP+ punctae were determined in at least 40 cells in independent triplicate (n = 3 +/- SD). b. and c. Spiky cancer cells were transfected with a scrambled siRNA control (siSCR) or with validated siRNA molecules to knock down the expression of the indicated proteins. In parallel cells were also transfected with an empty vector plasmid (CMV) or with plasmids to express c-FLIP-s, BCL-XL or dominant negative caspase 9. Twenty-four h after transfection cells were treated with vehicle control or with [niraparib (2 μM) + valproate (250 μM)] in combination for 24h. Cells were isolated and viability determined by trypan blue exclusion (n = 3 +/- SD). d. Spiky cancer cells were treated with vehicle control, niraparib (2 μM), valproate (250 μM) or the drugs in combination, as indicated for up to 6h. At each indicated time point, cells were fixed in place and not permeabilized. Immunostaining was performed to detect the cell surface levels of the death receptor CD95 (n = 3 +/- SD).
![Figure 9. Valproate enhances the ability of niraparib to cause autophagy and CD95 activation. a. Spiky ovarian cancer cells were transfected with a plasmid to express LC3-GFP-RFP. Twenty-four h after transfection cells were treated with vehicle control, niraparib (2 μM), valproate (250 μM) or the drugs in combination for 4h and 8h. At each time point the mean number of intense GFP+ and RFP+ punctae were determined in at least 40 cells in independent triplicate (n = 3 +/- SD). b. and c. Spiky cancer cells were transfected with a scrambled siRNA control (siSCR) or with validated siRNA molecules to knock down the expression of the indicated proteins. In parallel cells were also transfected with an empty vector plasmid (CMV) or with plasmids to express c-FLIP-s, BCL-XL or dominant negative caspase 9. Twenty-four h after transfection cells were treated with vehicle control or with [niraparib (2 μM) + valproate (250 μM)] in combination for 24h. Cells were isolated and viability determined by trypan blue exclusion (n = 3 +/- SD). d. Spiky cancer cells were treated with vehicle control, niraparib (2 μM), valproate (250 μM) or the drugs in combination, as indicated for up to 6h. At each indicated time point, cells were fixed in place and not permeabilized. Immunostaining was performed to detect the cell surface levels of the death receptor CD95 (n = 3 +/- SD).](/cms/asset/9f216d38-9916-4490-abea-b309dacc7d3b/kcbt_a_1472190_f0009_oc.jpg)
Based on the data in –, we next performed animal studies using niraparib. HER2+ BT474 mammary carcinoma cells were injected into the 4th mammary fat pad of female athymic mice, tumors permitted to form, and then animals were treated with a clinically relevant dose of niraparib for five days. Niraparib significantly slowed the growth of the BT474 tumors, however, the growth delay caused by niraparib alone was only approximately equivalent to the prior duration of drug exposure (). We then determined changes in mouse plasma human cytokine levels caused by niraparib, as well as changes in the phosphorylation of intracellular signal transduction proteins. Exposure of tumors to niraparib initially enhanced the plasma levels of TGFβ1 and lowered the levels of TGFβ2 (). Exposure to niraparib initially at Day 8 reduced the plasma levels of EGF, IL-18, PAI-1, uPA and VEGFA, with PLGF also trending lower (). The levels of EGF, PLGF, PAI-1 and uPA rebounded in plasma collected at animal termination. The levels of HB-EGF and VEGFC in niraparib treated animals declined by Day 18. This data argues that for tumor cells that had evolved and grown following niraparib exposure, they had caused the plasma levels of multiple human pro-growth cytokines had been increased and the levels of a cytokine that can cause growth arrest and senescence, TGFβ, had declined.
Figure 10. Niraparib suppresses the growth of BT474 mammary tumors. a. BT474 cells (2 × 10⁶) were implanted into the 4th mammary fat pad of athymic mice. Tumors permitted to form until the mean tumor volume was ~ 25 mm3. Animals were then segregated into groups with near identical mean volumes and the animals then treated for five days with the indicated therapeutic agents: vehicle control (cremophore) or niraparib 25 mg/kg (QD Days 1–5). Tumor volumes were measured prior to drug administration and every three days after the initiation of therapeutic interventions. (n = 10 mice per group +/-SEM). For BT474 cells when the volume of the tumor reached > 500 mm3, animals were humanely sacrificed and the tumor and blood removed for further studies. b.-c. Multiplex assays were performed using a Bio-Rad MAGPIX machine. Serum/tumor material was obtained at Day 8 (D8) or at termination of the study (T). Plasma was obtained from three separate animals and assayed in duplicate (n = 6 determinations +/- SEM). # p < 0.05 greater than value in vehicle control treated mice; * p < 0.05 less than value in vehicle control treated mice; ¶ p < 0.05 greater than corresponding value at Day 8; ¶¶ p < 0.05 less than corresponding value at Day 8.
Additional multiplex assays were performed to examine the levels of cytokine and soluble receptor fragments. BT474 is a HER2+ cell line and exposure of tumors to niraparib reduced the levels of soluble human ERBB2 in mouse plasma (). The plasma levels of HGF, G-CSF, leptin and osteopontin had also decreased by Day 18. In a manner similar to that for EGF, the plasma levels of soluble IL-6 receptor initially declined and then rebounded (,). The plasma levels of interferon β and IL-10 were initially enhanced at Day 8, but by Day 18 had declined below baseline. The levels of IL-12 were transiently elevated at Day 8. As were the levels of TNFSF13 and soluble TNFR2. The plasma levels of IL-8 followed a similar pattern to that observed for EGF and the soluble IL-6 receptors with an initial decline at Day 8 followed by a rebound by Day 18 (). Animals exposed to niraparib had reduced their plasma levels of CXCL16 and enhanced the levels of CXCL12. We also compared the human cytokines detected in the tumor itself and compared them to the plasma levels of the same proteins. In the tumor, the levels of human IL-8, human IL-1β and human MIF were elevated an order of magnitude beyond their levels in the plasma, and furthermore, whilst the plasma levels of IL-8, IL-1β and MIF were observed to change after niraparib exposure, with Day 18 plasma values being significantly enhanced compared to control, no alterations in the tumor-associated IL-8, IL-1β and MIF were detected. In contrast, both the plasma and the tumor exhibited increased IL-10 levels on Day 8 ( and ). These data suggest that the ability of niraparib-adapted BT474 cells to secrete IL-8, IL-1β and MIF is increased.
Figure 11. Multiplex analyses of plasma from niraparib treated mice. A. and B. Multiplex assays were performed using a Bio-Rad MAGPIX machine. Plasma was obtained at Day 8 (D8) or at termination of the study (T). Material was obtained from three separate animals and assayed in duplicate for changes in protein phosphorylation (n = 6 determinations +/- SEM). # p < 0.05 greater than value in vehicle control treated mice; * p < 0.05 less than value in vehicle control treated mice; ¶ p < 0.05 greater than D8 value.
Figure 12. Multiplex analyses of plasma and tumor tissues from niraparib-treated mice. Multiplex assays were performed using a Bio-Rad MAGPIX machine. Plasma and tumor material was obtained at Day 8 (D8) or at termination of the study (T). Material was obtained from three separate animals and assayed in duplicate for changes in protein phosphorylation (n = 6 determinations +/- SEM). # p < 0.05 greater than value in vehicle control treated mice; * p < 0.05 less than value in vehicle control treated mice; ¶ p < 0.05 greater than D8 value.
In addition to examining the levels of cytokines in the BT474 tumors, we also examined the changes in protein phosphorylation of intracellular signaling proteins. Tumors previously exposed to niraparib had enhanced the potential for ERK1/2 signaling as judged by increased phosphorylation of MEK1 and p90rsk, yet without activation of ERK1/2 (). Niraparib initially enhanced signaling through the PI3K pathway at Day 8 as judged by elevated phosphorylation of AKT S473, p70S6K T389, PTEN S380, GSK3 S9/S21, mTOR S2448 and S6 S235/S236. However, at Day 18 the phosphorylation of S6 had returned to baseline and the phosphorylation of AKT S473, p70 S6K T389, mTOR S2448 and GSK3 S9/S21 were all below baseline. These data suggest that BT474 cells, in response to niraparib, initially utilize both the MEK1/2 and PI3K pathways as survival signaling modules, but that by Day 18 MEK1/2 signaling was likely playing the greater role in survival.
Discussion
The present studies were performed to determine whether the generic cost-effective HDAC inhibitor sodium valproate could enhance the efficacy of the FDA approved PARP1 inhibitor niraparib; and define the molecular mechanisms by which the drugs interact to kill. We discovered that niraparib interacted with valproate in a synergistic fashion to kill mammary and ovarian cancer cells.
Niraparib as a single agent caused activation of DNA damage response signaling. Niraparib-induced the activation of ATM which resulted in activation of the AMPK and ULK-1, concomitant with inactivation of mTOR, collectively leading to enhanced ATG13 S318 phosphorylation and elevated levels of autophagosome formation. Over time autophagosome levels declined and autolysosome levels increased suggestive of autophagic flux occurring. Knock down of the autophagy regulatory proteins Beclin1 or ATG5 significantly reduced niraparib lethality. However, knock down of CD95 or FADD expression, or over-expression of the caspase 8/10 inhibitor c-FLIP-s, also significantly reduced niraparib lethality. Downstream of CD95 and autophagy, at the level of the mitochondrion, over-expression of BCL-XL or expression of dominant negative caspase 9, or knock down of AIF or cathepsin B, suppressed niraparib-killing. Thus, niraparib lethality causes a complex apo-necrotic form of tumor cell death.Citation16 The ability of toxic BH3 domain proteins to cause tumor cell death varied between cell lines with all tested cells requiring BAX, but differentially requiring expression of BAK, BAD and BIM to kill. Expression of an activated form of mTOR prevented autophagosome formation and significantly reduced niraparib lethality.
Multiple prior studies from our laboratory have demonstrated that HDAC inhibitors can enhance the induction of autophagosomes caused by another agent, e.g. neratinib.Citation8–Citation10 Sodium valproate significantly enhanced the ability of niraparib to elevate autophagosome, and subsequently autolysosome, levels. The drug combination enhanced ATM activation in a greater than additive fashion, and furthermore, the combination but not the individual agents caused a profound activation of cytosolic ATM. This greater activation of ATM was also reflected in the stronger activation of AMPK and ULK-1, and the enhanced inactivation of mTOR, ERK1/2, AKT and STAT3. In contrast, the drug combination did not interact to further enhance eIF2α phosphorylation or to increase Beclin1 expression. Against the drug combination, knock down of proteins or over-expression of proteins that were known to regulate autophagy and apoptosis in response to niraparib as a single agent were less effective at preventing the [niraparib + valproate] killing. Of more significance in defining the mechanism by which the drugs synergized to kill, we discovered that as a single agent niraparib caused a ~ 50% increase in CD95 activation whereas the drug combination caused a prolonged ~ 400% activation. This 400% induction of CD95 signaling was approximately twice the arithmetic level of death receptor activation caused by niraparib and valproate combined as single agents. Prior studies from our group examining mechanisms of CD95 activation have linked the phenomenon to elevated levels of the sphingolipid ceramide and to increase production of reactive oxygen species. Valproate can elevate ROS levels.Citation17 Preliminary evidence argues that the ROS quenching agent N-acetyl cysteine can significantly lower the lethality of the drug combination (Booth and Dent, Unpublished observations). Experiments to fully understand the ceramide- and ROS-dependent mechanisms by which niraparib and valproate interact to activate CD95 will need to the subject of a follow-up study/manuscript.
As a single agent, niraparib slowed the growth of mammary tumor cells, but the three-day tumor growth delay caused by the drug corresponded to significantly less than the five-day duration of the drug exposure. This data implies that the niraparib treated cells, post-therapy, are re-growing more rapidly than those exposed to vehicle control. In tumor-baring animals, previously exposed to niraparib, the evolved tumors secreted elevated levels of the human growth factors/cytokines: EGF, PAI-1, PLGF, uPA, IL-1b, IL-8, IL-10, IL-12, MIF and CXCL-12. In parallel the levels of other growth factors/cytokines declined in drug treated animal plasma: HB-EGF, G-CSF, HGF, leptin, osteopontin and interferon beta. The levels of soluble ERBB2, soluble IL-6 receptors, and soluble TNFR2 were reduced in drug-treated animals. Within the tumor cells themselves, the activities of MEK1/2 and p90rsk were enhanced whereas the activities of AKT, p70S6K, and mTOR declined which correlated with decreased GSK3 phosphorylation, i.e. GSK3 activation. Elevated plasma levels of EGF, PAI-1, PLGF, uPA, IL-8 and MIF all predict for an enhanced rate of tumor regrowth, which correlates well with the tumor growth data and the enhanced MEK/p90 and S6 phosphorylation. The PI3K pathway, despite elevated S6 phosphorylation, appeared to be less active in niraparib treated tumors with AKT, p70 S6K and mTOR all exhibiting lower phosphorylation levels. This implies niraparib-adapted cells may be more capable of forming autophagosomes than vehicle control treated cells.
The activation of GSK3 is also important in the biology of niraparib-adapted tumors, as the regulation of glucose storage within the cell via glycogen synthase will be impacted.Citation18 GSK3-induced phosphorylation of glycogen synthase leads to reduced synthase activity, implying that niraparib-adapted tumor cells will have less stored glucose (glycogen), and that any glucose taken up within the adapted cell will more likely be utilized for metabolic processes rather than being stored. In cells with an abundant supply of glucose, regardless of how the glucose is metabolized, ATP levels will be high and AMP levels will be low. Under these conditions, we would predict for lower AMPK activity and a reduced potential for that enzyme to promote autophagosome formation. Hence, in contrast to vehicle control exposed tumor cells, the cells that have become niraparib-adapted, based on the predicted lower activities of both mTOR and AMPK, are primed to undergo autophagic processes whenever glucose levels decline, AMP levels increase, and the AMPK is activated to promote ULK-1 S317 and ATG13 S318 phosphorylation. Whether niraparib-adapted tumor cells exhibit a greater sensitivity to lower glucose levels or to therapeutics which disrupt glucose metabolism, e.g. 2-deoxy glucose, will require studies outside of the scope of the present manuscript.
Immunotherapy approaches using checkpoint inhibitory antibodies are approved in many tumor types, e.g. NSCLC and melanoma, though approval has not occurred for either ovarian or mammary carcinomas.Citation9–Citation12 We found that niraparib, alone or in the presence of valproate, altered the expression of proteins whose functions alter tumor cell immunogenicity (Figure S3). Niraparib interacted with valproate to reduce the expression of PD-L1, PD-L2 and IDO-1, and to enhance the expression of MHCA. The combination also caused the extracellular release of the immunogenic protein HMGB1. Thus, our two-agent combination of [niraparib + valproate] has the potential to both kill tumor cells but also to opsonize them to the anti-tumor effects of checkpoint inhibitory antibodies. Further animal studies, to demonstrate the in vivo interaction between niraparib and valproate, and to determine whether [niraparib + valproate] opsonizes tumor cells to checkpoint inhibitory immunotherapy antibodies will be performed in future studies.
Materials and methods
Materials
Valproate, cobimetinib, olaparib and niraparib were purchased from Selleckchem (Houston TX). Cell culture materials were purchased from GIBCOBRL (GIBCOBRL Life Technologies, Grand Island, NY). Established cell lines were purchased from the ATCC. Spiky ovarian cancer cells were kindly provided by Dr. Karen Paz (Champions Oncology, NJ). Commercially available validated short hairpin RNA molecules to knock down RNA/protein levels were from Qiagen (Valencia, CA) (). Reagents and the performance of experimental procedures were all as described in refs 7–12.
Figure 13. Control studies demonstrating the knock down and over-expression of proteins, manipulated in the present studies. The percentage of protein remaining after knock-down is presented. The percentage increase of the expressed protein is presented.
Methods
Culture, Transfection and in vitro exposure of cells to drugs. All cell lines were cultured at 37°C (5% (v/v CO2) in vitro using RPMI supplemented with 5% (v/v) fetal calf serum and 10% (v/v) Non-essential amino acids.Citation7–Citation12 Cells were transfected with siRNA molecules or plasmids as described in prior manuscripts.Citation7–Citation12
Detection of cell viability, protein expression and protein phosphorylation by immuno-fluorescence using a Hermes WiScan machine. http://www.idea-bio.com/.Citation7–Citation12 Live/dead assays used a live-dead reagent (Thermo Fisher Scientific, Waltham MA) and we visualized cells at 10X magnification. Green cells = viable; yellow/red cells = dying/dead. For immuno-fluorescence studies, cells were visualized at either 10X or 60X. All immuno-fluorescent images for each individual protein/phospho-protein were taken using the identical machine settings. Images were processed at 9999 dpi using Adobe Photoshop, and figures generated in Microsoft PowerPoint.Citation7–Citation12
Detection of cell death by Trypan Blue assay. Viability was determined microscopically using a hemocytometer. Five hundred cells from randomly chosen fields were counted and the number of dead cells was counted and expressed as a percentage of the total number of cells counted.
Assessment of autophagy: Cells were transfected with a plasmid to express a green fluorescent protein (GFP) and red fluorescent protein (RFP) tagged form of LC3 (ATG8). GFP punctae detect autophagosome formation and RFP punctae detect autolysosome formation.Citation7–Citation12
Animal Studies: Niraparib treatment: Studies were performed per USDA regulations under VCU IACUC protocol AD20008. BT474 cells (2 × 10⁶) were implanted into the 4th mammary fat pad of athymic mice. Tumors permitted to form until the mean tumor volume was ~ 25 mm3. Animals were then segregated into groups with near identical mean volumes and the animals then treated for five days with the indicated therapeutic agents: vehicle control (cremophore) or niraparib 25 mg/kg (QD Days 1–5). Tumor volumes were measured prior to drug administration and every three days after the initiation of therapeutic interventions. (n = 10 mice per group ± SEM). Before, during and after drug treatment tumors are calipered as indicated in the Figure and tumor volume was assessed up to 18 days later. For BT474 cells when the volume of the tumor reached > 500 mm3, animals were humanely sacrificed and the tumor and blood removed for further studies.
Multiplex assays. Were performed as previously described using a Bio-Rad MAGPIX machine in references 7–12.
Data analysis. Comparison of the effects of various treatments (performed in triplicate three times) was using one-way analysis of variance and a two tailed Student’s t-test. Statistical examination of in vivo animal survival data utilized both a two tailed Student’s t-test and log rank statistical analyses between the different treatment groups. Differences with a p-value of < 0.05 were considered statistically significant. Experiments shown are the means of multiple individual points from multiple experiments (± SEM).
Disclosure of Potential Conflicts of Interest
No potential conflict of interest was reported by the authors.
Abbreviations
ERK extracellular regulated kinase
PI3K phosphatidyl inositol 3 kinase
ca constitutively active
dn dominant negative
ER endoplasmic reticulum
AIF apoptosis inducing factor
AMPK AMP-dependent protein kinase
mTOR mammalian target of rapamycin
JAK Janus Kinase
STAT Signal Transducers and Activators of Transcription
MAPK mitogen activated protein kinase
PTEN phosphatase and tensin homologue on chromosome ten
ROS reactive oxygen species
CMV empty vector plasmid or virus
si small interfering
SCR scrambled
PDE phospho-diesterase
IP immunoprecipitation
VEH vehicle
NIR niraparib
VAL sodium valproate
SIL sildenafil
HDAC histone deacetylase
Supplemental Material
Download PDF (907.7 KB)Acknowledgments
Support for the present study was funded from philanthropic funding from Massey Cancer Center, the Universal Inc. Chair in Signal Transduction Research and PHS R01-CA192613 (PD). Thanks to Dr. H.F. Young and the Betts family fund for support in the purchase of the Hermes Wiscan instrument. The authors have no conflicts of interest to report.
Supplemental data
Supplemental data for this article can be access on the publisher’s website.
Additional information
Funding
References
- McCann KE. Novel poly-ADP-ribose polymerase inhibitor combination strategies in ovarian cancer. Curr Opin Obstet Gynecol. 2018;30:7–16. doi:10.1097/GCO.0000000000000428.
- Ohmoto A, Yachida S. Current status of poly(ADP-ribose) polymerase inhibitors and future directions. Onco Targets Ther. 2017;10:5195–5208. doi:10.2147/OTT.S139336.
- Caruso D, Papa A, Tomao S, Vici P, Panici PB, Tomao F. Niraparib in ovarian cancer: results to date and clinical potential. Ther Adv Med Oncol. 2017;9:579–588. doi:10.1177/1758834017718775.
- Booth L, Cruickshanks N, Ridder T, Dai Y, Grant S, Dent P. PARP and CHK inhibitors interact to cause DNA damage and cell death in mammary carcinoma cells. Cancer Biol Ther. 2013;14:458–465. doi:10.4161/cbt.24424.
- Tang Y, Hamed HA, Poklepovic A, Dai Y, Grant S, Dent P. Poly(ADP-ribose) polymerase 1 modulates the lethality of CHK1 inhibitors in mammary tumors. Mol Pharmacol. 2012;82:322–332. doi:10.1124/mol.112.078907.
- Mitchell C, Park M, Eulitt P, Yang C, Yacoub A, Dent P. Poly(ADP-ribose) polymerase 1 modulates the lethality of CHK1 inhibitors in carcinoma cells. Mol Pharmacol. 2010;78:909–917. doi:10.1124/mol.110.067199.
- Booth L, Roberts JL, Samuel P, Avogadri-Connors F, Cutler RE, Lalani AS, Poklepovic A, Dent P. The irreversible ERBB1/2/4 inhibitor neratinib interacts with the PARP1 inhibitor niraparib to kill ovarian cancer cells. Cancer Biol Ther. 2018 Feb;6:1–9. doi:10.1080/15384047.2018.1436024.
- Booth L, Roberts JL, Poklepovic A, Avogadri-Connors F, Cutler RE, Lalani AS, Dent P. HDAC inhibitors enhance neratinib activity and when combined enhance the actions of an anti-PD-1 immunomodulatory antibody in vivo. Oncotarget. 2017;8:90262–90277. doi:10.18632/oncotarget.21660.
- Booth L, Roberts JL, Poklepovic A, Kirkwood J, Sander C, Avogadri-Connors F, Cutler RE Jr., Lalani AS, Dent P. The levels of mutant K-RAS and mutant N-RAS are rapidly reduced in a Beclin1/ATG5 -dependent fashion by the irreversible ERBB1/2/4 inhibitor neratinib. Cancer Biol Ther. 2018;19:132–137. doi:10.1080/15384047.2017.1394556.
- Booth L, Roberts JL, Rais R, Kirkwood J, Avogadri-Connors F, Cutler RE Jr., Lalani AS, Poklepovic A, Dent P. [Neratinib + Valproate] exposure permanently reduces ERBB1 and RAS expression in 4T1 mammary tumors and enhances M1 macrophage infiltration. Oncotarget. 2017;9:6062–6074. doi:10.18632/oncotarget.23681.
- Booth L, Roberts JL, Poklepovic A, Kirkwood J, Dent P. HDAC inhibitors enhance the immunotherapy response of melanoma cells. Oncotarget. 2017;8:83155–83170. doi:10.18632/oncotarget.17950.
- Booth L, Roberts JL, Poklepovic A, Dent P. [pemetrexed + sildenafil], via autophagy-dependent HDAC downregulation, enhances the immunotherapy response of NSCLC cells. Cancer Biol Ther. 2017;18:705–714. doi:10.1080/15384047.2017.1362511.
- Aguilar-Quesada R, Muñoz-Gámez JA, Martín-Oliva D, Peralta A, Valenzuela MT, Matínez-Romero R, Quiles-Pérez R, Menissier-de Murcia J, de Murcia G, de Almodóvar MR, et al. Interaction between ATM and PARP-1 in response to DNA damage and sensitization of ATM deficient cells through PARP inhibition. BMC Mol Biol. 2007;8:29. doi:10.1186/1471-2199-8-29.
- Yacoub A, Park MA, Hanna D, Hong Y, Mitchell C, Pandya AP, Harada H, Powis G, Chen CS, Koumenis C, et al. OSU-03012 promotes caspase-independent but PERK-, cathepsin B-, BID-, and AIF-dependent killing of transformed cells. Mol Pharmacol. 2006;70:589–603. doi:10.1124/mol.106.025007.
- Booth L, Roberts JL, Cruickshanks N, Tavallai S, Webb T, Samuel P, Conley A, Binion B, Young HF, Poklepovic A, et al. PDE5 inhibitors enhance celecoxib killing in multiple tumor types. J Cell Physiol. 2015;230:1115–1127. doi:10.1002/jcp.24843.
- Goodall ML, Cramer SD, Thorburn A. Autophagy complexes cell death by necroptosis. Oncotarget. 2016;7:50818–50819. doi:10.18632/oncotarget.10640.
- Park MA, Mitchell C, Zhang G, Yacoub A, Allegood J, Häussinger D, Reinehr R, Larner A, Spiegel S, Fisher PB, et al. Vorinostat and sorafenib increase CD95 activation in gastrointestinal tumor cells through a Ca(2+)-de novo ceramide-PP2A-reactive oxygen species-dependent signaling pathway. Cancer Res. 2010;70:6313–6324. doi:10.1158/0008-5472.CAN-10-0999.
- Dent P, Campbell DG, Hubbard MJ, Cohen P. Multisite phosphorylation of the glycogen-binding subunit of protein phosphatase-1G by cyclic AMP-dependent protein kinase and glycogen synthase kinase-3. FEBS Lett. 1989;248:67–72.