
ABSTRACT
Nasopharyngeal carcinoma (NPC) is a highly prevalent disease in Southeast Asia. The disease is typically diagnosed in the later stages, and chemotherapy resistance often causes treatment failure. To investigate the underlying mechanisms of drug resistance, we searched for chemoresistant-associated proteins in NPC and drug-resistant NPC cell lines using isobaric tags for relative and absolute quantitation combined with nano liquid chromatography-tandem mass spectrometry. The chemoresistant NPC cell lines CNE1DDP and CNE2DDP were resistant to 1 mg/L cisplatin, had resistant indexes of 4.58 and 2.63, respectively, and clearly grew more slowly than the NPC cell lines CNE1 and CNE2. Using three technical replicates, we identified 690 nonredundant proteins, 56 of which were differentially expressed in both groups of cell lines (CNE1 vs. CNE1DDP and CNE2 vs. CNE2DDP). Gene Ontology, KEGG pathway, and miRNA analyses and protein-protein interactions of differentially expressed proteins showed that proteins TRIM29, HSPB1, CLIC1, ANXA1, and STMN1, among others, may play a role in the mechanisms of chemoresistance in clinical therapy. The chemotherapy-resistant proteomic profiles obtained may allow the identification of novel biomarkers for early detection of chemoresistance in NPC and other cancers.
Introduction
Nasopharyngeal carcinoma (NPC) is a squamous cell carcinoma extremely prevalent in Southeast Asia and southern regions of China such as Guangdong, Hunan, and Guangxi Provinces.Citation1–Citation4 Because of its special physiological anatomy, atypical symptoms in the early stages, and poor accessibility for physical examination, patients with this highly frequent malignancy are often overlooked, misdiagnosed, or diagnosed at late stages. Due to the highly frequent occurrence of poorly differentiated NPC, its high speed of growth and invasion, and the development of distant metastasis in lymph nodes, the mechanisms underlying the disease must be better understood. Most patients at later stages have poor prognosis when treated with radiotherapy only, as the recommended treatment is radiotherapy combined with chemotherapy.Citation5–Citation7 However, drug resistance often causes chemotherapy failure.Citation8,Citation9 Although the mechanisms of resistance to chemotherapeutic drugs have been explored, finding the molecular markers or targets is still difficult.Citation10,Citation11 As a result, treatment failure remains an important problem.
To improve NPC diagnosis and treatment, biomarkers have been analyzed at both molecular and cellular levels. A large number of differentially expressed proteins have been identified and reported as potential biomarkers for metastasis, diagnosis, and prognosis of disease.Citation12–Citation15 Recently, proteomic technologies such as two-dimensional difference gel electrophoresis(2D-PAGE) combined with mass spectrometry have been used to search for new biomarkers.Citation16–Citation20 Solid-phase pH-gradient isoelectric focusing technology has advantages including large sample volume, high resolution, and good reproducibility, and can provide information regarding the isoelectric point and molecular weight of the protein, thereby facilitating the identification of proteins. However, 2D-PAGE technology itself also has some inevitable limitations, primarily in two aspects: low-abundance proteins, owing to limited loading volume, the amount required for mass spectrometry identification is inadequate; very large and very small proteins, very basic proteins, and hydrophobic proteins are difficult to analyze efficiently. Second, the process is time-consuming and laborious, and it is difficult to achieve direct connection with mass spectrometry; furthermore, it is not easy to automate. Even with two-phase fluorescence differential gel electrophoresis, the sensitivity is still not very high and the process is complex, along with multiple limiting factors. The isobaric tags for relative and absolute quantification (iTRAQ) technique provides a powerful approach for screening alterations in protein levels and post-translational modification.Citation21–Citation24 It is based on the differential simultaneous labeling of 4–8 samples followed by two-dimensional liquid chromatography-tandem mass spectrometry (2D-LC-MS/MS), which detects and quantifies molecules using the intensity and scope of mass peaks. iTRAQ is thus suitable for monitoring different states of a disease, different periods of disease development, even pathogenic and pathophysiological mechanisms of disease.Citation25–Citation28 This approach possesses many advantages compared with the traditional proteomic technologies, such as high throughput, good repeatability, high resolution, high accuracy, and other advantages. In particular, iTRAQ allows the accurate identification of small molecular weight, hydrophobic, or low-abundance proteins, and the detection of predictive molecular markers or proteins that traditional techniques fail to detect.
The use of established NPC cell lines and the corresponding chemoresistant cell lines provides a good model for NPC research. To investigate the mechanisms of chemoresistance in NPC, we used iTRAQ labeling combined with MS/MS to compare protein profiles from NPC cell lines and their corresponding drug resistance cell lines. The identified proteins provide new insights on the mechanisms of chemoresistance and may improve clinical therapy of NPC.
Results
The IC50 and RI of drug-resistant cell lines CNE1DDP and CNE2DDP
The IC50 and RI of the drug-resistant cell lines CNE1DDP and CNE2DDP were determined. The IC50 and RI for CDDP, PTX, and 5-Fu of the two drug-resistant cell lines and their parent cell lines are shown in . The drug-resistant cell lines CNE1DDP and CNE2DDP were resistant to CDDP (1 mg/L), with a resistance index of 4.58 and 2.63, respectively. The IC50 and RI of these cell lines in drug-free medium after 15 and 30 days are also shown in .
Table 1. IC50 and RI of cell lines CNE1, CNE2, CNE1DDP, and CNE2DDP for different drugs.
Growth of cell lines CNE1, CNE1DDP, CNE2, and CNE2DDP
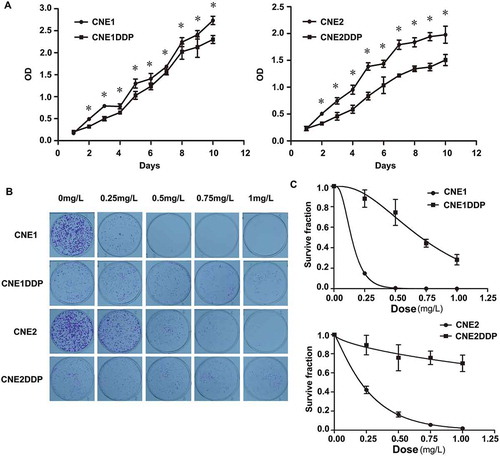
To determine the growth pattern of the two groups of cell lines, the corresponding growth curves were obtained. As shown in , the chemoresistant cell lines grew evidently more slowly than CNE1 and CNE2 from the second day onwards.
Figure 1. Growth curve and colony survival of the four cell lines. (A) Growth curves of CNE1 and CNE1DDP (left) and of CNE2 and CNE2DDP (right) are shown. The chemoresistant cell lines grew evidently more slowly than CNE1 and CNE2 from the second day onwards. The experiments were done in triplicate. Points, mean; bars, S.D.; *, p < 0.05 of chemoresistant vs. parent cell lines by student’s t test. (B) Colony survival assays as described in methods. Colonies were stained with crystal violet and photographed. (C) Plate colony curves showing that the chemoresistant cell lines had higher clonogenic survival rates than the parental cell lines. Data are presented as mean ± SD (*p < 0.05; Student’s t test).
Colony survival rate of the four cell lines
To determine the colony survival rate of the cell lines, cells were treated with CDDP and a colony survival assay was performed. After repeated treatment with different concentrations of CDDP for 10 to 15 days, significant differences in chemoresistant and parental cells were observed. The assay showed that the chemoresistant cell lines had higher clonogenic survival rates than the parental cells ( and ).
Proteomic profile of the four cell lines
Three technical replicates were analyzed to demonstrate the reproducibility of the experimental results and to perform complementation. The proteins identified in the three sets were compared with each other as described in . A total of 1449, 1420, and 1427 nonredundant proteins were identified in the three replicates, and a set of 690 nonredundant proteins were also found in triplicate in the iTRAQ labeling and NanoLC-MS/MS analyses. Detailed information is shown in S1 Table
Table 2. Summary of peptide identification in three technical replicates.
Differentially expressed proteins in the four cell lines
The differentially expressed proteins in drug-resistant cell lines and parental NPC cell lines were identified in the triple iTRAQ results using the following criteria: (1) Proteins identified in all three sets; (2) Proteins identified with ≥ 2 peptide matches; and (3) Average fold-change should be: 114:113 ≥ 1.2 or ≤ 0.83, 119:113 ≥ 1.2 or ≤ 0.83, 119:116 ≥ 1.2 or ≤ 0.83, and 121:116 ≥ 1.2 or ≤ 0.83. Detailed information is shown in S1 Fig. A common set of 56 differentially expressed proteins were found in the 690 proteins among these four cell lines,211 between CNE1 and CNE1DDP, and the 299 between CNE2 and CNE2DDP. These proteins are shown in S2 Table.The MS/MS spectra used for the identification and quantitation of ANXA1, STMN1, and TALDO1 are shown in , those of HSPA8, PRDX1, RCN1, and HSPB1 in , and those of CALD1, PGD, RRM2, SFN, and TRIM29 in .
Figure 2. MS/MS spectra used for identification and quantitation of ANXA1, STMN1, and TALDO1 in CNE1DDP vs. CNE1 and CNE2DDP vs. CNE2. (A) Top, the sequence AAYLQETGKPLDETLK allows the identification of ANXA1 (left), and the iTRAQ reporter ions released provide the relative quantitation of ANXA1 in the four cell lines evaluated (right). Middle, the sequence DLSLEEIQK allows the identification of STMN1 (left), and the iTRAQ reporter ions released provide the relative quantitation of STMN1 in the four cell lines evaluated (right). Bottom, the sequence AAQASDLEK allows the identification of TALDO1 (left), and the iTRAQ reporter ions released provide the relative quantitation of TALDO1 in the two cell lines evaluated (right). Cell lines CNE1 and CNE2 were labeled with iTRAQ reagents 113 and 116, respectively; cell line CNE1DDP was labeled twice with iTRAQ reagents 114 and 119; cell line CNE2DDP was labeled twice with iTRAQ reagents 117 and 121. (B) mRNA expressional levels of the three genes, which were consistent with the MS analysis of the corresponding proteins. Histogram shows the relative gene expression levels in chemoresistant compared to parent cell lines. Bars represent means ± SD; p < 0.05 as determined using Student’s t test.(C) A representative western blotting showing ANXA1 protein levels in cell lines CNE1 and CNE1DDP,CNE2 and CNE2DDP (left); histogram shows the ANXA1 expression levels in the four cell lines as determined by densitometric analysis (right). GAPDH was used as the internal loading control. Bars represent means ± SD; *p < 0.05, as determined using Student’s t test.
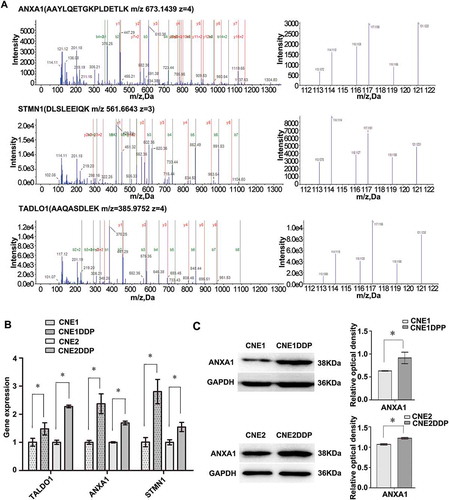
Figure 3. MS/MS spectra used for identification and quantitation of HSPA8, PRDX1, RCN1, and HSPB1 in CNE1DDP vs. CNE1. (A) Top, the sequence DAGTIAGLNVLR allows the identification of HSPA8 (left), and the iTRAQ reporter ions released provide the relative quantitation of HSPA8 in the two cell lines evaluated (right). Upper middle, the sequence ADEGISF allows the identification of PRDX1 (left), and the iTRAQ reporter ions released provide the relative quantitation of PRDX1 in the two cell lines evaluated (right). Lower middle, the sequence AADLNGDLTATR allows the identification of RCN1 (left), and the iTRAQ reporter ions released provide the relative quantitation of RCN1 in the two cell lines evaluated (right). Bottom, the sequence AQLGGPEAAK allows the identification of HSPB1 (left), and the iTRAQ reporter ions released provide the relative quantitation of HSPB1 in the two cell lines evaluated (right). Cell line CNE1 was labeled with iTRAQ reagent 113, and cell line CNE1DDP labeled twice with iTRAQ reagents 114 and 119. (B) mRNA expressional levels of the four genes, which were consistent with the MS analysis of the corresponding proteins. Histogram shows the relative gene expression levels in cell line CNE1DDP compared to those of cell line CNE1. Bars represent means ± SD; p < 0.05, as determined using Student’s t test.
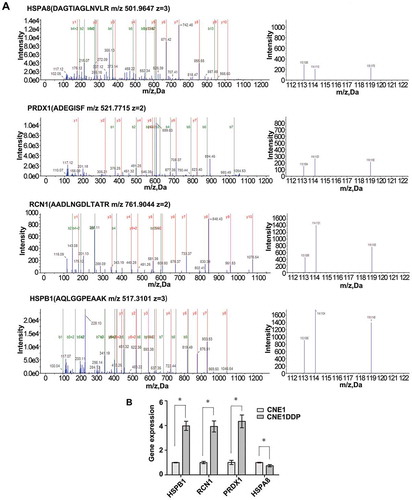
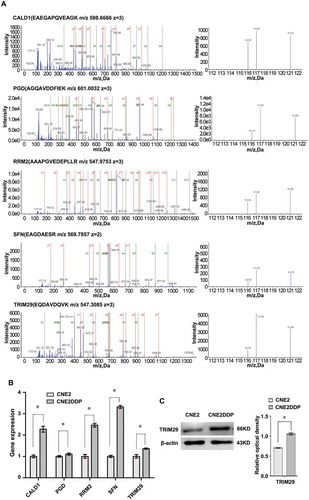
Figure 4. MS/MS spectra used for identification and quantitation of CALD1, PGD, RRM2, SFN, and TRIM29 in CNE2DDP vs. CNE2. (A) Top, the sequence EAEPQVEAGK allows the identification of CALD1 (left), and the iTRAQ reporter ions released provide the relative quantitation of CALD1 in the two cell lines evaluated (right). Upper middle, the sequence AGQAVDDFIEK allows the identification of PGD (left), and the iTRAQ reporter ions released provide the relative quantitation of PGD in the two cell lines evaluated (right). Middle, the sequence AAAPGVEDEPLLR allows the identification of RRM2 (left), and the iTRAQ reporter ions released provide the relative quantitation of RRM2 in the two cell lines evaluated (right). Lower middle, the sequence EAGDAESR allows the identification of SFN (left), and the iTRAQ reporter ions released provide the relative quantitation of SFN in the two cell lines evaluated (right). Bottom, the sequence EQDAVDQVK allows the identification of TRIM29 (left), and the iTRAQ reporter ions released provide the relative quantitation of TRIM29 in the two cell lines evaluated (right). Cell line CNE2 was labeled with iTRAQ reagent 116, and cell line CNE2DDP was labeled twice with iTRAQ reagents 117 and 121. (B) mRNA expressional levels of the five genes, which were consistent with the MS analysis of the corresponding proteins. Histogram shows the relative gene expression levels in cell line CNE2DDP compared to those of cell line CNE2. Bars represent means ± SD; p < 0.05, Student’s t test. (C) A representative western blotting showing TRIM29 protein levels in cell lines CNE2 and CNE2DDP (left); histogram shows the TRIM29 expression levels in the two cell lines as determined by densitometric analysis (right). β-Actin was used as the internal loading control. Bars represent means ± SD; *p < 0.05, as determined using Student’s t test.
Gene ontology, KEGG pathway, and mirna analyses and protein-protein interactions of common differentially expressed proteins
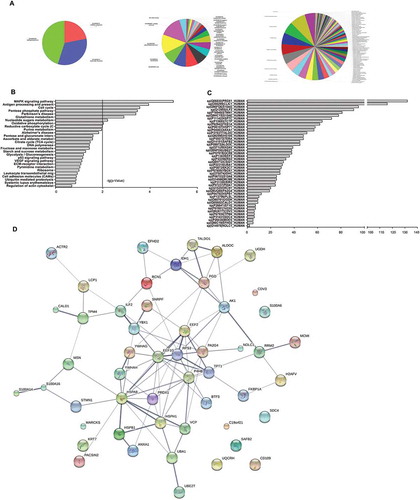
Gene Ontology (GO) analysis showed that differentially expressed proteins were annotated into three groups, biological processes (45%), molecular function (33%), and cellular component (22%) (). Most differentially expressed proteins in the biological process group were associated with response to unfolded protein, cell motility, anti-apoptosis, oxidation reduction, and translational elongation, among others. In the cellular component analysis, proteins were mainly related to cytoplasm, nucleus, cytosol, or cell surface. Moreover, most proteins in the molecular function analysis were identified as having oxidoreductase or binding activity such as protein binding, calcium ion binding, nucleotide binding, among others(S3 Table). Furthermore, KEGG pathway analysis using CapitalBio MAS v3.0 (with filters of p < 0.01 and – log p value> 2) showed that the top three pathways for the differentially proteins corresponded to MAPK signaling pathway, antigen processing and presentation, and cell cycle ( and S3- Table). and S3–5 Table showed the predicted miRNAs from the genes of the common differentially expressed proteins. In addition, we explored the protein-protein interactions using the String software (STRING v9.05). Several proteins were found in the network node, such as HSPA8, RPS3, and ILF2.These proteins might participate in the resistance mechanisms by interacting with each other. shows the network of these proteins. Specific bioinformatics data was not shown.
Figure 5. Bioinformatic analysis of 56 differentially expressed proteins in chemoresistant cell lines. (A) Left, Gene Ontology (GO) analysis of 56 differentially expressed proteins separated in molecular function, biological process, and cellular component. Right, proteins further divided into particular GO categories are shown. The pie chart area is proportional to each GO category. (B) Bar chart of KEGG pathway analysis with a filter of – log(P-value)> 2 showing differentially expressed proteins significantly enriched in several signaling pathways. (C) Predicted miRNAs from the differentially expressed genes. Columns represent different genes, and bars represent the number of miRNAs. (D) Protein-protein interaction networks of differentially expressed proteins. Each node represents all the proteins produced by a single, protein-coding gene locus. Large nodes indicate that some 3D structure is known or predicted, and small nodes indicate proteins with unknown 3D structure. Colored nodes correspond to query proteins and the first shell of interactors, and white nodes correspond to the second shell of interactors. Edges represent protein-protein associations. Associations indicate proteins that jointly contribute to a shared function, not necessarily that they are physically bound to each other. Linked lines represent edge confidence: thicker lines indicate higher confidence.
Validation of differentially expressed proteins identified by proteomics
Through literature review and bioinformatics analysis, 12 proteins (CALD1, TALDO1, RCN1, PGD, ANXA1, STMN1, PRDX1, HSPH1, HSPA8, RRM2, SFN, and TRIM29) were chosen for verification from the differentially expressed proteins identified by MS analysis. qRT-PCR was performed to detect the expression of these 12 proteins in cell lines CNE1, CNE1DDP, CNE2, and CNE2DDP. As shown in , , and , the expression changes of the corresponding mRNAs were consistent with the pattern observed in the MS analysis. In addition, we chose ANXA1 and TRIM29 for further validation using western blotting. The results show that the expression of ANXA1 was significantly higher in CNE1DDP and CNE2DDP cells than in CNE1 and CNE2 cells(), and TRIM29 was significantly higher in CNE2DDP cells than in CNE2 cells (), which is also in agreement with the results of the MS and PCR analyses. We would use these for further study.
Overexpression of ANXA1 increased drug resistance induced by CDDP
To determine whether ANXA1 levels affect CDDP chemoresistance, we induced ANXA1 knockdown in CNE1DDP and CNE2DDP cells and ANXA1 overexpression in CNE1 and CNE2 cells by transient transfection (). Significant differences were seen in transformation efficiency between CNE1DDP and CNE2DDP cells with ANXA1 knockdown and control cells, and between CNE1 and CNE2 cells with ANXA1 overexpression and control cells. MTT assays showed that IC50 in CNE1DDP and CNE2DDP cells was significantly lower in CNE1DDP and CNE2DDP cells with ANXA1 knockdown than in control cells. In addition, IC50 of CNE1 and CNE2 cells increased significantly in CNE1 and CNE2 cells compared to CNE1 and CNE2 cells with ANXA1 overexpression, as described in and . Taken together, these preliminary results suggest that overexpression of ANXA1 increased drug resistance induced by CDDP.
Table 3. IC50 of cell lines CNE1-ANXA1-OE and CNE2-ANXA1-OE for CDDP.
Table 4. IC50 of cell lines CNE1DDP-ANXA1-KD and CNE2DDP-ANXA1-KD for CDDP.
Figure 6. Effects of ANXA1 and TRIM29 on nasopharyngeal carcinoma cells. (A) Representative western blotting showing ANXA1 protein levels in cell lines CNE1, CNE2, CNE1DDP, CNE2DDP and the corresponding transfected cells. GAPDH was used as an internal control for loading(left). Histogram showing ANXA1 expression levels in the cell lines as determined by densitometric analysis(right). Bars represent means ± SD; *p < 0.05, as determined using One-way ANOVA analysis and SNK-q test. (B) Representative western blotting showing TRIM29 protein levels in cell lines CNE2, CNE2DDP, and the corresponding transfected cells. GAPDH was used as an internal control for loading(left). Histogram showing TRIM29 expression levels in the cell lines as determined by densitometric analysis(right). Bars represent means ± SD; *p < 0.05, as determined using One-way ANOVA analysis and SNK-q test.
Knockdown of TRIM29 reduced drug resistance induced by CDDP in CNE2DDP cells
To determine whether overexpression of TRIM29 levels enhanced CDDP chemoresistance, we induced TRIM29 knockdown in CNE2DDP cells and TRIM29 overexpression in CNE2 cells by transient transfection (). Significant differences were seen in transformation efficiency between CNE2DDP cells with TRIM29 knockdown and control cells, and between CNE2 cells with TRIM29 overexpression and control cells. MTT assays showed that IC50 in CNE2DDP cells was significantly lower in CNE2DDP cells with TRIM29 knockdown than in control cells. In addition, IC50 of CNE2 cells increased significantly in CNE2 cells compared to CNE2 cells with TRIM29 overexpression, as described in . Taken together, these preliminary results suggest that knockdown of TRIM29 reduced drug resistance induced by CDDP.
Table 5. IC50 of cell lines CNE2-TRIM29-OE and CNE2DDP-TRIM29-KD for CDDP.
Discussion
Because many cases of NPC are diagnosed in the later stages of the disease, CDDP, PTX, 5-Fu, and capecitabine are commonly used as adjuvant chemotherapy.Citation7,Citation29 However, chemoresistance often causes the therapy to fail.Citation30,Citation31 To address the important theoretical and practical issue of chemoresistance, not only in NPC but also in other cancers, this study investigated the underlying mechanisms of CDDP-resistant cell lines that had been established in our department as a model for drug resistance. As shows, the RI of cell line CNE1DDP was 4.58, whereas that of CNE2DDP was 2.63. In addition, drug-resistance persisted for 15 days in the absence of the drug. Growth curves and colony survival assays showed that the two chemoresistant cell lines were clearly different from their parent cell lines. The data suggested that these cell lines could be further studied as a model for drug resistance.
Proteomic analysis of technical triplicates of cell lines CNE1, CNE1DDP, CNE2, and CNE2DDP using strict selection criteria led to the identification of 690 nonredundant proteins. The data suggested that the two pairs of cell line models would facilitate the identification of new key players involved in chemoresistance in cancer.
Currently, many studies have identified proteins or genes in chemotherapy-resistant NPC,Citation32–Citation35 but only the differences between the drug-resistant cell and its parent cell are discussed.Citation32 In this study, we established two drug-resistant cell lines at the same time to screen for differences common to both cell lines. The two cell lines were screened for differentially expressed proteins common to the four cell lines (CNE1, CNE1DDP, CNE2, and CNE2DDP) and between CNE1 and CNE1DDP, CNE2 and CNE2DDP, respectively. A group of common proteins would then be selected. These procedures were meant to exclude differentially expressed proteins not associated with chemoresistance. More importantly, quantitative proteomics yielded a large amount of data for subsequent studies.
We found 56 common differentially expressed proteins between the chemoresistant and the corresponding parent cell lines. Some proteins, such as HSPB1,Citation36,Citation37 and ANXA1 Citation38,Citation39 have been reported on NPC or other cancers, whereas some proteins, such as PRDX1, STMN1, and TALDO1 were discovered in our study. Using iTRAQ labeling combined with NanoLC-MS/MS, we identified a spectrum of CDDP resistance-associated proteins in NPC cell lines that provides insights into the resistance mechanism of cancer cells.
Bioinformatics analysis of CDDP resistance-associated proteins showed that they are involved in GO cellular component (21.88%), biological process (45.14%), and molecular function (32.98%), which demonstrates the complexity of the underlying mechanism of chemoresistance. For example, the response to unfold protein, cell motility, and anti-apoptosis categories occupied a position of prominence among all biological processes, which could provide valuable information for exploration. For example, the CLIC1 protein, also called chloride intracellular channel protein 1, was studied by Wang et al. in colon cancer and shown to be related to cell migration and invasion.Citation40 CLC1 belongs to a GO category called response to unfolded protein, which is related to endoplasmic reticulum stress. Initiation and progression of chemoresistance is known to be closely associated with redox state disequilibrium in cells.Citation41 CLIC1 also contributes to the acquisition of the radioresistant phenotype of laryngeal cancer through regulation of ROS production.Citation42 Therefore, we propose that CLIC1 is associated with chemoresistance in cancer cells and is a protein worthy of further study. In addition, based on the GO analysis, a number of interesting proteins were identified from the large number of differentially expressed proteins.
Similarly, KEGG pathway analysis showed that these candidate proteins mainly participated in the cancer-related protein signaling MAPK pathway, and may be related to the cell cycle and to glucose metabolism pathways. These results collectively suggest that, in the process of acquiring resistance to chemotherapeutic drugs, tumor cells activate these signaling pathways and the changes in cell cycle lead to insensitivity to anticancer drugs and changes in the metabolism of tumor cells.Citation43,Citation44 To gain more insight into the biological significance of the identified proteins, interaction network analysis was performed on the 56 differentially expressed proteins, and revealed that the proteins interacted with each other through some key proteins. Node proteins such as HSPB1 Citation45 and HSPA1A,Citation46 which participate in cancer development, may also play important roles in the mechanism of drug resistance, and need further study. These results are helpful as a preliminary explanation for the function of drug resistance-related proteins, and provide valuable information for further study of the molecular mechanisms of these candidate proteins in chemoresistance.
Our study screened differentially expressed proteins from three different perspectives: in the two resistant cell lines, in cell lines CNE1 and CNE1DDP, and in cell lines CNE2 and CNE2DDP. After the literature searching, we screened a dozen of them for PCR validation. In the PCR results, the tendencies of the three proteins ANXA1, STMN1, and TALDO1 were consistent in both drug-resistant and parental cell lines and in iTRAQ and PCR results. STMN1 is a very important factor. Many studies have reported that it is overexpressed in tumors and is related to tumor progression, invasion and metastasis.Citation47,Citation48 In chemoresistance-related reports, the high expression of STMN1 in gastric cancer is associated with chemoresistance, and the silencing of STMN1 expression in esophageal cancer increases its sensitivity to paclitaxel, which is consistent with our finding that STMN1 is highly expressed in drug-resistant cell lines.Citation49,Citation50 There is a little report of TADLO1 associated with tumor or drug resistance. It is related to metabolism. It is a certain degree of innovation that it is explored in our study of nasopharyngeal carcinoma drug-resistant proteins. SFN, also known as 14–3–3 sigma, actively participates in cellular meatbolic activities as an important negative regulator of the cell cycle,Citation51–Citation53 and it is also a p53-related tumor suppressor protein.Citation54-Citation56 In many tumors, 14–3–3 sigma expression is down-regulated and is associated with clinicopathological staging, prognosis, and therapeutic evaluation of the tumor.Citation57-Citation61 Many studies have reported that 14–3–3 sigma is closely related to tumor resistance.Citation62-Citation66 In our preliminary study, SFN was highly expressed in CNE2DDP cells, which is the basis of our follow-up study.
In addition, the differential expression of ANXA1 and TRIM29 were confirmed further with PCR and western blotting, because our previous study showed that overexpression of this protein could promote invasion and metastasis of NPC.Citation39,Citation67 The tripartite motif (TRIM) family characterized by a series of conserved domains, including a Ring-finger domain, one or two B-box zinc-finger motifs, and a coiled-coil domain, comprises multi-domain ubiquitin E3 ligases. Thus far, some of the TRIM family proteins are reported to regulate important cellular processes such as cell proliferation, migration, invasion, and carcinogenesis.Citation68-Citation71 TRIM29 (ATDC), a member of the TRIM family of proteins, regulates cell growth, plays important roles in human diseases,Citation2,Citation72,Citation73 and is involved in many signaling pathways regulating tumor genesis or metastasis, such as the Wnt/β-catenin, PI3K/AKT, and PTEN/AKT/MTOR pathways.Citation1–Citation4 TRIM29 also can promote DNA virus infections by inhibiting innate immune response.Citation74 Analysis of TRIM29 expression in various tumor types has revealed that TRIM29 up-regulation is associated with increased aggressiveness, and it affects EMT, tumor invasiveness, and proliferation in osteosarcoma, thyroid carcinoma, bladder cancer, colorectal carcinoma, cervical cancer, and nasopharyngeal carcinoma.Citation2-Citation4,Citation39,Citation67,Citation73,Citation75,Citation76 TRIM29 can interact with p53 and antagonize p53-mediated functions, which increases cell proliferation via inhibition of p53 nuclear activities. TRIM29 represses p53-regulated genes, including p21 and NOXA. Mechanistically, TRIM29 binds p53, and this interaction is potentially fine-tuned via posttranslational acetylation of lysine 116 on TRIM29.Citation77 TRIM 29 can also function as an oncogenic protein in gastric cancer.Citation78 In nasopharyngeal carcinoma, up-regulated TRIM29 promotes proliferation, metastasis, and invasion via the PTEN/AKT/mTOR signal pathway. TRIM29 was identified as the direct target of miR-335-5p and miR-15b-5p. Ectopic TRIM29 expression promoted proliferation, EMT, migration, and invasion in NPC cells. Mechanistically, TRIM29 overexpression down-regulated PTEN expression and increase phosphorylated protein levels of AKT, p70S6K, and 4E-BP1.Citation4,Citation67 However, few studies have reported the functions of this protein in chemo-resistance of NPC. To clarify whether TRIM29 is involved in NPC chemo-resistance to CDDP, the TRIM29 knockdown and TRIM29 overexpression cell lines were established to explore the relation between TRIM29 and drug resistance. Our results clearly show that overexpression of TRIM29 can enhance the chemoresistance of CNE2 cells to CDDP. In other words, TRIM29 participates in cancer drug resistance, although its specific mechanism remains to be elucidated. Although we have found many drug resistance-related proteins, the corresponding signal pathways remain to be investigated in clinical samples.
ANXA1, a member of the annexins superfamily, is a structurally related calcium-dependent phospholipid-binding protein that has a core domain shared by the annexins superfamily and an N-terminal domain that is responsible for its unique function. It participates in important cell processes such as cell signaling, cell differentiation and apoptosis through regulating bubble aggregation, inflammatory response and the activity of phospholipase A2.More and more evidence shows that,ANXA1 affects cell proliferation, invasion, epithelial-mesenchymal transitionCitation79-Citation82and chemoresistance.Citation39,Citation83,Citation84 ANXA1 is a substrate for protease C and tyrosinase, and possesses multiple calcium-phosphorus binding sites. At its N-terminus, a region similar to the src homology domain can bind the linker protein Grb-2, which regulates multiple signaling pathways, thereby regulating cell proliferation.Citation85 Initial studies have reported that ANXA1 binds to EGF receptors and regulates cell proliferation.Citation86 There are different opinions about its role in tumor proliferation and metastasis. ANXA1 inhibits the biogenesis of oncogenic miR-196a by suppressing primary-miR196a indirectly through the stimulation of c-myc and NF-κB expression and activity in breast cancer cells. In a negative feedback loop, miR-196a directly inhibits ANXA1 and enhances breast cancer cell proliferation. Finally, miR196a promotes breast tumor growth.Citation87 Furthermore, ANXA1 knockdown inhibited cell proliferation, induced G1 arrest, and increased cell migration and invasiveness compared with controls. In addition, ANXA1 knockdown increased MMP-9 protein level and enzyme activity and down-regulated TIMP-1,.Citation88 In chemotherapeutic resistance, ANXA1 silencing increases the sensitivity of cancer cells to low-concentration arsenic trioxide treatment by inhibiting ERK/MAPK activation.Citation89 However, there are few reports on chemoresistance in NPC; hence, we used mass spectrometry data to analyze chemoresistance in NPC. In the present study, we provided preliminary evidence that ANXA1 expression appears altered in these chemoresistant cells. In particular, ANXA1 is elevated in both drug-resistant cell lines simultaneously, which is of greater investigative significance. Chemoresistant cells showed a significant increscence of ANXA1 mRNA and protein expression, which is weakly expressed in their parent cells. This finding is compatible with previous studies that identified ANXA1 associating with chemoresistance. Our results further confirmed that knockdown of ANXA1 expression could reduce the IC50 of drug-resistant cell lines, suggesting overexpression of ANXA1 involved in NPC chemoresistance. However, the specific mechanism of ANXA1 such as signal transduction or downstream genes still requires further investigation.
In summary, we identified 56 differentially expressed proteins in NPC and CDDP-resistant cell lines via iTRAQ-labeling combined with NanoLC−MS/MS. Through bioinformatics analyses, some valuable and interesting key proteins were identified as a basis to better understand and further explore the mechanism of chemoresistance in cancer cells. A panel of these proteins might serve as novel biomarkers for the early detection of chemoresistance. We demonstrated for the first time that proteins such as ANXA1, STMN1, and TALDO1 may participate in the CDDP-resistance of NPC cells. In addition, HSPA8, PRDX1, RCN1, and HSPB1 may play an important role in the mechanism of chemoresistance of cell lines CNE1 and CNE1DDP, whereas CALD1, PGD, RRM2, SFN, and TRIM29 are involved in CNE2 and CNE2DDP chemoresistance. Currently, few biomarkers are reliable, sensitive, and specific enough to be of clinical value. The quantitative proteomics analysis of cell line models provides a pivotal tool with which to search for important new proteins as therapeutic targets for the effective treatment of patients with drug-resistant cancer cells. The functional relationship between these proteins and the mechanisms underlying chemotherapy resistance require further study.
Materials and methods
Cell culture
Highly and poorly differentiated NPC cell lines, referred to as CNE1 and CNE2, respectively, are preserved at the Higher Educational Key Laboratory for Cancer Proteomics. Cisplatin (CDDP)-resistant cell lines CNE1DDP and CNE2DDP were first established from the human NPC cell lines CNE1 and CNE2, and the drug was removed a week before the experiments. The cell lines were cultured at 37°C with controlled 5% CO2 in RPMI-1640 medium containing 12% fetal bovine serum.
Establishment of drug-resistant cell lines
Cell lines CNE1 and CNE2 were treated initially with 0.1 mg/L CDDP for 24 to 48 h before removal of the drug using fresh CDDP-free medium. The procedure was repeated until the cells showed relatively stable growth in the presence of the drug. The CDDP concentration was then gradually increased to 1 mg/L. CDDP (10 mg) was obtained from Shandong Qilu Pharmaceutical, paclitaxel (PTX; 5 mL, 30 mg) from Bristol-Myers Squibb, and 5-fluorouracil (5-Fu; 10 mL, 0.25 g) from Shanghai Xudonghaipu.
IC50 and resistance index of drug-resistant cell lines
The IC50 and resistance index (RI) of the chemoresistant cell lines were determined by the MTT method. First, CNE1, CNE1DDP, CNE2, and CNE2DDP cells at the logarithmic phase were digested with 0.25% trypsin. The cells were then placed in 96-well plates at a cell density of about 7 × 10³ per well (200 μL per well, three parallel wells). Second, the plates were incubated at 37 ºC with 5% CO2 for about 6 h until the cells adhered to the well. CDDP at different concentrations were then added to every well (0 mg/L, 0.025 mg/L, 0.25 mg/L, 0.5 mg/L, 1 mg/L, 2.5 mg/L, 5 mg/L, 10 mg/L, 25 mg/L, and 50 mg/L). After 48 h, each well was treated with 5 mg/ml 3-(4, 5-dimethylthiazol-2-yl)-2, 5-diphenyltetrazolium bromide (MTT) in 20 μL and incubated for 4 h. The medium was then removed from each well, 150 μL DMSO were added, the plate shaken for 10 min, and absorbance values were determined at 490 nm.
Growth curve of cell lines
Cells from the four cell lines at logarithmic growth phase were treated with 0.25% trypsin and placed into 96-well plates at a cell density of 3 × 10³ per well (200 μL per well, five parallel wells, ten point 1–10 d). MTT was added every day and the absorbance determined at 490 nm.
Colony survival assay
The four cell lines at logarithmic growth phase were seeded at 1 × 10³ cells per well in six-well plates. CDDP at different concentrations were then added to every well (0 mg/L, 0.25 mg/L, 0.5 mg/L, 0.75 mg/L, and 1 mg/L) and the plates were incubated till the colonies were visible to the naked eye. The plates were then stained with crystal violet for 20 min and colonies of > 50 cells were counted under the microscope. The assays were performed in triplicate. Colony survival fraction (SF) is calculated from the colony formation rate in the treated group divided by the colony formation rate of the control group.
Protein extraction
About 1 × 10⁶ cells were harvested, resuspended in 400 μL lysis buffer containing 7 M urea, 2 M thiourea, and Cocktail 100×, and incubated at 4 ºC for 40 min during which the solution was sonicated 3–5 times. After centrifugation at 13,000 × g at 4 ºC for 30 min, the proteins were collected in the supernatant, quantified, and stored at −80 ºC until needed. Protein concentrations were determined using a bicinchoninic acid protein assay kit according to the manufacturer’s instructions (Pierce, Rockford, IL). Bovine serum albumin was used as the standard.
Protein digestion and itraq labeling
Trypsin digestion and iTRAQ labeling using an iTRAQ Reagent 8 Plex kit (Applied Biosystems, Foster City, CA) were performed based on the manufacturer’s protocol.Citation90 Protein extracts from CNE1 and CNE2 cell lines were labeled with iTRAQ reagents 113 and 116, respectively, and extracts from both cell lines CNE1DDP (114 and 119) and CNE2DDP (117 and 121) were labeled twice with iTRAQ reagents. In brief, 100 μg lysate of each sample was reduced with Tris-(2-carboxyethyl) phosphine and alkylated with methyl methanethiosulfonate (MMTS), and then digested overnight at 37 ºC with trypsin (MS grade, Promega, Madison, WI). The iTRAQ labeled samples were then combined according to the specified set and transferred into a fresh 1.5-mL tube, desalted with Oasis HLB cartridges (Waters, Milford, MA), and dried in a vacuum centrifuge (Concentrator Plus, Eppendorf, Germany).
Strong cation exchange and nanolc−ms/ms analysis
The mixed peptides were fractionated by strong cation exchange (SCX) chromatography using a 20AD HPLC system (Shimadzu, Kyoto, Japan) and a polysulfoethyl column (2.1 × 100 mm, 5 μm, 200 Å, The Nest Group, Southborough, MA). The mixed peptides were dissolved in 80 μL of Buffer A (10 mM KH2PO4 in 25% ACN, Fisher Scientific, Fair Lawn, NJ), pH 3, and loaded onto the column. Peptides were separated using a linear binary gradient of 0–80% buffer B (same as buffer A, but containing 350 mM KCl) in buffer A at a flow rate of 200 μL/min for 60 min. Briefly, a total of 20 SCX fractions were collected, and the absorbance at 214 nm and 280nm were monitored. The fractions were desalted using C18 cartridges (UltraMicroSpin, The Nest Group, Southborough, MA), dried, and dissolved in a buffer containing 20 μL of 5% ACN and 0.15 FA.
The SCX fractions were analyzed thrice with a NanoLC system (NanoLC-2D Ultra, Eksigent, Dublin, CA) equipped with a Triple TOF 5600 mass spectrometer (AB SCIEX, USA). The peptides were treated with an RP Trap (ProteoPepIIC18 column, 5 μm, 300 Å, 0.15 × 25 mm, IntegraFrit, New Objective, Woburn, MA), and then separated on an RP analytical column (ProteoPepC18 column, 5 μm, 300A, 0.075 × 150 mm, IntegraFrit, Woburn, MA). The NanoLC gradient was 5−35% buffer B (98% ACN, 2% H2O, 0.1% FA) over 120 min at a flow rate of 300 nL/min. Survey scans were acquired from 350 to 1500 (m/z) with up to 40 precursors selected for MS/MS from m/z 100−1500 using a dynamic exclusion of 30S for selected ions. The iTRAQ-labeled peptides fragmented under collision-induced dissociation conditions to yield reporter ions at 113.1, 114.1, 115.1, 116.1, 117.1, 118.1, 119.1, and 121.1. The mass spectrometer was calibrated using beta galactosidase tryptic peptides.
Protein identification and quantitation
Protein identification and quantitation in the iTRAQ data were performed with the ProteinPilot v4.2 software (AB SCIEX, USA). The parameters were set as follows. Sample type: iTRAQ 8-plex (Peptide Labeled); Cysteine alkylation: methyl methanethiosulfonate; Digestion: trypsin; Instrument: Triple TOF5600; Species: Homo sapiens; ID Focus: Biological modifications; Database: UniProtKB/Swiss-Prot FASTA; Search effort: Thorough ID and FDR were estimated. For iTRAQ quantitation, the peptide was automatically selected with the Pro Group algorithm to calculate the reporter peak area, error factor (EF), and p value. In this study, the protein confidence threshold cutoff was > 1.3 (unused ProtScore). Proteins with at least one peptide (confidence> 95%) were used for quantification.
Gene ontology, pathway, mirnas, and interaction analyses
Gene Ontology, KEGG pathway, and miRNA analyses of differentially expressed proteins were performed using CapitalBio MAS v3.0 (http://bioinfo.capitalbio.com/mas3/). CapitalBio MAS 3.0 software based on the integration of public databases including Gene Ontology, KEGG, BioCarta, GenMapp, Intact, UniGene, OMIM, etc.Citation91,Citation92 W selected the “Run Analysis Anonymously” option, and the species selected was “Homo sapiens” and molecule type was “protein.” The functions chosen were Gene Ontology, pathway, and miRNAs. Finally, the differential protein ID was entered into the software interface and the program was allowed to run. Protein interactions were predicted using the String software (STRING v10.0), in which the differential proteins served as a bait, and the proteins experimentally reported to directly interact with the bait proteins in the databases were selected. The differential protein ID was entered into the software interface, and “Homo sapiens” was selected; thereafter, the database was searched. KEGG pathway was considered statistically significant when the corrected p-value was less than 0.01.
qRT-PCR.Total RNA was extracted using Trizol (Invitrogen). The quality and quantity of RNA were assessed with a NanoDrop spectrophotometer 2000/2000C (Thermo Scientific). Reverse transcription was performed using M-MLV Reverse Transcriptase (Promega M1705). An aliquot of 2.0 μg of RNA was reverse transcribed to cDNA, and qRT-PCR was subsequently performed with 0.6 µL cDNA using a Real-time PCR System (TAKARA TP800). GAPDH was used as a loading control. Relative expression of target genes was obtained using the 2−ΔΔCt method. The primers for the target genes are as follows: TALDO1 (NM_006755, forward primer: GACTTCCTCACCATCTCACCCAA, reverse primer: TCACTGCATCAGCGGCAAACT, 211 bp); ANXA1 (NM_000700, forward primer: GAGGAGGTTGTTTTAGCTCTGC, reverse primer: AGCAAAGCGTTCCGAAAATCT, 230 bp); STMN1 (NM_001145454, forward primer: TGAGAAACGAGAGCACGAG, reverse primer: TCAGCAGGGTCTTTGGATTC, 213 bp); HSPB1 (NM_001540, forward primer: TGGACCCCACCCAAGTTTC, reverse primer: CGGCAGTCTCATCGGATTTT, 168 bp); RCN1 (NM_002901, forward primer: AACAAGCCACCTATGGTTACTA, reverse primer: TCCGCAATATACTCATCCTGAT, 271 bp); PRDX1 (NM_002574, forward primer: CATTCCTTTGGTATCAGACCCG, reverse primer: CCCTGAACGAGATGCCTTCAT, 83 bp); HSPA8 (NM_006597, forward primer: ACTCCAAGCTATGTCGCCTT, reverse primer: TGGCATCAAAAACTGTGTTGG, 100 bp); CALD1 (NM_033138, forward primer: GACAACCACCACAAACACTCA, reverse primer: TTCTTGGCGACTTTCACTTT, 235 bp); PGD (NM_001304452, forward primer: ATGAGTAAGCAAAATGGAGGTG, reverse primer: TCATAAGATTAGCAGCCAACG, 154 bp); RRM2 (NM_001165931, forward primer: AGGAATAGGTGGGGCATCAGG, reverse primer: CATTCTGTGGGGTCCAAGAGC, 136 bp); SFN (NM_006142, forward primer: ACTTTTCCGTCTTCCACTACGA, reverse primer: ACAGTGTCAGGTTGTCTCGC, 165 bp); TRIM29 (NM_012101, forward primer: TGCGAGCTGCATCTCAAGC, reverse primer: GGTGCTATGATTCTTGTGCTCC, 189 bp); GAPDH (TGACTTCAACAGCGACACCCA, CACCCTGTTGCTGTAGCCAAA, 121 bp).
Western blotting
Western blotting was performed on all individual cell samples. The bicinchoninic acid method was used to determine protein concentration. In brief, 30 μg of lysate were separated by 10% sodium dodecyl sulfate polyacrylamide gel electrophoresis and transferred to polyvinylidene fluoride membranes. Blots were incubated with a primary anti-TRIM29 antibody (1:1000; Proteintech)and anti-ANXA1 antibody(1:1000;Abcam) overnight at 4°C, followed by incubation with a secondary antibody: goat anti-rabbit antibody (1:10,000; Abcam) for 1 h at room temperature(22–25 ºC). GAPDH was used as a control and was detected using a rabbit monoclonal anti-GAPDH antibody (1:1,000; Auragene). The signal was visualized using Luminata Crescendo Western HRP Substrate (Millipore, USA) and FluorChem FC3 Chemiluminescence imaging system (ProteinSimpl, USA).
Transfection of NPC cells and overexpression of ANXA1 and TRIM29
LV-ANXA1-RNAi(7552–1) and empty vector GV248(Genechem, shanghai, China) were transfected into CNE1DDP and CNE2DDP cells, and LV-ANXA1(7304–1) and empty vector GV341(Genechem, shanghai, China) were transfected into the CNE1 and CNE2 cells. Transfection was performed according to the manufacturer’s instructions. Transfected cells were collected after 72 h, and ANXA1 levels were determined by western blotting. Plasmid GV102-TRIM29-shRNA and empty vector GV102 (Genechem, shanghai, China) were transfected into CNE2DDP cells, and plasmid GV143-TRIM29 and empty vector GV143 (Genechem, shanghai, China) were transfected into the CNE2 cells. Transfection was performed with 1 × 10⁵ cells using Lipofectamine 2000 (Invitrogen, USA) according to the manufacturer’s instructions. Transfected cells were collected after 48 h, and TRIM29 levels were determined by western blotting.
Statistical analysis
The data are presented as the mean ± SD. Student’s t test was used between two groups in the comparisons of quantitative data (two-tailed; P < 0.05 was considered significant). One-way ANOVA analysis was used between three groups and the SNK-q test was used for Post Hoc multiple comparisons. Statistical analysis was performed with SPSS v13.0.
Competing interests
The authors declare that they have no competing interests, and all authors should confirm its accuracy.
Authors’ contributions
Kun Wang and Bin Yi designed the research; Kun Wang, Zhen Chen, Lu Long, Ya Tao, Qiong Wu, Manlin Xiang, Yunlai Liang, Xulin Xie,Yuan Jiang,Yahui Yan and Shiyang Qiu analyzed the data; Kun Wang wrote the manuscript; Kun Wang and Zhiqiang Xiao revised the manuscript; all authors approved the final version of the manuscript.
Ethics approval and consent to participate
Not applicable.
Consent for publication
Not applicable.
Supplemental Material
Download Zip (1,012.9 KB)Acknowledgments
We thank the Proteome Center of Fudan University, China, for technical assistance.
Supplemental data
The supplemental data for this article can be accessed here
Additional information
Funding
References
- Dükel M, Streitfeld WS, Tang TC, Backman LR, Ai L, May WS, Brown KD. The breast cancer tumor suppressor TRIM29 is expressed via ATM-dependent signaling in response to hypoxia. J Biol Chem. 2016;291(41):21541–21552. PMID: 27535224. doi:10.1074/jbc.M116.730960.
- Xu J, Li Z, Su Q, Zhao J, Ma J. TRIM29 promotes progression of thyroid carcinoma via activating P13K/AKT signaling pathway. Oncol Rep. 2017;37(3):1555–1564. PMID:28098872. doi:10.3892/or.2017.5364.
- Xu R, Hu J, Zhang T, Jiang C, Wang HY. TRIM29 overexpression is associated with poor prognosis and promotes tumor progression by activating Wnt/β-catenin pathway in cervical cancer. Oncotarget. 2016;7:28579–28591. PMID:27081037. doi:10.18632/oncotarget.8686.
- Zhou XM, Sun R, Luo DH, Sun J, Zhang MY, Wang MH, Yang Y, Wang HY, Mai SJ. Upregulated TRIM29 promotes proliferation and metastasis of nasopharyngeal carcinoma via PTEN/AKT/mTOR signal pathway. Oncotarget. 2016;7(12):13634–13650. doi:10.18632/oncotarget.7215.PMID:26872369.
- Twu CW, Wang WY, Chen CC, Liang KL, Jiang RS, Wu CT, Shih YT, Lin PJ, Liu YC, Lin JC. Metronomic adjuvant chemotherapy improves treatment outcome in nasopharyngeal carcinoma patients with postradiation persistently detectable plasma epstein-barr virus deoxyribonucleic acid. Int J Radiat Oncol Biol Phys. 2014;89(1):21–29. PMID: 24725686. doi:10.1016/j.ijrobp.2014.01.052.
- Chen QY, Wen YF, Guo L, Liu H, Huang PY, Mo HY, Li NW, Xiang YQ, Luo DH, Qiu F, et al. Concurrent chemoradiotherapy vs radiotherapy alone in stage II nasopharyngeal carcinoma: phase III randomized trial. J Natl Cancer Inst. 2011;103(23):1761–1770. PMID: 22056739. doi:10.1093/jnci/djr432.
- OuYang PY, Xie C, Mao YP, Zhang Y, Liang XX, Su Z, Liu Q, Xie FY. Significant efficacies of neoadjuvant and adjuvant chemotherapy for nasopharyngeal carcinoma by meta-analysis of published literature-based randomized, controlled trials. Ann Oncol. 2013;24(8):2136–2146. PMID: 23613477. doi:10.1093/annonc/mdt146.
- Peng X, Li W, Tan G. Reversal of taxol resistance by cisplatin in nasopharyngeal carcinoma by upregulating thromspondin-1 expression. Anticancer Drugs. 2010;21(4):381–388. PMID: 20051827. doi:10.1097/CAD.0b013e3283363980.
- Ma BB, Hui EP, Wong SC, Tung SY, Yuen KK, King A, Chan SL, Leung SF, Kam MK, Yu BK, et al. Multicenter phase II study of gemcitabine and oxaliplatin in advanced nasopharyngeal carcinoma–correlation with excision repair cross-complementing-1 polymorphisms. Ann Oncol. 2009;20(11):1854–1859. PMID: 19549713. doi:10.1093/annonc/mdp065.
- Zuo Q, Shi M, Li L, Chen J, Luo R. Development of cetuximab-resistant human nasopharyngeal carcinoma cell lines and mechanisms of drug resistance. Biomed Pharmacother. 2010;64(8):550–558. PMID: 20630698. doi:10.1016/j.biopha.2010.03.003.
- Xie SM, Fang WY, Liu TF, Yao KT, Zhong XY. Association of ABCC2 and CDDP-resistance in two sublines resistant to CDDP derived from a human nasopharyngeal carcinoma cell line. J Oncol. 2010;2010:915046. PMID: 20628484. doi:10.1155/2010/915046.
- Bao YN, Cao X, Luo DH, Sun R, Peng LX, Wang L, Yan YP, Zheng LS, Xie P, Cao Y, et al. Urokinase-type plasminogen activator receptor signaling is critical in nasopharyngeal carcinoma cell growth and metastasis. Cell Cycle. 2014;13(12):1958–1969. PMID: 24763226. doi:10.4161/cc.28921.
- Cai YL, Li J, Lu AY, Zheng YM, Zhong WM, Wang W, Gao JQ, Zeng H, Cheng JR, Tang MZ. Diagnostic significance of combined detection of epstein-barr virus antibodies, VCA/ IgA,EA/IgA, Rta/IgG and EBNA1/IgA for nasopharyngeal carcinoma. Asian Pac J Cancer Prev. 2014;15(5):2001–2006. PMID:24716925. doi:10.7314/APJCP.
- Huang D, Li Y, Liu N, Zhang Z, Peng Z, Duan C, Tang X, Tan G, Yan G, Tang F. Identification of novel signaling components in N,N’-dinitrosopiperazine-mediated metastasis of nasopharyngeal carcinoma by quantitative phosphoproteomics. BMC Cancer. 2014;14(1):243. PMID: 24708550. doi:10.1186/1471-2407-14-243.
- Zheng PC, Chen X, Zhu HW, Zheng W, Mao LH, Lin C, Liu JN, Zheng M. 2014. Capn4 is a marker of poor clinical outcomes and promotes nasopharyngeal carcinoma metastasis via NF-kappaB-Induced MMP2 expression. Cancer Sci. 105(6):630–638. PMID: 24703594. doi:10.1111/cas.12416.
- Wang W, Jia HL, Huang JM, Liang YC, Tan H, Geng HZ, Guo LY, Yao SZ. Identification of biomarkers for lymph node metastasis in early-stage cervical cancer by tissue-based proteomics. Br J Cancer. 2014;110(7):1748–1758. PMID: 24569473. doi:10.1038/bjc.2014.92.
- Rodriguez-Suarez E, Mato JM, Elortza F. Proteomics analysis of human nonalcoholic fatty liver. Methods Mol Biol. 2012;909:241–258. PMID: 22903720. doi:10.1007/978-1-61779-959-4_16.
- Mustafa MG, Petersen JR, Ju H, Cicalese L, Snyder N, Haidacher SJ, Denner L, Elferink C. Biomarker discovery for early detection of hepatocellular carcinoma in hepatitis C-infected patients. Mol Cell Proteomics. 2013;12(12):3640–3652. PMID: 24008390. doi:10.1074/mcp.M113.031252.
- Barjaktarovic Z, Anastasov N, Azimzadeh O, Sriharshan A, Sarioglu H, Ueffing M, Tammio H, Hakanen A, Leszczynski D, Atkinson MJ, et al. Integrative proteomic and microRNA analysis of primary human coronary artery endothelial cells exposed to low-dose gamma radiation. Radiat Environ Biophys. 2013;52(1):87–98. PMID: 23138885. doi:10.1007/s00411-012-0439-4.
- Liu Y, Li Y, Tan BB, Zhao Q, Fan LQ, Zhang ZD, Li ZX. Technique appraisement of comparative proteomics and screening of differentiation-related protein in gastric carcinoma. Hepatol gastroentero. 2013;60(123):633–637. PMID: 23635446. PMID: 24769235. doi:10.5754/hge12794.
- Liu Y, Wang X, Li S, Hu H, Zhang D, Hu P, Yang Y, Ren H. The role of von willebrand factor as a biomarker of tumor development in hepatitis B virus-associated human hepatocellular carcinoma: a quantitative proteomic based study. J Proteomics. 2014;106:99–112. PMID: 24769235. doi:10.1016/j.jprot.2014.04.021.
- Datta A, Chen CP, Sze SK. Discovery of prognostic biomarker candidates of lacunar infarction by quantitative proteomics of microvesicles enriched plasma. PLoS One. 2014;9(4):e94663. PMID: 24752076. doi:10.1371/journal.pone.0094663.
- Serada S, Naka T. Screening for novel serum biomarker for monitoring disease activity in rheumatoid arthritis using iTRAQ technology-based quantitative proteomic approach. Methods Mol Biol. 2014;1142:99–110. PMID: 24706280. doi:10.1007/978-1-4939-0404-4_12.
- Zeng GQ, Zhang PF, Deng X, Yu FL, Li C, Xu Y, Yi H, Li MY, Hu R, Zuo JH, et al. Identification of candidate biomarkers for early detection of human lung squamous cell cancer by quantitative proteomics. Mol Cell Proteomics. 2012;11(6):M111.013946. M111.013946.PMID:22298307. doi:10.1074/mcp.
- Sahasrabuddhe NA, Barbhuiya MA, Bhunia S, Subbannayya T, Gowda H, Advani J, Shrivastav BR, Navani S, Leal P, Roa JC, et al. Identification of prosaposin and transgelin as potential biomarkers for gallbladder cancer using quantitative proteomics. Biochem Biophys Res Commun. 2014;446(4):863–869. PMID: 24657443. doi:10.1016/j.bbrc.2014.03.017.
- Singh AK, Roberts S, Ullman B, Madhubala R. A quantitative proteomic screen to identify potential drug resistance mechanism in alpha-difluoromethylornithine (DFMO) resistant leishmania donovani. J Proteomics. 2014;102:44–59. PMID: 24631822. doi:10.1016/j.jprot.2014.02.030.
- White NM, Masui O, Desouza LV, Krakovska O, Metias S, Romaschin AD, Honey RJ, Stewart R, Pace K, Lee J, et al. Quantitative proteomic analysis reveals potential diagnostic markers and pathways involved in pathogenesis of renal cell carcinoma. Oncotarget. 2014;5(2):506–518. PMID: 24504108. doi:10.18632/oncotarget.1529.
- Datta A, Qian J, Chong R, Kalaria RN, Francis P, Lai MK, Chen CP, Sze SK. Novel pathophysiological markers are revealed by iTRAQ-based quantitative clinical proteomics approach in vascular dementia. J Proteomics. 2014;99:54–67. PMID: 24448401. doi:10.1016/j.jprot.2014.01.011.
- Jamshed A, Hussain R, Iqbal H. Gemcitabine and cisplatin followed by chemo-radiation for advanced nasopharyngeal carcinoma. Asian Pac J Cancer Prev. 2014;15(2):899–904. PMID: 24568516. doi:10.7314/APJCP.2014.15.2.899.
- Zhang P, Liu H, Xia F, Zhang QW, Zhang YY, Zhao Q, Chao ZH, Jiang ZW, Jiang CC. Epithelial-mesenchymal transition is necessary for acquired resistance to cisplatin and increases the metastatic potential of nasopharyngeal carcinoma cells. Int J Mol Med. 2014;33(1):151–159. PMID: 24173500. doi:10.3892/ijmm.2013.1538.
- Liu X, Chen L, Feng B, Liu G. Reversing effect of sorcin in the drug resistance of human nasopharyngeal carcinoma. Anat Rec (Hoboken). 2014;297(2):215–221. PMID: 24376145. doi:10.1002/ar.22832.
- Tang S, Huang W, Zhong M, Yin L, Jiang H, Hou S, Gan P, Yuan Y. Identification keratin 1 as a cDDP-resistant protein in nasopharyngeal carcinoma cell lines. J Proteomics. 2012;75(8):2352–2360. PMID: 24376145. doi:10.1002/ar.22832.
- Pan Y, Zhang Q, Atsaves V, Yang H, Claret FX. Suppression of Jab1/CSN5 induces radio- and chemo-sensitivity in nasopharyngeal carcinoma through changes to the DNA damage and repair pathways. Oncogene. 2013;32(22):2756–2766. PMID: 22797071. doi:10.1038/onc.2012.294.
- Pan Y, Zhou F, Zhang R, Claret FX. Stat3 inhibitor stattic exhibits potent antitumor activity and induces chemo- and radio-sensitivity in nasopharyngeal carcinoma. PLoS One. 2013;8(1):e54565. PMID: 23382914. doi:10.1371/journal.pone.0054565.
- Chang PY, Wu ZZ, Sun NK, Chao CC. EBV-encoded LMP-1 sensitizes nasopharyngeal carcinoma cells to genotoxic drugs by down-regulating cabin1 expression. J Cell Physiol. 2014;229(3):309–322. PMID: 23939952. doi:10.1002/jcp.24448.
- Sakai A, Otani M, Miyamoto A, Yoshida H, Furuya E, Tanigawa N. Identification of phosphorylated serine-15 and −82 residues of HSPB1 in 5-fluorouracil-resistant colorectal cancer cells by proteomics. J Proteomics. 2012;75(3):806–818. PMID: 21989268. doi:10.1016/j.jprot.2011.09.023.
- Yang YX, Sun XF, Cheng AL, Zhang GY, Yi H, Sun Y, Hu HD, Hu P, Ye F, Chen ZC, et al. Increased expression of HSP27 linked to vincristine resistance in human gastric cancer cell line. J Cancer Res Clin Oncol. 2009;135(2):181–189. PMID:18758817. doi:10.1007/s00432-008-0460-9.
- Zhu F, Wang Y, Zeng S, Fu X, Wang L, Cao J. Involvement of annexin A1 in multidrug resistance of K562/ADR cells identified by the proteomic study. OMICS. 2009;13(6):467–476. PMID: 20001861. doi:10.1089/omi.2009.0046.
- Onozawa H, Saito M, Saito K, Kanke Y, Watanabe Y, Hayase S, Sakamoto W, Ishigame T, Momma T, Ohki S, et al. Annexin A1 is involved in resistance to 5-FU in colon cancer cells. Oncol Rep. 2017;37(1):235–240. PMID:27840982. doi:10.3892/or.2016.5234.
- Wang P, Zeng Y, Liu T, Zhang C, Yu PW, Hao YX, Luo HX, Liu G. Chloride intracellular channel 1 regulates colon cancer cell migration and invasion through ROS/ERK pathway. World J Gastroenterol. 2014;20(8):2071–2078. PMID: 24587680. doi:10.3748/wjg.v20.i8.2071.
- Kang KA, Piao MJ, Kim KC, Kang HK, Chang WY, Park IC, Keum YS, Surh YJ, Hyun JW. Epigenetic modification of Nrf2 in 5-fluorouracil-resistant colon cancer cells: involvement of TET-dependent DNA demethylation. Cell Death Dis. 2014;5:e1183. PMID: 24743738. doi:10.1038/cddis.2014.149.
- Kim JS, Chang JW, Yun HS, Yang KM, Hong EH, Kim DH, Um HD, Lee KH, Lee SJ, Hwang SG. Chloride intracellular channel 1 identified using proteomic analysis plays an important role in the radiosensitivity of HEp-2 cells via reactive oxygen species production. Proteomics. 2010;10(14):2589–2604. PMID: 20461716. doi:10.1002/pmic.200900523.
- Cochaud S, Giustiniani J, Thomas C, Laprevotte E, Garbar C, Savoye AM, Cure H, Mascaux C, Alberici G, Bonnefoy N, et al.IL-17A is produced by breast cancer TILs and promotes chemoresistance and proliferation through ERK1/2. Sci Rep. 2013;3. PMID: 24316750. doi:10.1038/srep03456.
- Sette G, Salvati V, Memeo L, Fecchi K, Colarossi C, Di MP, Signore M, Biffoni M, D’Andrea V, De Antoni E, et al. EGFR inhibition abrogates leiomyosarcoma cell chemoresistance through inactivation of survival pathways and impairment of CSC potential. PLoS One. 2012;7(10):e46891. PMID: 23056514. doi:10.1371/journal.pone.0046891.
- Lee JH, Sun D, Cho KJ, Kim MS, Hong MH, Kim IK, Lee JS, Lee JH. Overexpression of human 27 kDa heat shock protein in laryngeal cancer cells confers chemoresistance associated with cell growth delay. J Cancer Res Clin Oncol. 2007;133(1):37–46. PMID: 16906418. doi:10.1007/s00432-006-0143-3.
- Qi W, White MC, Choi W, Guo C, Dinney C, McConkey DJ, Siefker-Radtke A. Inhibition of inducible heat shock protein-70 (hsp72) enhances bortezomib-induced cell death in human bladder cancer cells. PLoS One. 2013;8(7):e69509. PMID: 23874968. doi:10.1371/journal.pone.0069509.
- Ni PZ, He JZ, Wu ZY, Ji X, Chen LQ, Xu XE, Liao LD, Wu JY, Li EM, Xu LY. Overexpression of stathmin 1 correlates with poor prognosis and promotes cell migration and proliferation in oesophageal squamous cell carcinoma. Oncol Rep. 2017;38(6):3608–3618. PMID: 29039594. doi:10.3892/or.2017.6039.
- Zhang J, Fu J, Pan Y, Zhang X, Shen L. Silencing of miR-1247 by DNA methylation promoted non-small-cell lung cancer cell invasion and migration by effects of STMN1. Onco Targets Ther. 2016;9:7297–7307. PMID: 27942223. doi:10.2147/OTT.S111291.
- Bai T, Yokobori T, Altan B, Ide M, Mochiki E, Yanai M, Kimura A, Kogure N, Yanoma T, Suzuki M, et al. High STMN1 level is associated with chemo-resistance and poor prognosis in gastric cancer patients. Br J Cancer. 2017;116(9):1177–1185. PMID: 28334732. doi:10.1038/bjc.2017.76.
- Zhu HW, Jiang D, Xie ZY, Zhou MH, Sun DY, Zhao YG. Effects of stathmin 1 silencing by siRNA on sensitivity of esophageal cancer cells Eca-109 to paclitaxel. Genet Mol Res. 2015;14(4):18695–18702. PMID: 26782519. doi:10.4238/2015.December.28.18.
- Yang H, Zhang Y, Zhao R, Wen YY, Fournier K, Wu HB, Yang HY, Diaz J, Laronga C, Lee MH. Negative cell cycle regulator 14-3-3sigma stabilizes p27 Kip1 by inhibiting the activity of PKB/Akt. Oncogene. 2006;25(33):4585–4594. PMID: 16532026. doi:10.1038/sj.onc.1209481.
- Ide M, Nakajima T, Asao T, Kuwano H. Inactivation of 14-3-3sigma by hypermethylation is a rare event in colorectal cancers and its expression may correlate with cell cycle maintenance at the invasion front. Cancer Lett. 2004;207(2):241–249. PMID: 15072834. doi:10.1016/j.canlet.2003.11.009.
- Vogel S, Herzinger T. The epithelium specific cell cycle regulator 14-3-3sigma is required for preventing entry into mitosis following ultraviolet B. Photodermatol Photoimmunol Photomed. 2013;29(6):300–310. PMID: 24102700. doi:10.1111/phpp.12071.
- Qin X, Qiu F, Zou Z. TRIM25 is associated with cisplatin resistance in non-small-cell lung carcinoma A549 cell line via downregulation of 14-3-3σ. Biochem Biophys Res Commun. 2017;493:568–572. PMID:28867193. doi:10.1016/j.bbrc.2017.08.151.
- Yang H, Zhao R, Lee MH. 14-3-3sigma, a p53 regulator, suppresses tumor growth of nasopharyngeal carcinoma. Mol Cancer Ther. 2006;5(2):253–260. MCT-05-0395.PMID: 16505098. doi:10.1158/1535-7163.
- Yang HY, Wen YY, Chen CH, Lozano G, Lee MH. 14-3-3 sigma positively regulates p53 and suppresses tumor growth. Mol Cell Biol. 2003;23(20):7096–7107. PMID:14517281. doi:10.1128/MCB.23.20.7096-7107.2003.
- Chan SY, To KF, Leung SF, Yip WW, Mak MK, Chung GT, Lo KW. 14-3-3sigma expression as a prognostic marker in undifferentiated nasopharyngeal carcinoma. Oncol Rep. 2010;24(4):949–955. PMID: 20811675. doi:10.3892/or_00000941.
- Holm R, Ali T, Svendsrud DH, Nesland JM, Kristensen GB, Lyng H. Expression of 14-3-3sigma in cervical squamous cell carcinomas: relationship with clinical outcome. Oncol Rep. 2009;22(1):11–15. PMID: 19513498. doi:10.3892/or_00000399.
- Deng J, Gao G, Wang L, Wang T, Yu J, Zhao Z. Stratifin expression is a novel prognostic factor in human gliomas. Pathol Res Pract. 2011;207(11):674–679. PMID:21940111. doi:10.1016/j.prp.2011.08.005.
- Raungrut P, Petjaroen P, Geater SL, Keeratichananont W, Phukaoloun M, Suwiwat S, Thongsuksai P. Methylation of 14-3-3σ gene and prognostic significance of 14-3-3σ expression in non-small cell lung cancer. Oncol Lett. 2017;14:5257–5264. PMID: 29113161. doi:10.3892/ol.2017.6881.
- Zheng G, Xiong Y, Yi S, Zhang W, Peng B, Zhang Q, He Z. 14-3-3σ regulation by p53 mediates a chemotherapy response to 5-fluorouracil in MCF-7 breast cancer cells via Akt inactivation. FEBS Lett. 2012;586:163–168. PMID:22192357. doi:10.1016/j.febslet.2011.11.034.
- Qin L, Dong Z, Zhang JT. 14-3-3σ regulation of and interaction with YAP1 in acquired gemcitabine resistance via promoting ribonucleotide reductase expression. Oncotarget. 2016;7:17726–17736. PMID: 26894857. doi:10.18632/oncotarget.7394.
- Lai KK, Chan KT, Choi MY, Wang HK, Fung EY, Lam HY, Tan W, Tung LN, Tong DK, Sun RW, et al. 14-3-3σ confers cisplatin resistance in esophageal squamous cell carcinoma cells via regulating DNA repair molecules. Tumour Biol. 2016;37:2127–2136. PMID: 26346170. doi:10.1007/s13277-015-4018-6.
- Kim IK, Park SM, Cho HJ, Baek KE, Nam IK, Park SH, Ryu KJ, Ryu J, Choi J, Hong SC, et al. 14-3-3σ attenuates RhoGDI2-induced cisplatin resistance through activation of Erk and p38 in gastric cancer cells. Oncotarget. 2013;4:2045–2056. PMID: 24185104. doi:10.18632/oncotarget.1334.
- Cetintas VB, Tetik A, Cok G, Kucukaslan AS, Kosova B, Gunduz C, Veral A, Eroglu Z. Role of 14-3-3σ in resistance to cisplatin in non-small cell lung cancer cells. Cell Biol Int. 2013;37:78–86. PMID: 23339090. doi:10.1002/cbin.10006.
- Li Z, Dong Z, Myer D, Yip-Schneider M, Liu J, Cui P, Schmidt CM, Zhang JT. Role of 14-3-3σ in poor prognosis and in radiation and drug resistance of human pancreatic cancers. BMC Cancer. 2010;10:598. PMID:21040574. doi:10.1186/1471-2407-10-598.
- Chen Z, Long L, Wang K, Cui F, Zhu L, Tao Y, Wu Q, Xiang M, Liang Y, Qiu S, et al. Identification of nasopharyngeal carcinoma metastasis-related biomarkers by iTRAQ combined with 2D-LC-MS/MS. Oncotarget. 2016;7(23):34022–34037. PMID: 27145374. doi:10.18632/oncotarget.9067.
- Sun G, Sui X, Han D, Gao J, Liu Y, Zhou L. TRIM59 promotes cell proliferation, migration and invasion in human hepatocellular carcinoma cells. Pharmazie. 2017;72(11):674–679. doi:10.1691/ph.2017.7659.PMID:29442042.
- Song Y, Guo Q, Gao S, Hua K. Tripartite motif-containing protein 3 plays a role of tumor inhibitor in cervical cancer. Biochem Biophys Res Commun. 2018;498(3):686–692. PMID:29524410. doi:10.1016/j.bbrc.2018.03.046.
- Hatakeyama S. .TRIM proteins and cancer. Nat Rev Cancer. 2011;11(11):792–804. PMID:21979307. doi:10.1038/nrc3139.
- Napolitano LM, Meroni G. TRIM family: pleiotropy and diversification through homomultimer and heteromultimer formation. IUBMB Life. 2012;64(1):64–71. PMID: 22131136. doi:10.1002/iub.580.
- Xing J, Weng L, Yuan B, Wang Z, Jia L, Jin R, Lu H, Li XC, Liu YJ, Zhang Z. Identification of a role for TRIM29 in the control of innate immunity in the respiratory tract. Nat Immunol. 2016;17(12):1373–1380. PMID:27695001. doi:10.1038/ni.3580.
- Tan ST, Liu SY, Wu B. TRIM29 overexpression promotes proliferation and survival of bladder cancer cells through NF-κB signaling. Cancer Res Treat. 2016;48:1302–1312. PMID:26987391. doi:10.4143/crt.2015.381.
- Xing J, Zhang A, Zhang H, Wang J, Li XC, Zeng MS, Zhang Z. TRIM29 promotes DNA virus infections by inhibiting innate immune response. Nat Commun. 2017;8(1):945. PMID:29038422. doi:10.1038/s41467-017-00101-w.
- Zeng SX, Cai QC, Guo CH, Zhi LQ, Dai X, Zhang DF, Ma W. High expression of TRIM29 (ATDC) contributes to poor prognosis and tumor metastasis by inducing epithelial‑mesenchymal transition in osteosarcoma. Oncol Rep. 2017;38:1645–1654. PMID:28731167. doi:10.3892/or.2017.5842.
- Xu W, Xu B, Yao Y, Yu X, Cao H, Zhang J, Liu J, Sheng H. .RNA interference against TRIM29 inhibits migration and invasion of colorectal cancer cells. Oncol Rep. 2016;36(3):1411–1418. PMID:27430345. doi:10.3892/or.2016.4941.
- Yuan Z, Villagra A, Peng L, Coppola D, Glozak M, Sotomayor EM, Chen J, Lane WS, Seto E, .The ATDC. (TRIM29) protein binds p53 and antagonizes p53-mediated functions. Mol Cell Biol. 2010;30(12):3004–3015. PMID:20368352. doi:10.1128/MCB.01023-09.
- Qiu F, Xiong JP, Deng J, Xiang XJ. TRIM29 functions as an oncogene in gastric cancer and is regulated by miR-185. Int J Clin Exp Pathol. 2015;8(5):5053–5061. PMID:26191199.
- Wan YM, Tian J, Qi L, Liu LM, Xu N. ANXA1 affects cell proliferation, invasion and epithelial-mesenchymal transition of oral squamous cell carcinoma. Exp Ther Med. 2017;14(5):5214–5218. PMID:29201239. doi:10.3892/etm.2017.5148.
- Rohwer N, Bindel F, Grimm C, Lin SJ, Wappler J, Klinger B, Blüthgen N, Du Bois I, Schmeck B, Lehrach H, et al. Annexin A1 sustains tumor metabolism and cellular proliferation upon stable loss of HIF1A. Oncotarget. 2016;7(6):6693–6710. PMID: 26760764. doi:10.18632/oncotarget.6793.
- Han G, Lu K, Huang J, Ye J, Dai S, Ye Y, Zhang L. Effect of annexin A1 gene on the proliferation and invasion of esophageal squamous cell carcinoma cells and its regulatory mechanisms. Int J Mol Med. 2017;39(2):357–363. PMID: 28035369. doi:10.3892/ijmm.2016.2840.
- Okano M, Kumamoto K, Saito M, Onozawa H, Saito K, Abe N, Ohtake T, Takenoshita S. Upregulated Annexin A1 promotes cellular invasion in triple-negative breast cancer. Oncol Rep. 2015;33(3):1064–1070. PMID:25592491. doi:10.3892/or.2015.3720.
- Yu S, Meng Q, Hu H, Zhang M. Correlation of ANXA1 expression with drug resistance and relapse in bladder cancer. Int J Clin Exp Pathol. 2014;7(9):5538–5548. PMID:25337195. doi: 1936-2625/ IJCEP0001534.
- De Marchi T, Timmermans AM, Smid M, Look MP, Stingl C, Opdam M, Linn SC, Sweep FC, Span PN, Kliffen M, et al. Annexin-A1 and caldesmon are associated with resistance to tamoxifen in estrogen receptor positive recurrent breast cancer. Oncotarget. 2016;7(3):3098–3110. PMID:26657294. doi:10.18632/oncotarget.6521.
- Croxtall JD, Choudhury Q, Flower RJ. Glucocorticoids act within minutes to inhibit recruitment of signalling factors to activated EGF receptors through a receptor-dependent, transcription-independent mechanism. Br J Pharmacol. 2000;130(2):289–298. PMID:10807665. doi:10.1038/sj.bjp.0703272.
- Sawyer ST, Cohen S. Epidermal growth factor stimulates the phosphorylation of the calcium-dependent 35,000-dalton substrate in intact A-431 cells. J Biol Chem. 1985;260(14):8233–8236. PMID:2409081
- Yuan Y, Anbalagan D, Lee LH, Samy RP, Shanmugam MK, Kumar AP, Sethi G, Lobie PE, Lim LH. ANXA1 inhibits miRNA-196a in a negative feedback loop through NF-kB and c-Myc to reduce breast cancer proliferation. Oncotarget. 2016;7(19):27007–27020. PMID:27105503. doi:10.18632/oncotarget8875.
- Liu QH, Shi ML, Bai J, Zheng JN. Identification of ANXA1 as a lymphatic metastasis and poor prognostic factor in pancreatic ductal adenocarcinoma. Asian Pac J Cancer Prev. 2015;16(7):2719–2724. PMID:25854353. doi:10.7314/APJCP.2015.16.7.2719.
- Zhang X, Li X, Li X, Zheng L, Lei L. ANXA1 silencing increases the sensitivity of cancer cells to low-concentration arsenic trioxide treatment by inhibiting ERK MAPK activation. Tumori. 2015;101(4):360–367. PMID:25983101. doi:10.5301/tj.5000315.
- Unwin RD, Griffiths JR, Whetton AD. Simultaneous analysis of relative protein expression levels across multiple samples using iTRAQ isobaric tags with 2D nano LC-MS/MS. Nat Protoc. 2010;5(9):1574–1582. PMID: 21085123. doi:10.1038/nprot.2010.123.
- Wang L, Sun L, Huang J, Jiang M. Cyclin-dependent kinase inhibitor 3 (CDKN3) novel cell cycle computational network between human non-malignancy associated hepatitis/cirrhosis and hepatocellular carcinoma (HCC) transformation. Cell Prolif. 2011;44(3):291–299. PMID:21535270. doi:10.1111/j.1365-2184.2011.00752.x.
- Wang L, Huang J, Jiang M, Sun L. Survivin (BIRC5) cell cycle computational network in human no-tumor hepatitis/cirrhosis and hepatocellular carcinoma transformation. J Cell Biochem. 2011;112(5):1286–1294. PMID:21312234. doi:10.1002/jcb.23030.