
ABSTRACT
Combination chemotherapy is a potentially promising approach to enhance anticancer activity, overcome drug resistance, and improve disease-free and overall survival. The current study investigates the antitumor activity of sodium dichloroacetic acid (DCA) in combination with SIRT2 inhibitor Sirtinol and AGK2. We found that combining DCA with Sirtinol produced a synergistic therapeutic benefit in A549 and H1299 NSCLC cells in vitro and in a mouse A549 xenograft model. Synergistic potentiation of oxidative phosphorylation (OXPHOS) was observed, including decreased glucose consumption, decreased lactate production, increased OCR and increased ROS generation, possibly via co-targeting pyruvate dehydrogenase alpha 1(PDHA1). Mechanically, AGK2 and Sirtinol were found to increase the lysine-acetylation and decrease the serine-phosphorylation of PDHA1, which enabled the two inhibitors to synergize with DCA to further activate PDHA1. Besides, a AMPKα-ROS feed-forward loop was notably activated after the combined treatments compared with mono-therapy. Our results indicate that the combination of DCA and SIRT2 inhibitor may provide a promising therapeutic strategy to effectively kill cancer cells.
Introduction
Sirtuins (SIRT1-7) are a class of enzymes with nicotinamide adenine dinucleotide (NAD)-dependent protein lysine deacylase function.Citation1 Among these seven members, SIRT2 has been shown to regulate multiple cellular processes including cell motility, cell proliferation and survival, cell-cycle progression, apoptosis, lipid synthesis, fatty acid oxidation, glucogenesis and oxidative stress.Citation2-Citation5 Because of the wide range of its functions, interest in SIRT2 as a potential target leads to the development and utilization of various specific inhibitors.Citation6-Citation10 Among them, AGK2Citation11,Citation12 and SirtinolCitation13,Citation14 are two selective and potent inhibitors which have therapeutic value for cancer intervention.
Sirtinol was identified as an inhibitor of silent information regulator (Sir2) family of proteins in a high throughput phenotypic screening of cells.Citation8 Later researches revealed its anticancer potential in multiple cancer cells, including MCF-7 and H1299 cells.Citation15 Moreover, Sirtinol enhanced chemo-sensitivity to camptothecin and cisplatin in PC3, DU145 and HeLa cells.Citation14,Citation16 AGK2 was originally reported to rescue alpha-synuclein-mediated toxicity in models of Parkinson’s disease.Citation9 Subsequent studies disclosed that AGK2 also achieved neuroprotection in cellular and invertebrate models of Huntington’s disease (HD).Citation17 In addition to its neuroprotective effect, AGK2 was shown to have anti-cancer effects in cervical cancer cellsCitation12,Citation18 and glioma cells.Citation19
Within the past few decades, drug combination therapy has been intensively studied in oncology and other complex disease areas, as this strategy has the potential to improve treatment response, minimize or delay development of resistance and reduce dose and toxicity.Citation20 There is evidence revealing the link between SIRT2 expression and poor prognosis in non-small cell lung cancer,Citation21 as well as its role in the response of the tumor to chemotherapy.Citation22,Citation23 On these bases, we believe that inhibiting SIRT2 pharmacologically by Sirtinol and AGK2 has the potential to enhance sensitivity of current small molecular drugs.
In this study, we combined SIRT2 inhibitor Sirtinol, with a panel of small molecular anticancer agents and we found that Dichloroacetate acid (DCA), a pyruvate dehydrogenase kinase inhibitor, could combine with Sirtinol/AGK2 to produce a synergistic therapeutic benefit. Further, we identified that this drug combination cooperates to activate PDHA1, shift the metabolism to OXPHOS, enhance ROS generation and activate AMPK signaling. These results indicate that the combination of DCA with Sirtinol and AGK2 may provide a promising therapeutic approach for NSCLC.
Results
Combination of Sirtinol/AGK2 with DCA leads to synergistic killing of non-small cell lung cancer cells
To identify the small molecular anticancer agents that would be more effective at killing cancer cells by combining with Sirtinol, A549 cells seeded in 96-well plates were treated with a panel of compounds (5-FU, cisplatin, Irinotecan, Paclitaxel, Erlotinib, Oxaliplatin, Etoposide, Gefitinib, 2DG, DCA, Metformine) with Sirtinol for 72h and cell viability was determined by CCK-8 assay. The results show that Sirtinol could enhance therapeutic effects of several drugs to various extent, with DCA having the most dramatic combinational effect (). DCA is a generic drug with low price which has been used for human treatments for more than 30 years and has the ability to penetrate most tissues after oral administration. Therefore, we carried out further research focusing on DCA and SIRT2 inhibitor. The co-treatment of DCA with Sirtinol or AGK2 effectively decreased survival by 80–90% consistently in both H1299 and A549 cell lines. However, in human embryonic lung fibroblast HFL-1 cells, the cell viability showed no further decrease in co-treatment group compared with single-treatment group, indicating that the combinational strategy was relatively safe for normal cells(). To investigate whether inhibition following co-treatment of Sirtinol and DCA was synergistic or otherwise, cells were treated with increasing doses of Sirtinol (0-50μM) or DCA (0-50mM) alone or in combination at a fixed ratio (1:1000) for 72 h and analyzed by CCK-8 assay. The dose-effect curve for each drug was determined and combination index (CI) values were calculated using Calcusyn software according to the Chou-Talalay method, whereas effect on cell viability was expressed as fraction of cells affected.Citation24,Citation25 CI is a quantitative measure that allows quantitative determination of drug interactions, where CI < 1, 1, and > 1 indicate synergism, additive effect, and antagonism, respectively. As shown in the dose-response curve (), DCA and Sirtinol can both decrease cell growth dose-dependently. Furthermore, combination treatment significantly increased the inhibitory effects on these cells compared to either drug alone, with CI values being less than 1 in the A549, H1299, H522 and PC9 cell lines tested, indicating that Sirtinol and DCA acted synergistically.
Figure 1. DCA and sirtinol synergistically inhibit the growth of A549 and H1299 cells. (A) A549 cells were incubated with sirtinol and a small screen of compounds for 72h. DCA was identified as a possible agent that could synergistically inhibit A549 cell survival. (B) A549, H1299 and HFL-1 cells were treated with the indicated concentrations of DCA and sirtinol or AGK2 for 72h and cell survival was detected by CCK8 assay. Each bar represents the means ± SD of three separate experiments. (C) A549, H1299, H522 and PC9 cells were incubated with DCA and Sirtinol either alone or in combination (1:1000). CCK8 assay was performed to determine the cytotoxic effect. The dose-effect curve and the combination index (CI) values were analyzed by CompuSyn software. Synergy was defined as CI values lower than 1.0. (D) Each mouse was injected subcutaneously with A549 cells under the shoulder. When the tumors were palpable, mice were randomly assigned to treatment with vehicle, DCA (75 mg/kg intraperitoneal[i.p.] injection, three times/week;), Sirtinol (4 mg/kg i.p, three times/week) or the drug combination. The tumors were removed and weighed on the twenty-second day. The original tumors are shown. The values presented are the means ± SD for each group. *P < 0.05 and **P < 0.01 vs. corresponding group.
![Figure 1. DCA and sirtinol synergistically inhibit the growth of A549 and H1299 cells. (A) A549 cells were incubated with sirtinol and a small screen of compounds for 72h. DCA was identified as a possible agent that could synergistically inhibit A549 cell survival. (B) A549, H1299 and HFL-1 cells were treated with the indicated concentrations of DCA and sirtinol or AGK2 for 72h and cell survival was detected by CCK8 assay. Each bar represents the means ± SD of three separate experiments. (C) A549, H1299, H522 and PC9 cells were incubated with DCA and Sirtinol either alone or in combination (1:1000). CCK8 assay was performed to determine the cytotoxic effect. The dose-effect curve and the combination index (CI) values were analyzed by CompuSyn software. Synergy was defined as CI values lower than 1.0. (D) Each mouse was injected subcutaneously with A549 cells under the shoulder. When the tumors were palpable, mice were randomly assigned to treatment with vehicle, DCA (75 mg/kg intraperitoneal[i.p.] injection, three times/week;), Sirtinol (4 mg/kg i.p, three times/week) or the drug combination. The tumors were removed and weighed on the twenty-second day. The original tumors are shown. The values presented are the means ± SD for each group. *P < 0.05 and **P < 0.01 vs. corresponding group.](/cms/asset/31f2c482-1509-4b4e-bd9c-6165005558f6/kcbt_a_1480281_f0001_oc.jpg)
To further validate the synergistic anti-tumor effects of DCA and Sirtinol in vivo, we established the subcutaneous xenograft tumor models by transplanting A549 cells into nude mice. As shown in , compared with single drug treatment, combination of DCA and Sirtinol significantly diminished the tumor weight of A549 xenografts. In addition, the weights of mice did not show significant difference in each group along the experiment procedure, suggesting neither single treatment nor co-treatment of DCA and Sirtinol resulted in significant toxicity in mice (data not shown).
DCA and sirtinol in combination induced a G1 phase block in the cell cycle
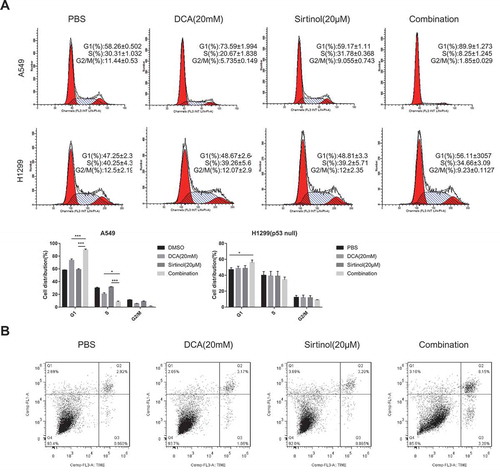
To identify the cellular processes leading to growth inhibition of cultured NSCLC cells, the rates of cell proliferation and apoptosis were measured. Cell cycle analyses by flow cytometry were performed on both A549 and H1299 cells after 48hr of drug exposure. In A549 cells, DCA alone marginally increased cell population in the G0/G1 phase by 16%, whereas Sirtinol demonstrated negligible effect, as compared to control; however, treatment with a combination of DCA and Sirtinol caused a further increase in G0/G1 phase population by 31% (). In H1299 cells, however, either DCA or Sirtinol alone had negligible effect on cell cycle in H1299 cells while the combined treatment caused a mild cell cycle arrest in G0/G1 phase by 10% than either reagent alone at the same concentrations. Notably, no significant cell apoptosis was observed (, Figure S1. A). Considering that DCA and Sirtinol exerted their highly efficient inhibition on H1299 cells without no striking change of cell cycle distribution or cell apoptosis, other cellular processes might contribute to the growth inhibition.
Figure 2. Regulation of cell cycle and cell apoptosis by DCA and sirtinol. (A) A549 and H1299 cells were stimulated with 20mM DCA and Sirtinol(20μM) alone or in combination for 48h and cells were collected for detection of cell cycle. Representative results showing the percentage of cells in G1, S, or G2 phase in A549 and H1299 cells with the indicated drug exposure detected by flow cytometry. Histograms showing the distribution and percentage of cells in G1, S and G2/M phase of the cell cycle. (B) Apoptosis was evaluated after treating H1299 cells with the indicated drug incubation for 72h and staining with Annexin-V and PI. Flow cytometry profile represents Annexin-V-FITC staining in Y axis and PI in X axis. The number represents the percentage of apoptotic cells in each condition (upper right quadrant).
Sirtinol/agk2 synergize with DCA to shift energy metabolism toward OXPHOS
Cancer cells metabolically exert the Warburg effect, which is characterized by preferable consumption of glucose for energy under aerobic conditions rather than mitochondrial oxidative phosphorylation (OXPHOS).Citation26 Interestingly, this cancer-specific metabolic remodeling can be reversed by dichloroacetate (DCA), a mitochondria-targeting small molecule able to penetrate most tissues after oral administration. It is known to inhibit the pyruvate dehydrogenase kinase (PDK) that downregulates the activity of pyruvate dehydrogenase (PDH), resulting in a shift of pyruvate metabolism away from lactic acid formation, towards respiration.Citation27 Therefore, we set out to determine the effect of drug combination on metabolism. While DCA significantly decreased glucose consumption and lactate production compared to negative control group as reported previously, combinational treatment for 30h could induce a further decrease (, B). Meanwhile, the oxygen consumption rate (OCR; measure of mitochondrial respiration) was measured in a Seahorse Bioscience XF24 extracellular flux analyzer. As expected, DCA exposure for 30h resulted in increased OCR levels compared to control cells. The same pattern was observed with AGK2 treatment group, while the co-treatment group displayed a further increase in OCR ().
Figure 3. DCA synergize with Sirtinol/AGK2 to induce a metabolic remodeling towards oxidative phosphorylation (OXPHOS). (A) Effect of DCA and Sirtinol on glucose consumption and lactate release. In comparison to untreated control, reduction of glucose consumption(A) and lactate production(B) in the supernatants were proved following mono-therapy while simultaneous treatment caused a further decrease. (C) Oxygen consumption rate (OCR; measure of mitochondrial respiration) was measured using the Seahorse Bioanalyzer. (D) Cells were incubated with the indicated concentrations of drugs for 72h and intracellular ROS levels were determined by DCFH-DA fluorescence as analyzed by flow cytometry. Representative flow cytometric histograms show a broad unimodal distribution of DCF fluorescence in different cell groups. Increase in the ROS levels is indicated as a shift in the histograms. The lower panel was quantitative analysis of ROS. All data represent the mean ± SD of 3 independent experiments (**P < 0.01, ***P < 0.001compared with the other groups). (E) Accumulation of mitochondrially generated superoxide in A549 cells as detected by MitoSOX (Top: MitoSOX red; Bottom: Phase contrast). Several independent fields were photographed and representative fields for each condition are shown. (F) Synergistic growth inhibitory effect of DCA and Sirtinol was recovered by NAC. Cells were pretreated with or without N-acetylcysteine (NAC, 3 mM) for 3 h at 37°C before drug exposure. Cell viability was then determined by CCK8 assay. Values are represented as means ± SD; n = 5. *P < 0.05, **P < 0.01.
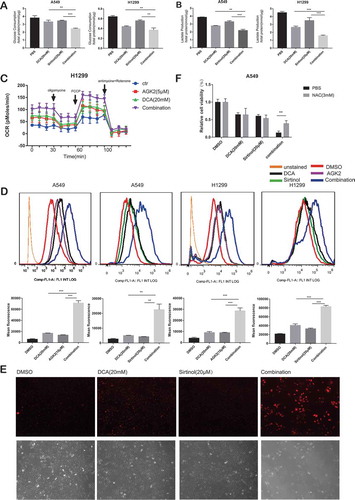
Next, we analyzed ROS levels using flow cytometry with 2ʹ7’-dichlorofluorescin diacetate (DCF-DA). Elevated reactive oxygen species (ROS) was observed when A549 cells were stimulated with each drug alone, however, the ROS levels were significantly accentuated in the combination group. The results were similar in H1299 cells (). Also, we measured mitochondrial ROS production using MitoSOX Red, a fluorogenic superoxide-detecting dye that specifically targets mitochondria. Untreated A549 cancer cells, or cells treated with DCA or Sirtinol alone, show only a few positively stained cells. However, when the cells were exposed to both Sirtinol and DCA for 72h, a dramatic increase in accumulation of red fluorescence is seen (), showing that the presence of both Sirtinol and DCA results in the generation of significant levels of mitochondrial ROS. To provide more direct evidence that the ROS production are involved in the enhanced killing of the cancer cells by AGK2/Sirtinol and DCA, we pretreated cells with the known ROS scavenger N-acetylcysteine (NAC) for 3h. The results using NAC showed that the enhanced killing of A549 cancer cells observed in the presence of both DCA and Sirtinol was largely prevented if NAC (3mM) was present during the 48h incubation ().
Altogether, these data demonstrate that the combination of DCA with AGK2/Sirtinol could cause a synergistic metabolic shift towards mitochondrial respiration.
Sirtinol and AGK2 synergize with DCA to activate PDHA1
The molecular mechanisms underlying synergistic effects of drug combinations have been extensively evaluated and various modes of action have been revealed, among which regulating the same target represents one kind.Citation28 Interestingly, as demonstrated in , Sirtinol and DCA showed similar metabolic phenotype, including decreased glycolytic metabolic flux and increased TCA metabolic flux, while the two together could induce a further inhibition of the Warburg effect. These evidences prompted us to explore whether DCA and Sirtinol had the same metabolic target.
DCA inhibits pyruvate dehydrogenase kinase (PDK), which negatively regulate pyruvate dehydrogenase (PDH) complex by phosphorylating pyruvate dehydrogenase E1α (PDHA1). There are four known isozymes of PDK in humans, PDK1-4. After knocking down each of them using siRNA, we found that PDK2 elimination significantly sensitized cells to Sirtinol exposure (FigureS1. B), suggesting the involvement of PDK2 in the synergistic killing effect. Accordingly, we detected the mRNA level, the protein level, the serine-phosphorylation level, threonine-phosphorylation level and lysine-acetylation level of PDK2, but none of them showed any change in response to Sirtinol stimulation (data not shown). Hence, we moved on to PDHA1.
PDHA1 is the first component enzyme of the PDH complex that catalyzes the irreversible decarboxylation of pyruvate into acetyl-CoA and NADH that is subsequently used by both the citric acid cycle and oxidative phosphorylation to generate ATP.Citation29 As such, PDH is the major gateway linking glycolysis to oxidative phosphorylation. PDHA1 have three classic active sites, S232, S293 and S300, the reversible phosphorylation of which regulates PDHA1 activity. Therefore, we set out by checking regulation of PDHA1 serine phosphorylation by AGK2 and Sirtinol. Firstly, we generated a lentiviral vector expressing PDHA1 with a Flag tag on its carboxyl terminus (PDHA1-Flag). Following transfection into H1299 cells, PDHA1-Flag proteins were immunoprecipitated with anti-Flag gel and immunoblotted with phosphor-serine-specific antibodies. Following treating with AGK2 or sirtinol, PDHA1 showed decreased serine phosphorylation (). Further, we constructed the 3D (S232/293/300D) mutant form of PDHA1 mimicking the three serine phosphorylation sites for PDKs and transfected it into H1299 cells. As shown in , AGK2 failed to decrease the serine phosphorylation of the 3D mutant, suggesting that AGK2 was involved in regulation of PDHA1 active site. What’s more, using a specific antibody against S293 on PDHA1, we found that Sirtinol and AGK2 could decrease S293 phosphorylation levels of overexpressed exogenous PDHA1 proteins in A549 and H1299 PDHA1-Flag-EGFP overexpression stable cell line (), providing further evidence that Sirtinol/AGK2 may activate PDHA1. Next, we treated both A549 and H1299 cells with AGK2 and Sirtinol, and we found that both AGK2 and Sirtinol treatment decreased phosphorylation level of endogenous PDHA1 at serine 293 (P-S293), which is a key indicator of PDC activity ().
Figure 4. PDHA1 activation contributed to the synergistic killing effect. (A) H1299 cells were transduced with lentivirus expressing wild type (WT) or DDD mutant PDHA1-Flag, and treated with the indicated inhibitor for 24h, followed by immunoprecipitation with anti-Flag gel and immunoblotting with anti-p-Ser antibodies. (B) Phosphorylation of exogenously expressed wildtype PDHA1-Flag-EGFP vector at serine 293 was decreased following Sirtinol and AGK2 treatment for 24h. (C) A549 and H1299 were treated with increasing dose of Sirtinol and AGK2. 48h later, whole cell lysates were prepared from indicated cancer cells, and subjected to immunoblotting with anti-PDHA1 antibody and phosphoS293 antibody. (D) Exogenous PDHA1-Flag from A549 cells incubated with the indicated inhibitors for 24h were IPed with Flag-gel and immunoblotted with anti-p-ser antibody and anti-flag antibody. (E) Cells were treated with DCA (20mM) and Sirtinol (20μM) alone or in combination. After 24h, cell lysates were extracted and examined for phospho-PDHA1 (S293) and anti-PDHA1 using immunoblotting. (F) H1299 cells were transfected with siPDHA1, followed by rescue expression of FLAG-tagged WT and 3D PDHA1 variants which harbor silent mutations that confer PDHA1 siRNA-resistance, and subjected to drug treatment for 48h before CCK8 assay was performed.
Now that AGK2 and Sirtinol can regulate PDHA1 phosphorylation as DCA, we have reason to believe that PDHA1 activation might contribute the synergistic killing effect. As illustrated in , serine-phosphorylation of overexpressed exogenous PDHA1-Flag was further decreased upon co-treatment compared with mono-incubation in A549 cells. In addition to that, while DCA (20mM) and Sirtinol (20μM) regulate serine293 phosphorylation of PDHA1 modestly on their own, simultaneous treatment caused a further decrease in PDHA1 p293 levels (). In order to further decipher the role of PDHA1 activation in the synergistic effect, H1299 cells were transfected with siRNA against PDHA1 and the knocking down efficiency was validated by western blotting (Figure S1. C). SiRNA-resistant form of WT and S232/293/300D PDHA1 were put back into the PDHA1 knock-down cell line. Results showed that the synergistic effect was partially abrogated in the 3D overexpressed group as compared with WT overexpressed group (). Collectively, these results suggest that the synergistic activation of PDHA1 may contribute to the enhanced killing effect.
Sirtinol and AGK2 synergize with DCA by inhibiting SIRT2
As Sirtinol displays inhibitory activity toward both SIRT1 and SIRT2, it’s unclear which one is involved in the synergistic killing effect. We treated H1299 cells with Ex-527, a specific Sirt1 inhibitor, and DCA either alone or in combination. As illustrated in , Ex-527 failed to combine with DCA to exert the synergistic killing effect as Sirtinol and AGK2 did, which indicated that the combinational effect was dependent on SIRT2. To further examine this conjecture, H1299 cells were transfected with either control siRNA or siRNA against SIRT2 (. D). The transfected cells were then incubated with increasing concentration of DCA (5-20mM) for 48 h before the cells were subjected to CCK8 analysis and ROS detection. As shown in , silencing of endogenous SIRT2 could enhance sensitivity to DCA compared with control group, especially at the 20mM concentration of DCA. Moreover, siRNA-mediated knockdown of endogenous SIRT2 could also increase ROS production induced by DCA as compared with control group (). As expected, phosphorylation of ser293 was decreased upon SIRT2 knocking down ().
Figure 5. Silencing of Sirt2 enhanced sensitivity to DCA. (A) Cells were incubated with the indicated concentrations of drugs for 72h and cell survival was detected by CCK8 assay. Each bar represents the means ± SD of three separate experiments. (B) DCA-induced cell growth inhibition after siRNA transfection was measured by CCK8 assay. (C) DCA-induced ROS generation after siRNA transfection was measured by flow cytometry. (D) Cell were transfected with siRNAs against SIRT2 and whole cell lysates were subjected to immunoblotting for detection of PDHA1 and p-PDHA1 (S293) 72hr later. (E) Whole cell lysates from the indicated stable cell lines with AGK2 treatment for 12hor 48h after Sirt2 overexpression were IPed with anti-Flag gel, and subsequently immunoblotted with an anti-panacetyllysine and Flag antibody.
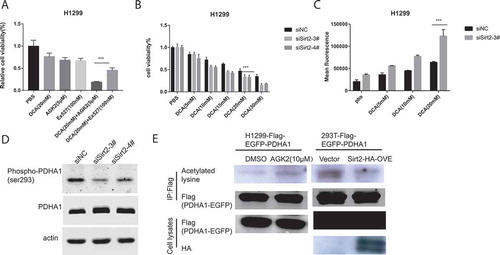
Previous reports have shown that changing PDHA1 acetylation could affect PDHA1 activity by altering its phosphorylation status.Citation30 Thus, we measured the acetylation of PDHA1 in response to AGK2 treatment. Flag-PDHA1 overexpressed stable line was treated with AGK2 or transfected with HA-SIRT2, then cell extracts were immunoprecipitated (IPed) using Flag-beads and subsequently immunoblotted with an anti-pan acetyl-lysine and anti-Flag antibody. As shown in , acetylation on lysine residues was increased following AGK2 stimulation. This finding was further substantiated by the observation that SIRT2 overexpression decreased lysine acetylation of PDHA1. These results indicate that AGK2 and Sirtinol may regulate PDHA1 through modifying its acetylation by inhibiting SIRT2.
Cotreatment of DCA and sirtinol exhibits synergistic effect on AMPK activity
AMP-activated protein kinase (AMPK) is a key energetic sensor and regulator of cellular metabolism that is activated by either a reduction in the intracellular ratio ATP/AMP or by the elevation of intracellular ROS levels.Citation31,Citation32 Because a ROS burst was found to occur in the combinational group, we examined whether AMPK was activated. A549 and H1299 cell lines were treated with agents alone or in combination for 48 h followed by evaluation of AMPK phosphorylation (Thr172) using Western blot analysis. As illustrated in , treatment with each drug alone resulted in a mild increase in AMPK activation while combinational treatment of DCA and Sirtinol induced a striking activation. To test whether AMPK phosphorylation/activation underlies the synergistic killing effect, we used CCK8 assay to evaluate the combinational effect after knocking down AMPKα in A549 cells. The siRNA knocking down efficiency was validated by Western Blot analysis (Figure S1. E). As shown in , A549 cells transfected with control siRNA responded to combinational treatment with conspicuous inhibition, those transfected with AMPK siRNA demonstrated only diminutive effects upon viability. The results suggest that the effect of combinational therapy of DCA with Sirtinol/AGK2 is mediated, at least in part, by AMPK activation.
Figure 6. Cotreatment of DCA and Sirtinol exhibits synergistic effect on AMPK activity. (A) A549 and H1299 cells were stimulated with DCA (20mM) and Sirtinol (20μM) alone or in combination for 48h and endogenous AMPK and pThr172-AMPK were measured by Western blot assays. (B) After transfected with AMPK siRNA or control siRNA for 48h, cells were incubated with the indicated drugs for another 48h and cell viability was observed with CCK8 method. (C) A549 cells were pretreated with or without NAC for 3 h before exposure to the indicated drugs for 48h. Whole cell lysates were subjected to immunoblotting for phospho-AMPK (T172) and AMPK detection. (D) Effects of AMPK knocking down on ROS production induced by DCA and AGK2 for 72h. Intracellular fluorescence intensity was quantified by FACS flow cytometry. Results represent the average ± SD. from three independent experiments (*P < 0.05, **P < 0.05).
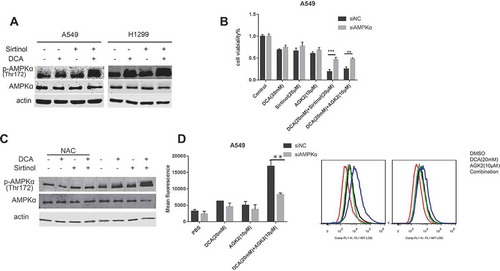
To gain further insight into the link between the synergistic ROS production and AMPK activation, we administered NAC to A549 cells and we found that the synergistic AMPK activation was partially abolished (). It implies that AMPK activation induced by the combinational treatment was partially mediated via ROS production, as reported previously.Citation32 Interestingly, after AMPK knocking-down by siRNA transfection, synergistic ROS generation was largely diminished (). Together these data suggest the existence of a AMPK-ROS feed-forward cascade.
Discussion
Recently, mounting evidence implies the dynamic regulatory role of SIRT2 in multiple biological processes such as cell cycle regulation, autophagy, metabolism, immune and inflammatory responses. Dysregulation of SIRT2 was considered as a main aspect contributing to several human diseases, including cancer. However, its role in drug sensitivity of non-small lung cancer cells (NSCLC) is rarely investigated. Our present study was aimed at determining whether selective inhibition of SIRT2 pharmacologically, with Sirtinol and AGK2, would potentiate the anti-cancer potential of current small molecule drugs in NSCLC. Through a small-scale screening using CCK8 assay, we identified that DCA could combine with SIRT2 inhibitor to kill A549 and H1299 cells in a synergistic manner in vitro and in vivo. What’s more, DCA could work with SIRT2 inhibitor to induce a further metabolic shift from glycolysis to OXPHOS compared with either drug alone, possibly through synergistic activation of PDHA1. Also, AMPK signaling was activated in response to ROS generation induced by combinational treatment and could act as positive feedback regulators of ROS. These findings provide a potential treatment strategy for NSCLC patients.
Targeting mitochondrial energy metabolism is a novel approach in cancer research and can be traced back to the description of the Warburg effect. In our results, it’s demonstrated that, similar to DCA treatment, the SIRT2 inhibitor Sirtinol and AGK2 could induce a metabolic remodeling from glycolysis to OXPHOS, including decreased glucose consumption, decreased lactate production, increased OCR and increased ROS generation. Previous studies have identified several metabolic enzyme in the glycolysis pathway to be downstream deacetylation targets of SIRT2.Citation33 However, its role in glycolysis (pro or anti) remains debatable. Seong-Hoon et al found that SIRT2-lacking cells exhibited a higher extent of glycolytic phenotype in mammary tumor cells by targeting PKM2,Citation34 Young et al found that knockdown of SIRT2 resulted in significantly decreased OXPHOS and increased glycolysis by targeting enolase, GAPDH and aldolase in human fibroblasts.Citation35 In contrary, Xu et al found that SIRT2 could enhance glycolysis in A549 and MEF cells by targeting PGAM2.Citation3,Citation36 Wang et al revealed that SIRT2 could inhibit oxidative stress by activating G6PDCitation2 in HEK293T cells. In the present study, SIRT2 inhibitors were shown to decrease the serine-phosphorylation level of PDHA1, which might result from changing of lysine-acetylation level. This suggested SIRT2 as a new potential deacetylase of PDHA1. The distinct functional roles of SIRT2 and various substrates between these studies possibly reflect cell-context differences, such as various basal expression level or activity of metabolic enzymes, basal glycolysis level of cells, and interference (redundancy or competition) from other Sirtuin members.
Of course, the specific acetylation site on PDHA1 awaits further exploration to validate the direct link between SIRT2 and PDHA1. The lysine-acetylation status of PDHA1 has been shown to be able to modulate its activity by impacting the affinity with its upstream regulator, PDK1 and PDP1Citation37, so there’s a great chance that deacetylation of PDHA1 by SIRT2 in our experiment could dissociate PDK from PDHA1’s active site to inhibit its phosphorylation and synergize with DCA. In this regard, the detailed mechanism by which the acetylation of lysine changed its phosphorylation remains to be determined.
In addition to synergistic PDHA1 activation, a synergistic activation of AMPK signaling was also observed, and its involvement in the synergistic interaction of DCA and Sirtinol/AGK2 was proved by knocking it down, which further validated AMPK’s role in cancer prevention and treatment demonstrated by others.Citation38 In accordance with previous studies, our results showed AMPK and ROS could work in a positive feedback loop. However, the relationship between the AMPK-ROS loop and PDHA1 activation was unclear. Interestingly, Laura LCitation39 found that AMPK activator 5-aminoimidazole-4-carboxamide-1-β-D-ribofuranoside (AICAR) treatment could inhibit p-PDHA1 (S293) in kidneys of a steptozotocin-induced mouse model of type 1 diabetes. This result provides us with a possibility that the synergistic AMPK activation could further contribute to the PDHA1 activation in a feed-forward way. Therefore, the cascade relationship between PDHA1 activation, ROS generation and AMPK activation needs further investigation.
AMPK has been shown to be necessary for cell-cycle arrest at the G1 phase, via phosphorylation of the tumor suppressors p53.Citation40,Citation41 As a result, the cell cycle arrest at G1 phase induced by Sirtinol and DCA in A549 cells could be mediated by P21 accumulation downstream of AMPK-P53 activation (. F). As a comparison, in H1299 cells which harbor a homozygous deletion at the p53 gene, the combinational treatment could induce cell cycle arrest to a much lesser extent. One explanation for the minor cell cycle arrest effect without P21 increase could be due to modification of p27,Citation42 another cell cycle regulator downstream of AMPK signaling. In the present study, no significant cell apoptosis was observed after drug stimulation, either alone or in combination. Although studies have been undergoing for years, the key factors which may impede the pro-apoptotic effect of DCA are not yet clear. By further study, we revealed that Akt was activated in the process (data not shown), which may serve as a compensatory mechanism to keep the cell from going through apoptosis, yet other effectors remain to be discovered.
Altered metabolic factors and pathways of cancer cells have been suggested as important targets for the development of novel, combinatory drugs to improve response to conventional therapy. Our results showed that combining SIRT2 inhibitor Sirtinol/AGK2 with DCA could significantly promote cancer inhibition when compared with either mono-therapy, providing a rationale for synergism of these drugs to inhibit proliferation of NSCLC cells.
Materials and methods
Cell culture and reagents
All cell lines used were purchased from The Cell Bank of Type Culture Collection of Chinese Academy of Sciences (CAS, Shanghai). Cells were maintained in DMEM or RPMI-1640 or F12K containing 10% FBS (GIBCO), 100 U/ml penicillin, and 100 mg/ml streptomycin (Invitrogen, Carlsbad, CA). The cells were incubated at 37°C in a humidified atmosphere containing 5% CO2. The growth medium was changed 2–3 times per week and subcultured when 80% confluent.
Sodium dichloroacetate, metformin, 5-Fluorouracil, Erlotinib, and 2-Deoxy-D-glucose were from Sigma. Sirtinol, AGK2, Irinotecan, Saracatinib, Cisplatin, Oxaliplatin, Etoposide and gefitinib were from Selleck Chemicals. Paclitaxel was from Bristol-Myers Squibb.
Drug combination studies
3X10Citation3cells per well in 100μl of media were seeded and grown in a 96-well plate. Cells were then treated with serial concentrations of DCA (0-50mM) or Sirtinol (0-50μM) singly or in combination at a constant DCA:Sirtinol ratio (1:1000) for 72h. Cell viability was measured by CCK8 assay (Dojindo Molecular Technologies, Inc.). Potential synergy between the drugs was assessed using the Chou-Talalay method to estimate the combination index (CI) using Calcusyn software.
Plasmids, site-directed mutagenesis and sirna transfection
Full-length PDHA1 was cloned into pLenti-CMV-EGFP-3FLAG-PGK-Puro (purchased from Obio Technology Shanghai Co. Ltd). SIRT2 was cloned into pCDNA3.0-5ʹ-HA. Point mutations for S232/293/300D PDHA1 andsiRNA-resistant PDHA1 overexpression vector were generated by site-directed mutagenesis. Oligonucleotides used to construct point mutants were listed in Table S1.
Small interference RNA (siRNA) were synthesized by GenePharma Co., Ltd. (Shanghai, China). The siRNA sequences are as following: siSIRT2: 5ʹ-CGGCACGAAUACCCGCUAATT-3ʹ, siPDHA1: 5ʹ- GUCUAGCCUGUAAGUAUATT-3ʹ, siAMPK: 5ʹ-CGGGAUCAGUUAGCAACUATT-3ʹ.
Metabolism assays
The extracellular glucose was measured with Glucose (GO) Assay Kit (Sigma). The extracellular lactate was measured in the medium with Lactate Reagent (Sigma). The OCR was measured using a cartridge containing an optical fluorescent O2 sensor in a Seahorse Bioscience XF24 Extracellular Flux Analyzer. All the measurements were normalized to cell numbers and intracellular protein concentration. Protein concentration was assessed with BCA Assay Kit (Beyotime) as described in manufacturer´s instructions.
Intracellular measurement of ROS
Cells were washed with PBS and incubated in 10μM 2ʹ,7ʹ-dichlorofluorescin diacetate (SIGMA-ALDRICH D6883) in complete DMEM for 30 min before being washed with PBS and dissociated with Trypsin/EDTA. Cells were then resuspended in PBS and the levels of fluorescence in the FL1 channel was analyzed using a flow cytometer (Beckman). The excitation and emission wave lengths were set to 485 and 535 nm, respectively.
Mitochondrial superoxide was detected using the fluorescent MitoSox probe (Invitrogen). Cells were incubated in Hank’s buffer with 2μM MitoSox-Red for 30min at 37°C in a 5% CO2 atmosphere, washed with PBS and the fluorescence was assessed by fluorescence microscopy.
Immunoprecipitation and immunoblotting
Cells were harvested and lysed by IP cell lysis buffer (Beyotime) containing certain protease inhibitors. Whole cell lysates were incubated with Anti-Flag affinity gel (Sigma) overnight at 4°C. Immunoprecipitates were washed five times and resuspended in 20μl of 2X SDS loading buffer.
Primary antibodies against PDHA1 (Proteintech), phospho-PDHE1-A type I Ser293 (Merck), phospho-Serine (Invitrogen), Acetylated-Lysine (CST), p21 Waf1/Cip1(CST),p53 (CST),HA (Abmart), Flag (Abmart),β-actin (Sigma), β-Tubulin (Proteintech), p-AMPKαThr172 (CST), AMPKα(CST)were purchased. Goat anti-Mouse second antibody IRDye 800CW and Goat anti-Rabbit second antibody IRDye 680RD were obtained from LI-COR.
Mouse xenografts and in vivo drug study
A549 cells (5X10Citation6cells per flank) were injected subcutaneously in to the left flank of 3-week-old nude mice (6 mice per group). Once the tumors were palpable, mice were randomly assigned to treatment with vehicle, DCA (75 mg/kg intraperitoneal[i.p.] injection, three times/week;), Sirtinol (4mg/kg i.p, three times/week) or the drug combination, in which each compound was administered at the same dose and schedule as single agents. Body weight was monitored weekly as an indicator of drug-induced toxicity and overall health of the mice. On the twenty-second day, all mice were sacrificed by cervical dislocation, and the tumor were immediately removed and weighed.
Statistical analysis
Statistical analysis was performed using Prism 7.0 GraphPad Software. One-way or Two-way Analysis of Variance (ANOVA) was used for group wise comparisons. Student’s t test (2-tailed) was used for comparisons between two groups. Results represent at least two to three independent experiments and are shown as averages ± SD.
Supplemental Material
Download Zip (1.4 MB)Supplemental data
The supplemental data for this article can be accessed here
Disclosure statement
The authors declare no conflicts of interest.
Additional information
Funding
References
- Imai S, Armstrong CM, Kaeberlein M. Guarente L Transcriptional silencing and longevity protein Sir2 is an NAD-dependent histone deacetylase. Nature. 2000;403(6771):795–800. doi:10.1038/35001622.
- Wang Yp, Zhou Ls, Zhao Yz, Wang Sw, Chen Ll, Liu Lx, Ling Zq, Hu Fj, Sun Yp, Zhang Jy et al. Regulation of G6PD acetylation by SIRT2 and KAT9 modulates NADPH homeostasis and cell survival during oxidative stress. EMBO J. 2014;33(12):1304–1320. doi:10.1002/embj.201387224.
- Xu Y, Li F, Lv L, Li T, Zhou X, Deng CX, Guan KL, Lei QY. Xiong Y Oxidative stress activates SIRT2 to deacetylate and stimulate phosphoglycerate mutase. Cancer Res. 2014;74(13):3630–3642. doi:10.1158/0008-5472.CAN-13-3615.
- Wang F, Nguyen M, Qin FX. Tong Q SIRT2 deacetylates FOXO3a in response to oxidative stress and caloric restriction. Aging Cell. 2007;6(4):505–514. doi:10.1111/j.1474-9726.2007.00304.x.
- Zhao D, Zou SW, Liu Y, Zhou X, Mo Y, Wang P, Xu YH, Dong B, Xiong Y, Lei QY, et al. Lysine-5 acetylation negatively regulates lactate dehydrogenase A and is decreased in pancreatic cancer. Cancer Cell. 2013;23(4):464–476. doi:10.1016/j.ccr.2013.02.005.
- Rumpf T, Schiedel M, Karaman B, Roessler C, North BJ, Lehotzky A, Olah J, Ladwein KI, Schmidtkunz K, Gajer M, et al. 2015; Selective Sirt2 inhibition by ligand-induced rearrangement of the active site. Nat Commun. 6:6263. doi:10.1038/ncomms7263.
- Jing H, Hu J, He B, Negron Abril YL, Stupinski J, Weiser K, Carbonaro M, Chiang YL, Southard T, Giannakakou P, et al. A SIRT2-Selective inhibitor promotes c-Myc oncoprotein degradation and exhibits broad anticancer activity. Cancer Cell. 2016;29(5):767–768. doi:10.1016/j.ccell.2016.04.005.
- Grozinger CM, Chao ED, Blackwell HE, Moazed D. Schreiber Sl Identification of a class of small molecule inhibitors of the sirtuin family of NAD-dependent deacetylases by phenotypic screening. J Biol Chem. 2001;276(42):38837–38843. doi:10.1074/jbc.M106779200.
- Outeiro TF, Kontopoulos E, Altmann SM, Kufareva I, Strathearn KE, Amore AM, Volk CB, Maxwell MM, Rochet JC, McLean PJ, et al. Sirtuin 2 inhibitors rescue alpha-synuclein-mediated toxicity in models of Parkinson’s disease. Science. 2007;317(5837):516–519. doi:10.1126/science.1143780.
- Cheon MG, Kim W, Choi M, Je: Ak-1 K. a specific SIRT2 inhibitor, induces cell cycle arrest by downregulating Snail in HCT116 human colon carcinoma cells. Cancer Lett. 2015;356(2 Pt B):637–645. doi:10.1016/j.canlet.2014.10.012.
- Zhao D, Mo Y, Li MT, Zou SW, Cheng ZL, Sun YP, Xiong Y, Guan KL, Qy L. NOTCH-induced aldehyde dehydrogenase 1A1 deacetylation promotes breast cancer stem cells. J Clin Invest. 2014;124(12):5453–5465. doi:10.1172/JCI76611.
- Singh S, Kumar PU, Thakur S, Kiran S, Sen B, Sharma S, Rao VV, Poongothai AR. Ramakrishna G Expression/localization patterns of sirtuins (SIRT1, SIRT2, and SIRT7) during progression of cervical cancer and effects of sirtuin inhibitors on growth of cervical cancer cells. Tumour Biol. 2015;36(8):6159–6171. doi:10.1007/s13277-015-3300-y.
- Wang J, Kim TH, Ahn MY, Lee J, Jung JH, Choi WS, Lee BM, Yoon KS, Yoon S. Kim HS: sirtinol, a class III HDAC inhibitor, induces apoptotic and autophagic cell death in MCF-7 human breast cancer cells. Int J Oncol. 2012;41(3):1101–1109. doi:10.3892/ijo.2012.1534.
- Peck B, Chen CY, Ho KK, Di Fruscia P, Myatt SS, Coombes RC, Fuchter MJ, Hsiao CD. Lam Ew SIRT inhibitors induce cell death and p53 acetylation through targeting both SIRT1 and SIRT2. Mol Cancer Ther. 2010;9(4):844–855. doi:10.1158/1535-7163.MCT-09-0971.
- Ota H, Tokunaga E, Chang K, Hikasa M, Iijima K, Eto M, Kozaki K, Akishita M, Ouchi Y. Kaneki M Sirt1 inhibitor, Sirtinol, induces senescence-like growth arrest with attenuated Ras-MAPK signaling in human cancer cells. Oncogene. 2006;25(2):176–185. doi:10.1038/sj.onc.1209049.
- Jin KL, Park JY, Noh EJ, Hoe KL, Lee JH, Kim JH. Nam Jh The effect of combined treatment with cisplatin and histone deacetylase inhibitors on HeLa cells. J Gynecol Oncol. 2010;21(4):262–268. doi:10.3802/jgo.2010.21.4.262.
- Luthi-Carter R, Taylor DM, Pallos J, Lambert E, Amore A, Parker A, Moffitt H, Smith DL, Runne H, Gokce O, et al. SIRT2 inhibition achieves neuroprotection by decreasing sterol biosynthesis. Proc Natl Acad Sci U S A. 2010;107(17):7927–7932. doi:10.1073/pnas.1002924107.
- Kim HW, Kim SA. Ahn Sg Sirtuin inhibitors, EX527 and AGK2, suppress cell migration by inhibiting HSF1 protein stability. Oncol Rep. 2016;35(1):235–242. doi:10.3892/or.2015.4381.
- He X, Nie H, Hong Y, Sheng C, Xia W. Ying W SIRT2 activity is required for the survival of C6 glioma cells. Biochem Biophys Res Commun. 2012;417(1):468–472. doi:10.1016/j.bbrc.2011.11.141.
- Webster RM. Combination therapies in oncology. Nat Rev Drug Discov. 2016;15(2):81–82. doi:10.1038/nrd.2016.3.
- Grbesa I, Pajares MJ, Martinez-Terroba E, Agorreta J, Mikecin AM, Larrayoz M, Idoate MA, Gall-Troselj K, Pio R. Montuenga Lm Expression of sirtuin 1 and 2 is associated with poor prognosis in non-small cell lung cancer patients. PLoS One. 2015;10(4):e0124670. doi:10.1371/journal.pone.0124670.
- Matsushita N, Takami Y, Kimura M, Tachiiri S, Ishiai M, Nakayama T. Takata M Role of NAD-dependent deacetylases SIRT1 and SIRT2 in radiation and cisplatin-induced cell death in vertebrate cells. Genes Cells. 2005;10(4):321–332. doi:10.1111/j.1365-2443.2005.00836.x.
- Hoffmann G, Breitenbucher F, Schuler M. Ehrenhofer-Murray Ae A novel sirtuin 2 (SIRT2) inhibitor with p53-dependent pro-apoptotic activity in non-small cell lung cancer. J Biol Chem. 2014;289(8):5208–5216. doi:10.1074/jbc.M113.487736.
- Chou TC. Theoretical basis, experimental design, and computerized simulation of synergism and antagonism in drug combination studies. Pharmacol Rev. 2006;58(3):621–681. doi:10.1124/pr.58.3.10.
- Chou TC. Drug combination studies and their synergy quantification using the Chou-Talalay method. Cancer Res. 2010;70(2):440–446. doi:10.1158/0008-5472.CAN-09-1947.
- Vander Heiden MG, Cantley LC. Thompson Cb Understanding the warburg effect: the metabolic requirements of cell proliferation. Science. 2009;324(5930):1029–1033. doi:10.1126/science.1160809.
- Bonnet S, Archer SL, Allalunis-Turner J, Haromy A, Beaulieu C, Thompson R, Lee CT, Lopaschuk GD, Puttagunta L, Harry G, et al. A mitochondria-K+ channel axis is suppressed in cancer and its normalization promotes apoptosis and inhibits cancer growth. Cancer Cell. 2007;11(1):37–51. doi:10.1016/j.ccr.2006.10.020.
- Jia J, Zhu F, Ma X, Cao Z, Li Y. Chen Yz Mechanisms of drug combinations: interaction and network perspectives. Nat Rev Drug Discov. 2009;8(2):111–128. doi:10.1038/nrd2683.
- Linn TC, Pettit FH. Reed Lj Alpha-keto acid dehydrogenase complexes. X. Regulation of the activity of the pyruvate dehydrogenase complex from beef kidney mitochondria by phosphorylation and dephosphorylation. Proc Natl Acad Sci U S A. 1969;62(1):234–241.
- Jing E, O’Neill BT, Rardin MJ, Kleinridders A, Ilkeyeva OR, Ussar S, Bain JR, Lee KY, Verdin EM, Newgard CB, et al. Sirt3 regulates metabolic flexibility of skeletal muscle through reversible enzymatic deacetylation. Diabetes. 2013;62(10):3404–3417. doi:10.2337/db12-1650.
- Faubert B, Boily G, Izreig S, Griss T, Samborska B, Dong Z, Dupuy F, Chambers C, Fuerth BJ, Viollet B, et al. AMPK is a negative regulator of the warburg effect and suppresses tumor growth in vivo. Cell Metab. 2013;17(1):113–124. doi:10.1016/j.cmet.2012.12.001.
- Mungai PT, Waypa GB, Jairaman A, Prakriya M, Dokic D, Ball MK. Schumacker Pt Hypoxia triggers AMPK activation through reactive oxygen species-mediated activation of calcium release-activated calcium channels. Mol Cell Biol. 2011;31(17):3531–3545. doi:10.1128/MCB.05124-11.
- Gomes P, Outeiro TF. Cavadas C Emerging role of sirtuin 2 in the regulation of mammalian metabolism. Trends Pharmacol Sci. 2015;36(11):756–768. doi:10.1016/j.tips.2015.08.001.
- Park SH, Ozden O, Liu G, Song HY, Zhu Y, Yan Y, Zou X, Kang HJ, Jiang H, Principe DR, et al. SIRT2-mediated deacetylation and tetramerization of pyruvate kinase directs glycolysis and tumor growth. Cancer Res. 2016;76(13):3802–3812. doi:10.1158/0008-5472.CAN-15-2498.
- Cha Y, Han MJ, Cha HJ, Zoldan J, Burkart A, Jung JH, Jang Y, Kim CH, Jeong HC, Kim BG, et al. Metabolic control of primed human pluripotent stem cell fate and function by the miR-200c-SIRT2 axis. Nat Cell Biol. 2017;19(5):445–456. doi:10.1038/ncb3517.
- Tsusaka T, Guo T, Yagura T, Inoue T, Yokode M, Inagaki N. Kondoh H Deacetylation of phosphoglycerate mutase in its distinct central region by SIRT2 down-regulates its enzymatic activity. Genes Cells. 2014;19(10):766–777. doi:10.1111/gtc.12176.
- Fan J, Shan C, Kang HB, Elf S, Xie J, Tucker M, Gu TL, Aguiar M, Lonning S, Chen H, et al. Tyr phosphorylation of PDP1 toggles recruitment between ACAT1 and SIRT3 to regulate the pyruvate dehydrogenase complex. Mol Cell. 2014;53(4):534–548. doi:10.1016/j.molcel.2013.12.026.
- Kim I. He Yy 2013; Targeting the AMP-activated protein kinase for cancer prevention and therapy. Front Oncol. 3:175. doi:10.3389/fonc.2013.00175.
- Dugan LL, You YH, Ali SS, Diamond-Stanic M, Miyamoto S, DeCleves AE, Andreyev A, Quach T, Ly S, Shekhtman G, et al. AMPK dysregulation promotes diabetes-related reduction of superoxide and mitochondrial function. J Clin Invest. 2013;123(11):4888–4899. doi:10.1172/JCI66218.
- Imamura K, Ogura T, Kishimoto A, Kaminishi M, Esumi H. Cell cycle regulation via p53 phosphorylation by a 5ʹ-AMP activated protein kinase activator, 5-aminoimidazole- 4-carboxamide-1-beta-D-ribofuranoside, in a human hepatocellular carcinoma cell line. Biochem Biophys Res Commun. 2001;287(2):562–567. doi:10.1006/bbrc.2001.5627.
- Jones RG, Plas DR, Kubek S, Buzzai M, Mu J, Xu Y, Birnbaum MJ, Cb T. AMP-activated protein kinase induces a p53-dependent metabolic checkpoint. Mol Cell. 2005;18(3):283–293. doi:10.1016/j.molcel.2005.03.027.
- Liang J, Shao Sh, Xu Zx, Hennessy B, Ding Z, Larrea M, Kondo S, Dumont Dj, Gutterman Ju, Walker Cl et al. The energy sensing LKB1-AMPK pathway regulates p27(kip1) phosphorylation mediating the decision to enter autophagy or apoptosis. Nat Cell Biol. 2007;9(2):218–224. doi:10.1038/ncb1537.