
ABSTRACT
Recently, some studies have placed additional research focus on microRNAs (miRNAs) in a bid to discover novel therapeutic approaches for cervical cancer (CC), which is one of the most common female reproductive tract malignancies with high rates of morbidity and mortality. Hence, the aim of the present study was to evaluate the ability of miR-129-5p to influence cell angiogenesis, invasion and migration by targeting ZIC2 through the Hedgehog signaling pathway in CC. Both CC and adjacent normal tissues were extracted from 87 eligible participating patients with CC. Measurements of the levels of miR-129-5p, mRNA and protein levels of ZIC2, sonic Hedgehog (Shh), Gli1, and Gli2 and levels of CXCL1, VEGF and Ang2 were determined accordingly. An angiogenesis assay was performed to evaluate cell angiogenesis in vitro, while a scratch test and transwell assay were adopted for cell invasion and migration determination. Lastly, tumor formation within nude mice was performed in order to analyze angiogenesis and tumor growth among the nude mice in vivo. The findings revealed that upregulation of miR-129-5p resulted in the decrease in the mRNA and protein levels of ZIC2, Shh, Gli1, Gli2, as well as reduced levels of CXCL1, VEGF and Ang2. Moreover, up-regulation of miR-129-5p was determined to inhibit CC cell angiogenesis ability in vitro, in addition to the processes of cell migration, and invasion. Finally, up-regulation of miR-129-5p was observed to inhibit the tumor growth and angiogenesis ability of nude mice in vivo. The results of the present study provided evidence suggesting that overexpressed miR-129-5p prevents angiogenesis and inhibits cell migration and invasion by means of negatively targeting ZIC2 through suppression of the Hedgehog signaling pathway in CC. Thus, highlighting the promise of miR-129-5p as a novel target for treating CC is promising.
Introduction
As a female-specific primary malignancy, cervical cancer (CC) that generally arises in the uterine cervix was accompanied by a high rate of morbidity and mortality.Citation1 The incidence of CC is attributed to a wide variety of risk factors including, genetic susceptibility, viral infections and environmental factors, all of which have been correlated with the etiology of CC.Citation2 CC ranks second regarding cancer-related deaths globally, with statistics estimating there to be as many as 474,000 female-deaths due to the disease by the year of 2030.Citation3 Furthermore, a clinical statistics report indicated there to be 61,691 cases of CC in China, with 29,526 confirmed deaths, of which both figures represented 10% of cases globally.Citation4 Current existing treatments are limited to, surgical procedures, radiotherapy, and chemotherapy which are generally applied in clinical settings, with largely poor outcomes due to metastasis.Citation5 However, the situation may be more severe in China due to the size of the population, being so large that distinct variation in regard to wealth and medical resources between different regions.Citation4 Thus, it is of great importance that new potential regimens are developed, in order to improve the outcomes of this deadly disease.
MicroRNAs (miRNAs), are small non-coding RNA molecules about 22 nucleotides in length, have been emphasized on throughout many studies owing to their altered expression in pathological situations, suggesting that may function as tumor suppressors in tumor development through regulating their target genes expressions at a post-transcriptional level.Citation1,Citation6 HPV is a large contributing factor in the occurrence of CC. Previous studies have demonstrated that there to be possible expressions of miR-129 in human papillomavirus (HPV) related cell lines.Citation7,Citation8 Expressions of miR-129-5p, a product by miR-129–1 and miR-129–2, has been detected in various types cancers, including colorectal cancer and breast cancer, whereby an association between down-regulated miR-129-5p and unsatisfactory outcomes have been speculated.Citation9,Citation10 Similarly, a group of Chinese researchers also drew conclusions that overexpressed miR-129-5p contributes to suppressing tumor cell proliferation in ovarian cancer via its targeting gene.Citation11 However, few functional studies have investigated the role of miR-129-5p in CC. Reports have suggested the existence of a relationship between the Hedgehog signaling pathway and activated CC pathways, where mutated genes are associated with developmental anomalies induced by the zinc finger protein of the cerebellum 2 (ZIC2) mutation.Citation8,Citation12 ZIC2, along with the other four transcriptional regulators, represents one of the vertebrate homologs of the Drosophila odd-paired genes.Citation13 Therefore, it is reasonable to boldly assert the hypothesis that ZIC2 may be conducive to CC through the Hedgehog signaling pathway, which may well provide clinicians with a novel therapeutic approach. Hence, the current study aimed to evaluate the ability of miR-129-5p to influence cell angiogenesis, invasion and migration by targeting ZIC2 through the Hedgehog signaling pathway in CC.
Methods and materials
Ethical statements
The study was conducted with the approval of the Institutional Review Board of Henan Provincial People’s Hospital & People’s Hospital of Zhengzhou University. All participated patients signed informed consent documentation prior to enrollment.
Study subjects
Eighty-seven CC tissues and corresponding adjacent normal tissues were obtained from 87 female patients with pathologically confirmed CC who had underwent surgical resection at Henan Provincial People’s Hospital & People’s Hospital of Zhengzhou University between 2012 and 2016. The age of the recruited patients ranged between 27 and 67 years with a mean age of 45.4 years. The clinical stages were as follows: stage IA, n = 5; stage IB, n = 8; stage IIA, n = 18; stage IIB, n = 18; stage III, n = 38. Pathologic types were confirmed according to the following: squamous carcinoma, n = 21; adenocarcinoma, n = 30; adenosquamous carcinoma, n = 36. Pathologic differentiation was shown as below: grade I, n = 19; grade II, n = 28; grade III, n = 40. After 5 ml of blood had been collected from each patient, the serum was isolated and conserved in liquid nitrogen. Patients were enrolled into the study, providing they adhered with the following criteria.Citation14: (1) patients were confirmed to have CC by means of cytological or histological examination; (2) patients were only permitted to undergo surgical resection by clinical evaluation; (3) patients had no history of any other cancer in reproductive system; (4) patients had not received any treatment before the operation, including radiotherapy, chemotherapy and chemoradiotherapy. Patients were excluded in any event they suffered from any severe complications.Citation15
Hematoxylin-eosin (HE) staining
Pathological sectioning was performed on both the CC and adjacent normal tissues, which were then fixed in 4% formaldehyde solution for 24 h, dehydrated and embedded. Paraffin-embedded sections were washed three times with phosphate buffered solution (PBS), fixed with formaldehyde for 20 min and stained using hematoxylin for 10 min. After the sections were washed with running water, hydrochloric ethanol was applied to differentiate sections over a period of 30 min. In the event that the color was observed to have faded to a reddish hue, the sections were then subsequently washed with running water, allowing them to return back to blue. Eosin solution was applied for 10 min of staining, followed by gradient dehydration. An optical microscope was used to observe the pathological changes among the CC and adjacent normal tissues after the sections were mounted with neutral balsam.
Reverse transcription quantitative polymerase chain reaction (RT-qPCR)
Total RNA was extracted from the cryopreserved (−80°C) CC and adjacent normal tissues using miRNeasy Mini Kit (217004, QIAGEN Corp., Duesseldorf, North Rhine-Westphalia, Germany). A260/A230 and A260/A280 ratios were measured on NanoDrop2000 Microvolume Ultraviolet Spectrophotometer (1011U, NanoDrop Technologies, Wilmington, DE, USA) to determine the concentration and purity of the total RNA. The total RNA was then reversely transcribed into cRNA according to the instructions of TaqMan MicroRNA Assays Reverse Transcription Primer (4427975, Applied Biosystems, Foster City, CA, USA). Next, cDNA was diluted to 50 ng/µl with 2 µl added each time. The reaction amplification system was set as 25 μl. Reaction condition of reverse transcription was indicated below: at 37°C for 30 min and at 85°C for 5 s. Primers of miR-129-5p, ZIC2, sonic Hedgehog (Shh), glioma-associated oncogene family zinc finger 1 (Gli1) and Gli2 were designed and then synthesized by TaKaRa Biotechnology Ltd., Dalian, Liaoning, China (). The ABI7500 qPCR instrument (7500, Applied Biosystems, Foster City, CA, USA) was employed for RT-qPCR purposes. The reaction conditions applied are as follows: pre-denaturation for 10 min at 95°C, 40 cycles of denaturation for 10 s at 95°C, annealing for 20 s at 60°C and extension for 34 s at 72°C. RT-qPCR system was set as 20 μl, containing 10 µl of SYBR Premix Ex TaqTM II, 0.8 µl of PCR Forward Primer (10 µM), 0.8 µl of PCR Reverse Primer (10 µM), 0.4 µl of ROX Reference Dye, 2 µl of template cDNA and 6.0 µl of sterile distilled water. U6 gene served as the internal control for miR-129-5p with β-actin as the internal control of ZIC2, Shh, Gli1 and Gli2. The relative expression of the target gene was calculated based on the 2-ΔΔCt method, in which ΔΔCT = ΔCt experiment group –ΔCt control group and ΔCt = Ct target gene –Ct internal control. Ct referred to the number of amplification cycles when real-time fluorescence intensity reached the pre-set threshold value. The experiment was repeated three times.
Table 1. Primer sequences for RT-qPCR.
Western blotting
Protein expression of ZIC2, Shh, Gli1 and Gli2 in CC as well as the adjacent normal tissues post transfection were measured. Total protein was extracted using a protein extraction kit. The concentration of protein was determined using Bicinchoninic acid (BCA) Protein Assay Kit (23225, Pierce Biotechnology, Waltham, Massachusetts, USA) and adjusted with deionized water. Sodium dodecyl sulfate polyacrylamide gel electropheresis (SDS-PAGE, 10%) (P0012A, Shanghai Beyotime Biotechnology Co., Ltd., Shanghai, China) was prepared. Then, 50 μg of protein sample was added into each well. After electrophoresis at 80 V and 120 V for 2 h, protein was transferred to polyvinylidene fluoride (PVDF) membrane (250 mV for 90 min, ISEQ00010, Millipore Corp., Billerica, MA, USA) in wet transfer. PVDF membrane was blocked in Tris-buffered saline with Tween 20 (TBST) comprised of 5% skimmed milk powder for 2 h. After the blocking solution was abandoned, the membrane was washed with TBST and incubated with the following primary antibodies (all purchased from Abcam Inc., Cambridge, MA, USA) at 4°C overnight: rabbit-anti-human ZIC2 (1: 1000, ab150404), Shh (1: 500, ab53281), Gli1 (1: 1000, ab134906), Gli2 (1: 1000, ab167389) and β-actin (1: 500, ab8226). After 3 TBST washes (10 min each time), the membrane was incubated with a secondary antibody, rabbit-anti-goat IgG (1: 2000, ab6721, Abcam Inc., Cambridge, MA, USA) marked by horseradish peroxidase (HRP) at room temperature for 1 h. Next, phosphate buffered saline with Tween-20 (PBST) was used to wash the membrane three times (10 min each time). The membrane was subsequently immersed in electrochemiluminescence (ECL) reaction solution (WBKLS0100, Millipore Corp., Billerica, MA, USA) to develop color. The images were acquired post cassette exposure. β-actin served as the internal control. Relative protein expression = gray value target band/gray value internal control. The aforementioned method was also applicable for the determination of protein expression in the cells.
Dual-luciferase reporter gene assay
The bioinformatics prediction website (microRNA.org) was employed in order to analyze target genes of miR-129-5p. Dual-luciferase reporter gene assay was applied to ascertain as to whether ZIC2 was indeed a direct target of miR-129-5p. Next, miR-129-5p vector plasmid and ZIC2-dual-luciferase reporter gene vector (pmiRRB-ZIC2-3ʹuntranslated region [UTR]) were constructed. Endonuclease sites Spe I and Hind III were introduced to pMIR-reporter. Mutant (MUT) sites on the complementary sequence of the seed sequences were designed on the ZIC2 wild type (WT). The target sequence was inserted in the plasmid of the pMIR-reporter using T4 DNA ligase after they had been cleaved by restriction enzymes. The correctly identified sequence luciferase reporter plasmids WT and MUT were co-transfected with miR-129-5p respectively into cell HEK-293T (CRL-1415, Shanghai Xinyu Biotechnology Co., Ltd., Shanghai, China). After 48 h of transfection, the cells were collected and split, followed by centrifugation for 3–5 min with collection of the supernatant. The relative luciferase activity was examined using the Dual-Luciferase® Reporter Assay System (E1910, Promega Biotech Co., Ltd., Madison, WI, USA). Firefly luciferase activity was detected with 50 μl of firefly luciferase detection reagent, which was added to every 10 μl of cell sample. Renilla luciferase activity was measured with 50 μl of firefly luciferase detection reagent added. The luciferase activity was calculated in connection with the luciferase activity formula = firefly luciferase activity/Renilla luciferase activity. The experiment was repeated three times.
Cell culture, grouping and transfection
C-33A cell line and Hela cell line of human CC were both purchased from Shanghai Tongwei Biological Technology Co., Ltd., (Shanghai, China). After culture in low-glucose Dulbecco’s modified Eagle’s medium (DMEM) containing 20% fetal bovine serum (FBS), the cells were centrifuged at 700 r/min. Next, the precipitate was added with the culture medium in order to create cell suspension. The cell suspension was mixed in an equal manner through blowing and beating and then placed into a disposable culture medium, allowing the precipitate to be uniformly distributed. The cells were then washed with D-Hank’s solution and digested by 0.25% trypsin containing 0.02% ethylene diamine tetraacetic acid (EDTA) in an incubator at 37°C with 5% CO2 for 7–9 min. Fetal bovine serum (FBS, 20%) was utilized to terminate the digestion process. Centrifugation was performed for 5 min at 1200 r/min and the supernatant was subsequently abandoned. The cells were then re-suspended with DMEM containing 20% FBS, inoculated to a new culture dish for incubation at 37°C with 5% CO2. The culture medium was replaced every two to three days.
Cells in the logarithmic growth phase were selected. The collected cell suspension was seed in a 6-well plate with 5 × 10⁴ cells/well. Cells were cultured in a new complete medium that were transfected when cell confluence was almost 50%–80%. Lipofection was conducted according to the instructions of Lipofecta mine 2000 (11668–027, Invitrogen Inc., Carlsbad, CA, USA). Cells were grouped into the following eight groups: the blank (cells transfected without any sequence), negative control (NC) (cells transfected with sequence without any homology sequence of target gene), miR-129-5p mimic (cells transfected with miR-129-5p mimics), miR-129-5p inhibitor (cells transfected with miR-129-5p inhibitors), siRNA-ZIC2 (cells transfected with siRNA-ZIC2), miR-129-5p inhibitor + siRNA-ZIC2s (cells transfected with miR-129-5p inhibitors and siRNA-ZIC2), GATN-61 (cells treated with 20 μmol/L GATN-61 for 24 h), and miR-129-5p inhibitor + GATN-61 (after transfection with miR-129-5p inhibitor, cells treated with 20 μmol/L GATN-61 for 24 h) groups. Cells in the NC, miR-129-5p mimic, miR-129-5p inhibitor, and siRNA-ZIC2 groups were labeled with carboxy fluorescein (FAM). All the aforementioned plasmids marked with green fluorescence protein by FAM were synthesized by Shanghai Sangon Biotech Co., Ltd., (Shanghai, China). GATN-61 was purchased from Santa Cruz Biotechnology, Inc., (Santa Cruz, CA, USA). The transfected cells were starve-treated 24 h prior to any subsequent experiment. The experiment was performed three times. The transfection efficiency in each group was analyzed under a fluorescence microscope.
In vitro angiogenesis assay
Cells in the logarithmic growth phase were seeded into a 60 mm culture dish. After 24 h had elapsed, the culture dish used was discarded and washed twice with PBS, followed by the addition of 1 ml incomplete culture medium. After 24 h had elapsed, the culture supernatant was collected and centrifuged at 4°C (5000 r/min). The supernatant was acquired for further use. Next, 100 μl of Marigel was added to each well of the 48-well plate, which was then placed to stand for 30 min at 37°C. C-33A cell line and Hela cell lines were re-suspended using the previously collected supernatant in each group. The cells were seeded in a 48-well plate (4 × 10⁴ cells/well) coated with Matrigel. Angiogenesis was observed and photographed using an inverted microscope after 4 h.
Enzyme-linked immunosorbent assay (ELISA)
The culture medium used for cell transfection was collected in 5 ml centrifuge tubes. After standing for 2 h, it was centrifuged at 4°C for 15 min (3000 r/min) for cell separation purposes. The separated cells were then placed in a 1.5 ml eppendorf (EP) tubes tagged with a corresponding number and conserved in a refrigerator at a temperature of −20°C. ELISA kit (PH029RAT, Phygene Life Sciences Co., Ltd., Shanghai, China) was introduced to determine the concentrations of the chemokine (C-X-C motif) ligand 1 (CXCL1) and vascular endothelial growth factor (VEGF). The cryopreserved ELISA kit and sample were withdrawn after 20–30 min, prior to the calibrating the temperature to room temperature, followed by gentle shaking. The levels of CXCL1, VEGF and angiogenin2 (Ang2) among the cells were measured in strict accordance with the instructions provided by the kit manufacturer.
Scratch test
A ruler as well as a Marker pen was placed on a clean bench under ultraviolet light for 30 min. Both the C-33A as well as the Hela cell lines were seeded into the plate. In the event that the cells had grown to 90% confluence, a thin wound was created using the tip of a pipette (20 µl). The cells were then washed 3 times with PBS with care, followed by addition of 1% FBS for subsequent culture. Images were acquired at identical positions at multiple time points ranging between 0 h–24 h using an inverted microscope (10 × 10) with the distance between cells on either ends of the scratch considered to be the initial distance at 0 h. The surplus distance after cells had migrated on either ends of the scratch were subsequently recorded. To evaluate migration ability, the relative surplus distance was calculated based on the following formula: relative surplus distance = surplus distance after cells migrated on the sides of scratch/initial distance between cells on the sides of scratch × 100%. The experiment was repeated three times.
Transwell assay
After the serum had been removed, the cells were starved for 12–24 h and washed once or twice with PBS. The cells were then re-suspended in serum-free medium containing 0.2% bovine serum albumin (BSA) until the concentration was 5 × 10⁴ cells/μl. Then, 200 µl of cell suspension was added to the apical chamber and 600 µl of medium supplemented with 10% FBS was added to basolateral chamber, which were both coated with Matrigel and pre-cooled. After 24 h of incubation, the chamber was washed twice with PBS, and soaked in new 10% formaldehyde solution for 20 min to fix the cells, washed with running water and stained with 0.1% crystal violet for 15 min. After washing with running water again, the cells in the Matrigel and apical chamber were wiped in a careful manner, and then observed under the light microscope (× 200). The cells that had been transferred to the basolateral chamber were counted based on the observations of five fields of each membrane. The results were expressed as number of cells.
Tumor formation in nude mice to detect angiogenesis
A total of 48 specific pathogen free (SPF) female BALB/c nude mice (aged 4 weeks old and weighing 14–16 g) were purchased from Shanghai SLAC Laboratory Animal Co., Ltd., (Shanghai, China). The C-33A and Hela cells in the logarithmic growth phase were selected, followed by an adjustment made to the concentration of the cells to 1 × 10⁷ cells/ml. The cell suspension (100 μl) was subcutaneously injected into the lateral middle part of left armpit of nude mice. The nude mice were fed in the SPF environment, while both the growth state of mice and tumor growth were observed accordingly. The diameter of the subcutaneous nodule > 0.5 cm served as standard of tumor formation. The nude mice were classified into the blank (cells transfected without any sequence), negative control (NC) (cells transfected with sequence without any homology sequence of target gene), miR-129-5p mimic (cells transfected with miR-129-5p mimics), miR-129-5p inhibitor (cells transfected with miR-129-5p inhibitors), siRNA-ZIC2 (cells transfected with siRNA-ZIC2), miR-129-5p inhibitor + siRNA-ZIC2s (cells transfected with miR-129-5p inhibitors and siRNA-ZIC2), GATN-61 (cells treated with 20 μmol/L GATN-61 for 24 h), and miR-129-5p inhibitor + GATN-61 (after transfection with miR-129-5p inhibitor, cells treated with 20 μmol/L GATN-61 for 24 h) groups (n = 6). The mice were injected once every three days for a total of 5 five times. After successful xenograft model establishment, the maximum (a) and minimum (b) residual diameters of tumors were measured, and the tumor volume was calculated as the following formula: tumor volume = ab2/2. Fourteen days post establishment, the nude mice were sacrificed by means of neck dislocation. The tumor bodies were collected and weighed. The samples were then embedded with paraffin and sliced into sections. Next, the cells were dewaxed by xylene, dehydrated by gradient alcohol, treated with a block of inactivated endogenous peroxidase, repaired with antigen, and sealed in serum working fluid. The cells were subsequently incubated with CD34 primary antibody (ab81289, 1: 30, Abcam Inc., Cambridge, MA, USA) followed by staining of the corresponding secondary antibody by diaminobenzidine (DAB), counterstained with hematoxylin, conventionally dehydrated, cleared, dried and mounted. The brown vessels were reflective of positive staining. Any brown endothelial cell or cell plexus was considered to be a vessel. Each vessel of 40 μm was recorded as microvascular density (MVD) value.Citation16
Statistical analysis
All experimental data were analyzed using SPSS 19.0 software (IBM Corp. Armonk, NY, USA). Measurement data were expressed as mean ± standard deviation (SD). Comparisons among multiple groups were assessed by one-way analysis of variance (AVONA). Enumeration data were expresses as percentage and analyzed by chi-square test. p < 0.05 was considered to be statistically significant.
Results
Marked inflammatory cell infiltration is observed among CC tissues
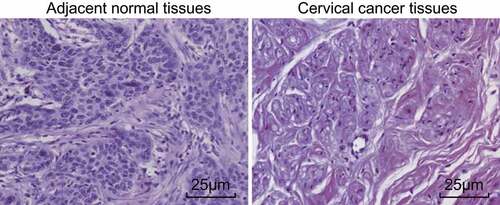
Pathological changes among the CC and adjacent normal tissues were observed by HE staining, the results of which are illustrated in , which revealed that in the CC tissues, cancer cells were inundated by inflammatory cells with obvious infiltration. In the adjacent normal tissues, no marked inflammatory cell infiltration into the cancer cells was observed.
Figure 1. The HE staining reflects obvious inflammatory cell infiltration in CC tissues.
Note: scale bar = 25 μm; CC, cervical cancer; HE, hematoxylin-eosin.
Decreased miR-129-5p, increased ZIC2 and activated Hedgehog signaling pathway are identified in CC tissues
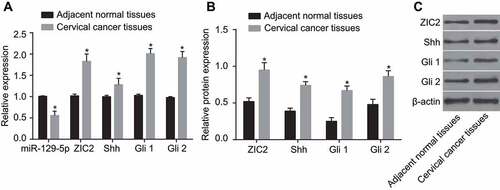
RT-qPCR and western blotting were adopted to measure miR-129-5p level, and mRNA and protein levels of ZIC2, Shh, Gli1, and Gli2 in CC and adjacent normal tissues. RT-qPCR () results demonstrated that the mRNA expression of ZIC2, Shh, Gli1 and Gli2 were highly expressed in the CC tissues, more so than that in the adjacent normal tissues, while low levels of miR-129-5p expressions were observed (all p < 0.05). Western blot results () demonstrated that when compared with the adjacent normal tissues, protein expression of ZIC2, Shh, Gli1 and Gli2 were all significantly elevated among the CC tissues (all p < 0.05). The findings indicated that decreased miR-129-5p, increased ZIC2, and activated Hedgehog signaling pathway in CC tissues.
Figure 2. The RT-qPCR and western blotting show decreased miR-129-5p, increased ZIC2, and activated Hedgehog signaling pathway in CC tissues.
Note: A, expression of miR-129-5p and mRNA expression of Shh, Gli1 and Gli2 using RT-qPCR; B, relative protein expression of ZIC2, Shh, Gli1 and Gli2 using western blotting; (c), protein bands of ZIC2, Shh, Gli1 and Gli2; miR-129-5p, microRNA-129-5p; CC, cervical cancer; ZIC2, zinc finger protein of the cerebellum 2; Shh, sonic Hedgehog; Gli, glioma-associated oncogene family zinc finger; RT-qPCR, reverse transcription-quantitative polymerase chain reaction; *, p < 0.05 compared with the adjacent normal tissues.
ZIC2 is a target gene of miR-129-5p
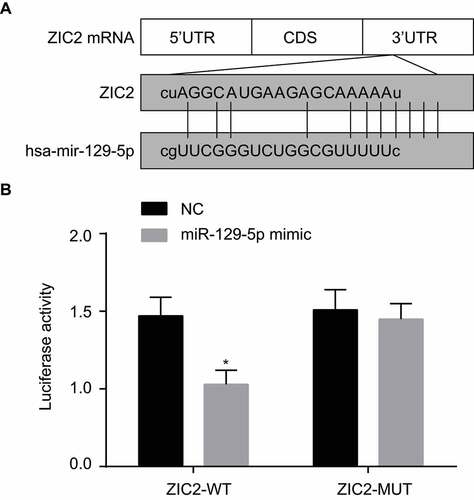
The microRNA.org analysis website provided validation, indicating that ZIC2 was indeed a target gene of miR-129-5p (), which was also further verified by the luciferase report. The specific binding sites were discovered to exist between 3ʹUTR of ZIC2 gene and sequences of miR-129-5p. Results of the dual-luciferase reporter assay () revealed that in comparison to the NC group, luciferase activity of ZIC2 WT 3ʹ-UTR was markedly inhibited by miR-129-5p (p < 0.05) while no significant difference was detected in regard to ZIC2 MUT 3ʹ-UTR (p > 0.05). These results suggested that miR-129-5p specifically binds ZIC2-3ʹ-UTR and reduces the expression of ZIC2 after transcription.
Figure 3. The dual-luciferase reporter gene assay shows that miR-129-5p targets ZIC2.
Note: A, predicted binding sites of miR-129-5p to the ZIC2-3ʹUTR; B, luciferase activity determined by luciferase reporter gene assay; NC, negative control; miR-129-5p, microRNA-129-5p; ZIC2, zinc finger protein of the cerebellum 2; UTR, untranslated region; *, p < 0.05 compared with the NC group.
CC cells in each group were successfully transfected
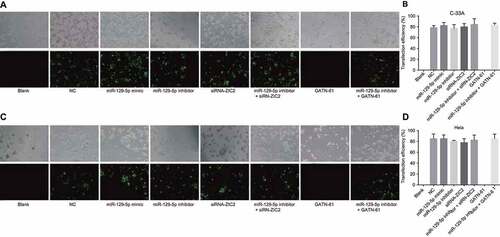
Following the transfection of the CC cells, the transfection efficiency was subsequently determined. After 48 h of transfection, the variation tendency of the expressions of the C-33A cell line was almost identical to that of the Hela cell line. Expression of green fluorescent protein detected by fluorescence microscope is illustrated in . Due to the fact that the cells emitted green fluorescence after FAM activation, the transfection efficiency was judged based on the number of cells that emitted green fluorescence. No significant difference in terms of green fluorescence intensity difference was observed among the eight groups. No green fluorescence was observed in the blank and GATN-61 groups while the transfection efficiency in the NC, miR-129-5p mimic, miR-129-5p inhibitor, siRNA-ZIC2, miR-129-5p inhibitor + siRNA-ZIC2, and miR-129-5p inhibitor + GATN-61 groups ranged between 72% and 88%, suggesting that the CC cells had been successfully transfected.
Figure 4. CC cells after 48-h transfection observed under a fluorescence inverted microscope (× 100).
Note: A and B, fluorescence images and transfection efficiency of C-33A cell line labeled with FAM; C and D, fluorescence images and transfection efficiency of Hela cell line labeled with FAM; CC, cervical cancer; FAM, carboxy fluorescein.
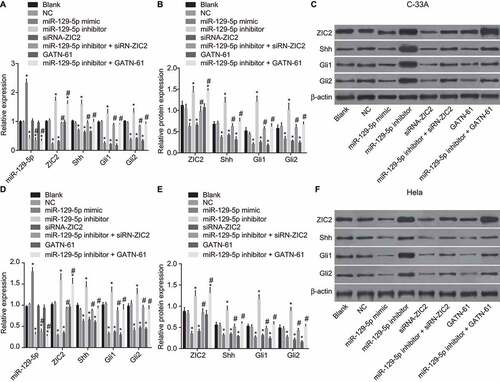
mir-129-5p inhibits the mRNA and protein levels of ZIC2, Shh, Gli1, and Gli2
RT-qPCR and western blotting methods were adopted to detect mRNA and protein levels of ZIC2, Shh, Gli1, and Gli2 after cell transfection. As depicted in , the expression levels of miR-129-5p, ZIC2, Shh, Gli1 and Gli2 in C-33A cell line and Hela cell line displayed uniform consistency in regard to changing trends. Compared with the blank and NC groups, miR-129-5p was up-regulated in the miR-129-5p mimic group, while down-regulated in the miR-129-5p inhibitor, miR-129-5p inhibitor + siRNA-ZIC2, and miR-129-5p inhibitor + GATN-61 groups (all p < 0.05). No significant difference was observed in the siRNA-ZIC2 and GATN-61 groups (both p > 0.05). Compared with the blank and NC groups, ZIC2 mRNA and protein level decreased in the miR-129-5p mimic and siRNA-ZIC2 groups, while it elevated in the miR-129-5p inhibitor and miR-129-5p inhibitor + GATN-61 groups (all p < 0.05), and no significant difference was found in the miR-129-5p inhibitor + siRNA-ZIC2 and GATN-61 groups (both p > 0.05). In comparison to the blank and NC groups, lower expressions of ZIC2, Shh, Gli1 and Gli2 were detected in the miR-129-5p mimic, siRNA-ZIC2, and GATN-61 groups (all p < 0.05) while higher expressions of ZIC2, Shh, Gli1 and Gli2 were found in the miR-129-5p inhibitor group (all p < 0.05). There was no obvious change detected in the miR-129-5p inhibitor + siRNA-ZIC2 and miR-129-5p inhibitor + GATN-61 groups (both p > 0.05). Compared with the miR-129-5p inhibitor group, expression of miR-129-5p, ZIC2, Shh, Gli1 and Gli2 in the miR-129-5p inhibitor + siRNA-ZIC2 and miR-129-5p inhibitor + GATN-61 groups were reduced (all p < 0.05). These findings suggest that miR-129-5p could negatively regulate ZIC2, resulting in the inactivation of the Hedgehog signaling pathway.
Figure 5. RT-qPCR and western blotting illustrate the inhibition of the mRNA and protein levels of ZIC2, Shh, Gli1, and Gli2 by miR-129-5p.
Note: A, miR-129-5p level and mRNA levels of Shh, Gli1 and Gli2 in C-33A cell line; B, protein levels of ZIC2, Shh, Gli1 and Gli2 in C-33A cell line; C, protein bands of ZIC2, Shh, Gli1 and Gli2 in C-33A cell line; D, miR-129-5p level and mRNA levels of Shh, Gli1 and Gli2 in Hela cell line; E, protein levels of ZIC2, Shh, Gli1 and Gli2 in Hela cell line; E, protein bands of ZIC2, Shh, Gli1 and Gli2 in Hela cell line; NC, negative control; miR-129-5p, microRNA-129-5p; ZIC2, zinc finger protein of the cerebellum 2; Shh, sonic Hedgehog; Gli, glioma-associated oncogene family zinc finger; RT-qPCR, reverse transcription-quantitative polymerase chain reaction; *, p < 0.05 compared with the blank and NC groups; #, p < 0.05 compared with the miR-129-5p inhibitor group.
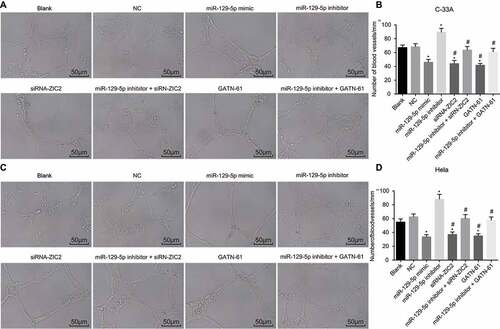
Upregulation of mir-129-5p inhibits CC cell angiogenesis ability in vitro
Detection of the CC cell angiogenesis ability in vitro was conducted, with results of which () demonstrated a variation tendency in regard to nearly identical expressions in the C-33A cell line and Hela cell line observed. The number of blood vessels was found to be much smaller in miR-129-5p mimic, siRNA-ZIC2, and GATN-61 groups but larger in the miR-129-5p inhibitor group than that in the blank and NC groups (all p < 0.05). No obvious changes were observed in the miR-129-5p inhibitor + siRNA-ZIC2 and miR-129-5p inhibitor + GATN-61 groups (p > 0.05). The obtained results suggest that upregulated miR-129-5p could suppress angiogenesis ability in CC cells.
Figure 6. Angiogenesis evaluation depicts the upregulation of miR-129-5p resulting in the inhibition of CC cell angiogenesis ability in vitro.
Note: A, angiogenesis images of C-33A cell line in the eight groups (scale bar = 50 μm); B, the number of blood vessels in C-33A cell line; C, angiogenesis images of Hela cell line in the six groups (scale bar = 50 μm); B, the number of blood vessels in Hela cell line; NC, negative control; miR-129-5p, microRNA-129-5p; ZIC2, zinc finger protein of the cerebellum 2; *, p < 0.05 compared with the blank and NC groups; #, p < 0.05 compared with the miR-129-5p inhibitor group.
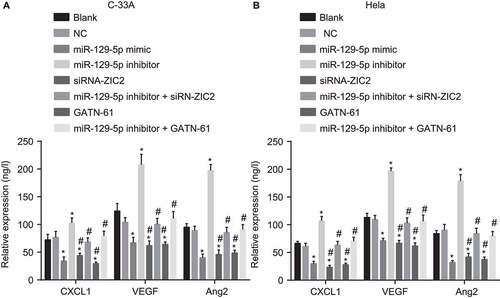
Upregulation of mir-129-5p decreases the levels of CXCL1, VEGF and Ang2
ELISA was performed to determine the levels of CXCL1, VEGF, and Ang2 among the CC cells. The ELISA results (), illustrated the variation of levels of CXCL1, VEGF and Ang2 in C-33A cell line and Hela cell line, suggesting there to be almost identical patterns. In comparison to the blank and NC groups, the levels of CXCL1, VEGF and Ang2 were notably decreased in the miR-129-5p mimic, siRNA-ZIC2, and groups (all P < 0.05), which was found to have increased in the miR-129-5p inhibitor group (all p < 0.05). Nevertheless, no significant difference regarding the levels of CXCL1, VEGF and Ang2 were detected in the miR-129-5p inhibitor + siRNA-ZIC2 and miR-129-5p inhibitor + GATN-61 groups (both p > 0.05). These findings provided evidence indicating that upregulated miR-129-5p could inhibit angiogenesis in CC cells.
Figure 7. The ELISA detection demonstrates miR-129-5p decreases the levels of CXCL1, VEGF and Ang2 in CC cells.
Note: A, levels of CXCL1, VEGF and Ang2 in C-33A cell line; B, relative expressions of CXCL1, VEGF and Ang2 in Hela cell line; CXCL1, chemokine (C-X-C motif) ligand 1; VEGF, vascular endothelial growth factor; Ang2, angiogenin-2; ELISA, Enzyme-linked immunosorbent assay; CC, cervical cancer; NC, negative control; miR-129-5p, microRNA-129-5p; ZIC2, zinc finger protein of the cerebellum 2; *, p < 0.05 compared with the blank and NC groups; #, p < 0.05 compared with the miR-129-5p inhibitor group.
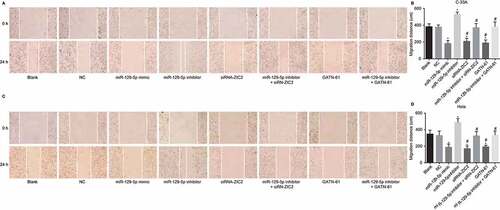
Upregulation of mir-129-5p suppresses CC cell migration
Scratch test was adopted to detect CC cell migration. As shown in , similar alterations of expression tendencies in the C-33A cell line and Hela cell line were observed. In comparison to the blank and NC groups, the migration distance was much shorter in the miR-129-5p mimic, siRNA-ZIC2, and GATN-61 groups (all p < 0.05) but longer in the miR-129-5p inhibitor group (p < 0.05). However, cell migration distance exhibited no obvious changes in the miR-129-5p inhibitor + siRNA-ZIC2 and miR-129-5p inhibitor + GATN-61 groups (both p > 0.05). The above results indicated that upregulated miR-129-5p suppresses CC cell migration.
Figure 8. Scratch test shows that upregulation of miR-129-5p suppresses CC cell migration (× 100).
Note: A, cell migration images of C-33A cell line after transfection; B, the histogram comparing migration distance in C-33A cell line after transfection; C. cell migration images of Hela cell line after transfection; D, the histogram comparing migration distance in Hela cell line after transfection; NC, negative control; miR-129-5p, microRNA-129-5p; ZIC2, zinc finger protein of the cerebellum 2; *, p < 0.05 compared with the blank and NC groups; #, p < 0.05 compared with the miR-129-5p inhibitor group.
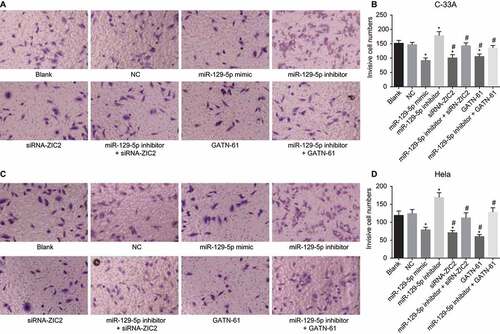
Upregulation of mir-129-5p restrains CC cell invasion
Transwell assay was performed to detect CC cell invasion. As shown in , the expression in C-33A cell line and Hela cell line exhibited similar tendencies. Compared with the blank and NC groups, the number of invasive cells was markedly decreased in the miR-129-5p mimic, siRNA-ZIC2, and GATN-61 groups (all p < 0.05), of which exhibited elevated levels in the miR-129-5p inhibitor group (all p < 0.05). However, no significant difference was found between the blank and NC groups and the miR-129-5p inhibitor + siRNA-ZIC2 and miR-129-5p inhibitor + GATN-61 groups (both p > 0.05). Taken together, these obtained results indicated that overexpressed miR-129-5p inhibits CC cell invasion.
Figure 9. Transwell assay reveals the upregulation of miR-129-5p restrains CC cell invasion (× 100).
Note: A, cell invasion images of C-33A cell line after transfection; B, the histogram comparing the number of invasive cells in C-33A cell line after transfection; C. cell invasion images of Hela cell line after transfection; D, the histogram comparing the number of invasive cells in Hela cell line after transfection; NC, negative control; miR-129-5p, microRNA-129-5p; ZIC2, zinc finger protein of the cerebellum 2; *, p < 0.05 compared with the blank and NC groups; #, p < 0.05 compared with the miR-129-5p inhibitor group.
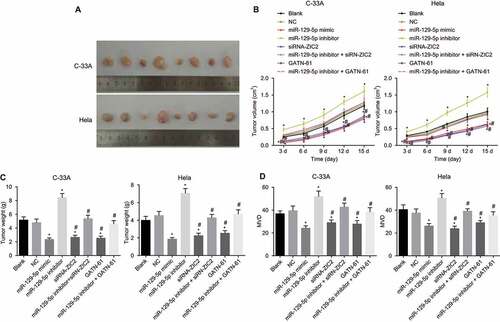
Upregulation of mir-129-5p inhibits tumor growth and angiogenesis ability of nude mice in vivo
Tumor formation in nude mice was performed in order to detect the angiogenesis ability of the nude mice in vivo. As illustrated in , angiogenesis ability trend after tumor formation of the nude mice in C-33A and Hela cells were the same. Compared with the blank and NC groups, between the 4th and 14th days after tumor formation, the miR-129-5p mimic, siRN-ZIC2, and GATN-61 groups exhibited markedly decreased tumor volumes, while the miR-129-5p inhibitor group displayed elevated tumor volume (all p < 0.05), while the miR-129-5p inhibitor + siRN-ZIC2 and miR-129-5p inhibitor + GATN-61 groups displayed no obvious difference (both p > 0.05). In comparison to the blank and NC groups, at the 14th day post execution, the tumor volume was markedly reduced in the miR-129-5p mimic, siRN-ZIC2, and GATN-61 groups, while significant increases in the miR-129-5p inhibitor group were detected (all P < 0.05), and it showed no significant difference in the miR-129-5p inhibitor + siRN-ZIC2 and miR-129-5p inhibitor + GATN-61 groups (both p > 0.05). Compared with blank and NC groups, at the 14th day after nude mice execution, the MVD markedly reduced in the miR-129-5p mimic, siRN-ZIC2, and GATN-61 groups, while it evident increases in the miR-129-5p inhibitor group were found (all P < 0.05). No significant difference was detected in the miR-129-5p inhibitor + siRN-ZIC2 and miR-129-5p inhibitor + GATN-61 groups (both p > 0.05). These findings demonstrated that upregulation of miR-129-5p inhibits tumor growth and angiogenesis ability of nude mice in vivo.
Figure 10. Tumor formation in nude mice illustrates that upregulation of miR-129-5p inhibits tumor growth and angiogenesis ability of nude mice in vivo.
Note: A, the images of xenograft tumors of C-33A cells and Hela cells in nude mice for 14 d; B, the curve of tumor volume changes in nude mice transplanted with C-33A cells and Hela cells at different times; C, changes of tumor weight after transplanted with C-33A cells and Hela cells for 14 d; D, changes of MVD after transplanted with C-33A cells and Hela cells for 14 d; F, changes of MVD after transplanted with Hela cells for 14 d; NC, negative control; miR-129-5p, microRNA-129-5p; MVD, microvascular density; *, p < 0.05 compared with the blank and NC groups; #, p < 0.05 compared with the miR-129-5p inhibitor group.
Discussion
CC ranks in the top 10 most deadly tumors affecting the Chinese population, with a large percentage of disease incidence attributed to HPV, unhealthy diet habits, genetic predisposition and inappropriate sexual behaviors. Health Statistics have indicated he CC mortality rate of women aged 25–40 years to be on the rise, particularly in urban areas.Citation17 Fortunately, besides, the role of some miRNAs playing in CC has come under observation, providing a different perspective from the more conventional current therapies, as novel candidates with clinical practice potential. Liu et al. asserted that miR-196a could serve as a biomarker in the diagnosis and prognosis of CC.Citation6 The present study was designed to uncover the effects of miR-129-5p and its target gene ZIC2 on the biological processes of cell angiogenesis, migration and invasion in CC. Our key findings revealed that over-expressed miR-129-5p may inhibit cell angiogenesis, migration and invasion in CC by negatively regulating ZIC2 through the Hedgehog signaling pathway. MiR-129-5p targeted-inhibition ZIC2 may be a further promising strategy for the treatment of CC.
A significant finding of the current study was in the form of the observation that miR-129-5p was downregulated when ZIC2 was up-regulated in CC tissue, with the mRNA and protein of Shh, Gli1 and Gli2 exhibiting increased levels. Since the overexpression of Gli1 and Gli2 implicated in the activation of the Hedgehog signaling pathway, we subsequently deduced that the Hedgehog signaling pathway was activated in CC.Citation18 The results of our study were in line with observations by Zhang et al. in that miR-129-5p was depleted as CC develops. Likewise, consistent findings of the present study and evidence reported by Chan et al. in that ZIC2 and Gli1 are overexpressed in CC cell lines including Hela and C-33A.Citation8,Citation19 The correlation between ZIC2 and the Hedgehog signaling pathway has yet to be elucidated in terms of identification of the associated mechanism by which up-regulated ZIC2 and its positive association with Hedgehog signaling activity, whereby Gli1 works as an oncogene, with overexpression of ZIC2 promoting the tumourigenicity of CC.Citation8 Furthermore, microRNA.org, a biology prediction site revealed that the mRNA of miR-129-5p has the binding site of ZIC2 in its 3ʹUTR. Xue et al. explored the mechanism by which miRs establish their target relationship with specific genes via the binding site in 3ʹUTR after transcription.Citation20 ZIC2 was confirmed to be a target gene of miR-129-5p. A negative target relationship was further demonstrated after transfection, characterized by declined mRNA and protein expressions of ZIC2 in the cells treated with miR-129-5p mimics. We subsequently deduced based on this evidence, that miR-129-5p functions as a negative regulator of ZIC2.
The present study highlighted the angiogenesis ability trend, which was repressed when miR-129-5p was overexpressed by negatively mediating ZIC2 through suppression of the Hedgehog signaling pathway, which was signified by enhanced levels detected in the miR-129-5p inhibitor group but undermined in the miR-129-5p mimic group with reduced expressions of ZIC2, Shh, Gli1, Gli2, CXCL1, VEGF and Ang2, as well as decreased tumor volume and MVD. Furthermore, upregulation of miR-129-5p was found to inhibit tumor growth and angiogenesis ability of nude mice in vivo. Thereinto, VEGF is a vital regulator of CC angiogenesis in a positive manner, with reports indicating that down-regulated VEGF gives rise to tumor cell apoptosis, and applying restraints to tumor angiogenesis and growth.Citation21 In addition, over-expression of Shh, Gli1 and Gli2 may induce augmented angiogenesis-related VEGF and Ang.Citation22 During the current study, higher levels of Shh, Gli1 and Gli2 were observed in the cells treated with miR-129-5p inhibitors. The pro-angiogenesis function of up-regulated Shh has been reported in post-myocardial ischemic-reperfusion injury by increasing VEGF and Ang.Citation22 Similarly, miR-129-5p has been highlighted due to its anti-proliferative effects in Hela cell line,Citation19 while MVD, a property essential for tumor growth and metastasis, has been found to share a positive correlation with angiogenesis.Citation23 Taken together, it can be deduced based on existing literature, as well as results from the current study, that miR-129-5p overexpression depresses angiogenic capabilities in CC.
Moreover, up-regulated miR-129-5p was observed to inhibit CC cell migration and invasion by negatively targeting ZIC2 through the inhibition of the Hedgehog signaling pathway, with previous studies suggesting that over-expressed miR-129-5p in cases of hepatocellular carcinoma inhibit tumor cell migration.Citation24 Based on the experimental data of Chen et al., the Hedgehog signaling pathway plays a part in tumor invasive extent of CC, especially Gli1.Citation25 The likely function of Gli1 has been previously discussed, suggesting it to be a positive regulator of cell migration and invasion in pancreatic ductal adenocarcinoma.Citation26 A study investigating nasopharyngeal carcinoma, concluded that ZIC2 down-regulation could weaken cell invasion potential.Citation27 Hence, based on our results and the aforementioned finding, we concluded that miR-129-5p exerts inhibitory effects on CC cell migration and invasion.
Taken together, the present study provided evidence indicating that up-regulation of miR-129-5p may suppress CC cell angiogenesis, migration and invasion by targeting ZIC2 through the Hedgehog signaling pathway. These findings may provide a base for which future therapies could be built upon. Nevertheless, certain limitations were faced during the study in the form of a limited sample size, with only 87 samples evaluated; therefore, a larger sample size is required for future study.
Competing interests
The authors have declared that no competing interests exist.
Acknowledgments
We would like to give our sincere appreciation to the reviewers for their helpful comments on this article.
Additional information
Funding
Notes on contributors
Ying-Fang Wang
Ying-Fang Wang wrote the main manuscript text and HYY prepared figures. XQS designed the study. YFW collated the data, designed and developed the database. YW carried out data analyses and produced the initial draft of the manuscript. All authors have read and approved the final submitted manuscript.
References
- Banno K, Iida M, Yanokura M, Kisu I, Iwata T, Tominaga E, Tanaka K, Aoki D. MicroRNA in cervical cancer: oncomiRs and tumor suppressor miRs in diagnosis and treatment. Sci World J. 2014;2014:.1–8. doi:10.1155/2014/178075.
- Zhang W, Ou J, Lei F, Hou T, Wu S, Niu C, Xu L, Zhang Y. C14ORF166 overexpression is associated with pelvic lymph node metastasis and poor prognosis in uterine cervical cancer. Tumour Biol. 2016;37(1):369–379. doi:10.1007/s13277-015-3806-3.
- Parkhurst JO, Vulimiri M. Cervical cancer and the global health agenda: insights from multiple policy-analysis frameworks. Glob Public Health. 2013;8(10):1093–1108. doi:10.1080/17441692.2013.850524.
- Di J, Rutherford S, Chu C. Review of the Cervical Cancer Burden and Population-Based Cervical Cancer Screening in China. Asian Pac J Cancer Prev. 2015;16(17):7401–7407.
- Fan Z, Cui H, Xu X, Lin Z, Zhang X, Kang L, Han B, Meng J, Yan Z, Yan X, et al. MiR-125a suppresses tumor growth, invasion and metastasis in cervical cancer by targeting STAT3. Oncotarget. 2015; 6(28): 25266–25280. doi:10.18632/oncotarget.4457.
- Liu P, Xin F, Ma CF. Clinical significance of serum miR-196a in cervical intraepithelial neoplasia and cervical cancer. Genet Mol Res. 2015;14(4):17995–18002. doi:10.4238/2015.December.22.25.
- Li M, Tian L, Wang L, Yao H, Zhang J, Lu J, Sun Y, Gao X, Xiao H, Liu M. Down-regulation of miR-129-5p inhibits growth and induces apoptosis in laryngeal squamous cell carcinoma by targeting APC. PLoS One. 2013;8(10):e77829. doi:10.1371/journal.pone.0077829.
- Chan DW, Liu VW, Leung LY, Yao KM, Chan KK, Cheung AN, Ngan HY. Zic2 synergistically enhances Hedgehog signalling through nuclear retention of Gli1 in cervical cancer cells. J Pathol. 2011;225(4):525–534. doi:10.1002/path.2901.
- Karaayvaz M, Zhai H, Ju J. miR-129 promotes apoptosis and enhances chemosensitivity to 5-fluorouracil in colorectal cancer. Cell Death Dis. 2013;4:.e659–e659. doi:10.1038/cddis.2013.193.
- Yu Y, Zhao Y, Sun XH, Ge J, Zhang B, Wang X, Cao XC. Down-regulation of miR-129-5p via the Twist1-Snail feedback loop stimulates the epithelial-mesenchymal transition and is associated with poor prognosis in breast cancer. Oncotarget. 2015;6(33):34423–34436. doi:10.18632/oncotarget.5406.
- Tan G, Cao X, Dai Q, Zhang B, Huang J, Xiong S, Zhang Y, Chen W, Yang J, Li H. A novel role for microRNA-129-5p in inhibiting ovarian cancer cell proliferation and survival via direct suppression of transcriptional co-activators YAP and TAZ. Oncotarget. 2015;6(11):8676–8686. doi:10.18632/oncotarget.3254.
- Inaguma S, Ito H, Riku M, Ikeda H, Kasai K. Addiction of pancreatic cancer cells to zinc-finger transcription factor ZIC2. Oncotarget. 2015;6(29):28257–28268. doi:10.18632/oncotarget.4960.
- Marchini S, Poynor E, Barakat RR, Clivio L, Cinquini M, Fruscio R, Porcu L, Bussani C, D’Incalci M, Erba E, et al. The zinc finger gene ZIC2 has features of an oncogene and its overexpression correlates strongly with the clinical course of epithelial ovarian cancer. Clin Cancer Res. 2012; 18(16): 4313–4324. doi:10.1158/1078-0432.CCR-12-0037.
- Tewari KS, Sill MW, Penson RT, Huang H, Ramondetta LM, Landrum LM, Oaknin A, Reid TJ, Leitao MM, Michael HE, et al. Bevacizumab for advanced cervical cancer: final overall survival and adverse event analysis of a randomised, controlled, open-label, phase 3 trial (Gynecologic Oncology Group 240). Lancet. 2017; doi:10.1016/S0140-6736(17)31607-0.
- Ciavattini A, Sopracordevole F, Di Giuseppe J, Moriconi L, Lucarini G, Mancioli F, Zizzi A, Goteri G. Cervical intraepithelial neoplasia in pregnancy: interference of pregnancy status with p16 and Ki-67 protein expression. Oncol Lett. 2017;13(1):301–306. doi:10.3892/ol.2016.5441.
- Weidner N, Semple JP, Welch WR, Folkman J. Tumor angiogenesis and metastasis–correlation in invasive breast carcinoma. N Engl J Med. 1991;324(1):1–8. doi:10.1056/NEJM199101033240101.
- Du PL, Wu KS, Fang JY, Zeng Y, Xu ZX, Tang WR, Xu XL, Lin K. Cervical Cancer Mortality Trends in China, 1991-2013, and Predictions for the Future. Asian Pac J Cancer Prev. 2015;16(15):6391–6396.
- Chandra V, Das T, Gulati P, Biswas NK, Rote S, Chatterjee U, Ghosh SN, Deb S, Saha SK, Chowdhury AK, et al. Hedgehog signaling pathway is active in GBM with GLI1 mRNA expression showing a single continuous distribution rather than discrete high/low clusters. PLoS One. 2015; 10(3): e0116390. doi:10.1371/journal.pone.0116390.
- Zhang J, Li S, Yan Q, Chen X, Yang Y, Liu X, Wan X. Interferon-beta induced microRNA-129-5p down-regulates HPV-18 E6 and E7 viral gene expression by targeting SP1 in cervical cancer cells. PLoS One. 2013;8(12):e81366. doi:10.1371/journal.pone.0081366.
- Xue J, Niu J, Wu J, Wu ZH. MicroRNAs in cancer therapeutic response: friend and foe. World J Clin Oncol. 2014;5(4):730–743. doi:10.5306/wjco.v5.i4.730.
- Qi L, Xing LN, Wei X, Song SG. Effects of VEGF suppression by small hairpin RNA interference combined with radiotherapy on the growth of cervical cancer. Genet Mol Res. 2014;13(3):5094,5106. doi:10.4238/2014.July.7.2.
- Guo W, Yi X, Ren F, Liu L, Wu S, Yang J. Activation of SHH signaling pathway promotes vasculogenesis in post-myocardial ischemic-reperfusion injury. Int J Clin Exp Pathol. 2015;8(10):12464–12472.
- Lee JS, Park YS, Kwon JT, Nam TK, Lee TJ, Kim JK. Radiological apoplexy and its correlation with acute clinical presentation, angiogenesis and tumor microvascular density in pituitary adenomas. J Korean Neurosurg Soc. 2011;50(4):281–287. doi:10.3340/jkns.2011.50.4.281.
- Liu Y, Hei Y, Shu Q, Dong J, Gao Y, Fu H, Zheng X, Yang G. VCP/p97, down-regulated by microRNA-129-5p, could regulate the progression of hepatocellular carcinoma. PLoS One. 2012;7(4):e35800. doi:10.1371/journal.pone.0035800.
- Chen H, Wang J, Yang H, Chen D, Li P. Association between FOXM1 and hedgehog signaling pathway in human cervical carcinoma by tissue microarray analysis. Oncol Lett. 2016;12(4):2664–2673. doi:10.3892/ol.2016.4932.
- Marechal R, Bachet JB, Calomme A, Demetter P, Delpero JR, Svrcek M, Cros J, Bardier-Dupas A, Puleo F, Monges G, et al. Sonic hedgehog and Gli1 expression predict outcome in resected pancreatic adenocarcinoma. Clin Cancer Res. 2015; 21(5): 1215–1224. doi:10.1158/1078-0432.CCR-14-0667.
- Shen ZH, Zhao KM, Du T. HOXA10 promotes nasopharyngeal carcinoma cell proliferation and invasion via inducing the expression of ZIC2. Eur Rev Med Pharmacol Sci. 2017;21(5):945–952.