
ABSTRACT
Pediatric high grade gliomas (HGG) are primary brain malignancies that result in significant morbidity and mortality. One of the challenges in their treatment is inter- and intra-tumoral heterogeneity. Precision medicine approaches have the potential to enhance diagnostic, prognostic and/or therapeutic information. In this case study we describe the molecular characterization of a pediatric HGG and the use of an integrated approach based on genomic, in vitro and in vivo testing to identify actionable targets and treatment options. Molecular analysis based on WGS performed on initial and recurrent tumor biopsies revealed mutations in TP53, TSC1 and CIC genes, focal amplification of MYCN, and copy number gains in SMO and c-MET. Transcriptomic analysis identified increased expression of MYCN, and genes involved in sonic hedgehog signaling proteins (SHH, SMO, GLI1, GLI2) and receptor tyrosine kinase pathways (PLK, AURKA, c-MET). HTS revealed no cytotoxic efficacy of SHH pathway inhibitors while sensitivity was observed to the mTOR inhibitor temsirolimus, the ALK inhibitor ceritinib, and the PLK1 inhibitor BI2536. Based on the integrated approach, temsirolimus, ceritinib, BI2536 and standard therapy temozolomide were selected for further in vivo evaluation. Using the PDX animal model (median survival 28 days) we showed significant in vivo activity for mTOR inhibition by temsirolimus and BI2536 (median survival 109 and 115.5 days respectively) while ceritinib and temozolomide had only a moderate effect (43 and 75.5 days median survival respectively). This case study demonstrates that an integrated approach based on genomic, in vitro and in vivo drug efficacy testing in a PDX model may be useful to guide the management of high risk pediatric brain tumor in a clinically meaningful timeframe.
Background
Improvements in outcomes for childhood cancer mean that the majority of children with cancer are now cured with standard cytotoxic therapies alone. However there are specific tumor types that still portend dismal prognoses and most children with relapsed disease have poor outcomes. Brain tumors in children now account for the single disease entity responsible for the most deaths in childhood. To improve outcomes for these children, many groups are focusing on the development of personalized medicine platforms that seek to integrate genomic testing into decision making practices in order to identify novel, individualized, and effective targeted therapies for each child.Citation1,Citation2 This strategy has, thus far, had limited success in many adult cancers, and significant challenges remain in pediatric cancer.Citation3,Citation4 A particularly concern is the lower mutational burden of childhood cancers, thus increasing the difficulty in finding effective drug targets.Citation5 Moreover, the discovery of a targetable mutation does not always equate to drug response. This is especially true for central nervous system (CNS) tumors, where penetration of the blood brain barrier (BBB) is an added impediment to treatment efficacy.Citation6,Citation7
Gliomas are primary brain malignancies which account for the majority of pediatric tumors involving the CNS.Citation8 While in children most are low grade, high grade tumors, including glioblastoma (GBM), remain a formidable challenge. The current standard management is maximal surgical resection followed by irradiation. Temozolomide is often used as an adjuvant chemotherapeutic treatment, although its efficacy in the pediatric population has not clearly been established.Citation9
Recent advances in genomic analysis have identified 6 distinct molecular subgroups of GBM, and mutually exclusive patterns of mutations in the p53, Rb and PI3K pathways.Citation10 This emphasizes the molecular heterogeneity of GBM, and highlights the potential to identify targetable genetic alterations that may lead to a more directed therapy in pediatric patients. Patients with high-grade gliomas with activating BRAF mutations, for example, have been shown to have profound responses to BRAF inhibitors.Citation11,Citation12 While these tumors make up a very small subgroup of patients, they highlight the potential utility of more extensive tumor profiling, including genomic and drug response assays. We hypothesized that a comprehensive precision medicine approach including molecular, in vitro and in vivo tumor profiling platform would highlight additional therapeutic options. Here we present a pediatric case of a high grade malignant brain tumor, that most closely resembled a GBM, and highlight the utility of combining molecular profiling, high throughput drug screening and in vivo drug efficacy testing to identify potential personalized therapies for high grade glioma (HGG) and potentially other aggressive childhood cancers in a clinically meaningful timeframe.
Case report
We report a 10-year-old boy with a multiple recurrent GBM who presented initially with a 2-week history of headaches and was found to have a mixed solid/cystic lesion in the right temporal lobe. He underwent gross total resection and histopathological examination showed a high grade malignant tumor, with some cells showing rhabdoid features, but retained INI-1 nuclear staining. DNA methylation profiling was performed on the primary tumor sample (FFPE) using Illumina Human Methylation 450 (450k) array, and used to classify the cancer type. The results showed a unique molecular profile, which has not been previously described. It was unable to be segregated into current subgroups, although it showed some resemblance to both atypical teratoid rhabdoid tumorCitation13 (AT/RT) and glioblastoma receptor tyrosine kinase I (RTK-I) subgroups,Citation10 (, The MGMT promoter was unmethylated and there was focal copy number amplification of MYCN ().
Figure 1. DNA methylation array analysis of initial biopsy. (A) Classification of this tumor by methylation analysis indicated some resemblance to atypical teratoid/rhabdoid tumor (AT/RT) and Glioblastoma RTK1 subgroup; (B) Copy-number plot of HGG showing amplification of MYCN and unmethylated status of MGMT.
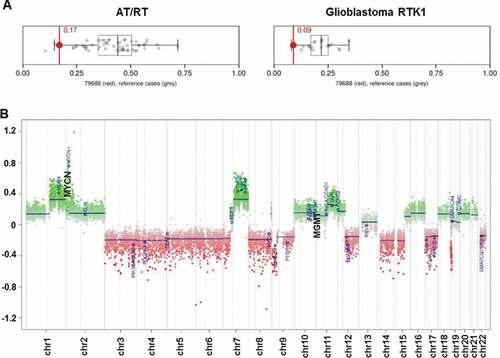
We next performed Whole Genome Sequencing (WGS) on the diagnostic tumor FFPE specimen to an average depth of 65X, and compared to matched germline at 39X. WGS indicated a hypodiploid tumor (ploidy 1.6) with a purity of 84%, consistent with conventional karyotypic findings. Extensive whole and segmental chromosome loss of heterozygosity/deletion was observed across multiple regions (3, 4, 5, 6, 7p, 8, 9, 12q, 14, 15, 17, 22q), with copy number gain in 1q and 7q (, Supplementary Table 1). Focal amplification of chromosome 2p was observed at four discrete sites, including MYCN and DNMT3A, although the DNMT3A amplification was predicted to disrupt the gene ().
Figure 2. Whole genome sequencing of primary, and recurrent tumors. Circos plots summarizing somatic genomic variants in the primary tumor (A) and recurrent tumor (B). Each track, from the outside in represent: the VAF of each somatic SNV and indel (green VAF < 0.5, black VAF> 0.5; range 0.0 – 1.0); somatic log2 copy number (green gains, red losses; range −1.0 – 2.0); somatic BAF as blue lines (range 0.0 – 0.5); regions of LOH (blue blocks); and structural variations including translocations (red) and inversions (blue). SNV: single nucleotide variant; indel: small insertion or deletion; VAF: variant allele frequency; BAF: B-allele frequency, i.e., the somatic VAF, of germline heterozygous variants; LOH: loss of heterozygosity.
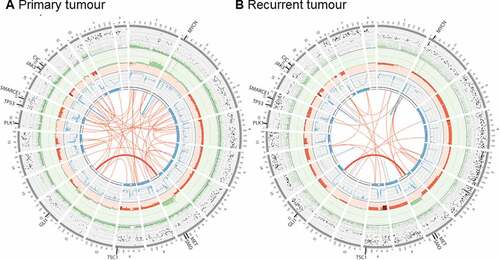
We identified 40,224 somatic mutations, a rate of 13.4 somatic mutations per MB – extremely high for GBM.Citation14 Mutation signature analysisCitation15 revealed a single dominant signature consistent with cytosine deamination due to formalin fixation and no evidence of kataegis or microsatellite instability. Given the dominance of the deamination signature, the apparent high mutation burden observed in this tumor may be due to the formalin fixation process rather than true hypermutation. Across all protein coding genes, there were 16 nonsense and 188 missense variants identified. In a set of known cancer genes, we identified nonsense somatic variants in the genes TSC1, TP53, and SMARCE1, and missense variants in PRF1, ADAMTS20, CIC and RYR1 (Table 1). Notably, comparison of local copy number estimates, purity, and variant frequency indicated that the TSC1, TP53, and SMARCE1 mutations were all clonal in the cancer cells, suggesting they were early events in tumorigenesis. The mutations in TSC1, TP53 and CIC were also subsequently validated using Sanger sequencing (Supplementary Table 2).
Consideration of the histopathological findings and the DNA methylation analysis ultimately led to a clinical diagnosis of GBM. The patient was treated with oral temozolomide and focal irradiation (59 Gy), but experienced progression within 4 weeks of completion of radiation, with a new metastatic nodule in the right parietal region. The recurrent nodule was resected and the patient proceeded to cranio-spinal radiation, however he experienced further rapid tumor progression during therapy, with disease at the primary resection site, and extensive metastatic disease in the right frontal, parietal and temporal regions.
The patient entered palliative care, and died 2 months after the second resection, 7 months from his initial presentation. During the palliative phase, fresh tumor from the second resection was collected and the patient was enrolled as the first brain tumor patient on the TARGET study. The TARGET study is focused on the development of genomic platforms, high throughput drug screening, and PDX models to identify personalized therapies for patients with aggressive pediatric tumors. Fresh tumor tissue was split for molecular analysis and immediate processing for the establishment of neurosphere-forming culture and an orthotopic PDX model. A comprehensive genomic analysis strategy, including paired tumor-normal analysis with > 60x depth WGS, 500x depth targeted sequencing of 386-cancer genes, tumor-only low coverage RNA-Seq for detecting gene rearrangements, and isoform abundance. Furthermore, to identify deregulated gene expression resulting from the disease process we performed high throughput qRT-PCR in the recurrent tumor, snap frozen normal brain tissue and peripheral blood against a panel of manually curated cancer-related genes.
Analysis of the recurrent tumor by WGS revealed 12,283 somatic variants, including 124 rare missense and 8 nonsense or loss of function variants (). The substantially higher sequencing depth from targeted sequencing did not reveal any additional clinically relevant variants. Analysis of copy number data by WGS and targeted sequencing revealed extensive loss of heterozygosity (), driven by either single-copy deletion of chr 3, 4, 6q, 8, 9, 12q, 14, 15p, or copy neutral LOH of chr5 and 6p. Copy number gains were observed in chr6p, 7q, and X, resulting in an XXY karyotype. No evidence of a temozolomide mutation signature was observed, consistent either with the poor clinical response observed in this patient, or insufficient time for treatment-related mutations to accumulate (Supplementary Figure 1).
The primary and recurrent tumors were highly similar at the gross genomic level, with nearly identical copy number and heterozygosity profiles (, Supplementary Table 1). In contrast, at the fine variant level (SNVs, indels), the two tumors were quite dissimilar, with just 3.6% of all somatic SNV and indel variants identified with VAF > 5% shared in both tumors, increasing to 30.1% when considering variants with VAF > 25% (Supplementary Figure 2A-D). We identified just one shared translocation, from a total of 73 candidate fusions in either sample (Supplementary Figure 2E), fusing together chr 7p-13q (highlighted in ), which did not result in an in frame fusion partner. The focal MYCN amplification observed in the primary tumor increased from ~ 17 copies to ~ 41 copies in the recurrent tumor, consistent with either clonal selection of the MYCN amplified clone, or reduced detection sensitivity due to FFPE artifacts in the primary tumor.
Figure 3. Comparison of primary and recurrent tumor genomes. (A) Copy number profiles across the genome in the primary and recurrent tumors. Read depth is shown relative to the blood reference for the primary (upper trace) and recurrent (lower trace) tumors, with segments colored by heterozygosity status. Primary and recurrent tumors display very similar copy number and heterozygosity profiles, with the focal amplifications of MYCN and DNMT3A on chromosome 2 present in both (not shown to scale); (B) SNV and indel variant allele frequencies (VAF) are compared between the primary and recurrent tumors. Contiguous variants with similar VAFs were clustered and are shown as single circles, with the circle size proportional to the number of variants in the cluster. The three deleterious variants identified in cancer-related genes are shown as labeled triangles. The linked TP53 and SMARCE1 variants had high VAFs in both samples, consistent with an early clonal event. The TSC1 variant also was likely an early and clonal event, with copy number and heterozygosity analysis indicating that the increase in TSC1 variant VAF was driven by amplification of the mutant locus rather than selection of a subclone.
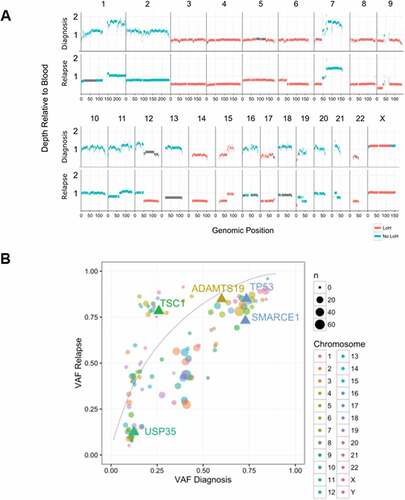
Despite these widespread genomic differences, most of the candidate variants highlighted in the diagnostic sample were retained in the recurrent tumor (). Notably, variants that were observed in the diagnostic specimen, including the targetable TSC1 frameshift, were present at similar or higher allele frequency in the recurrence sample, strongly suggesting that these mutations occurred early in a common progenitor clone, with the TSC1 mutation possibly under selection (). Collectively, these data are consistent with widespread aneuploidy, MYCN amplification and mutations in TP53 and TSC1 as early driver events in the evolution of the tumor.
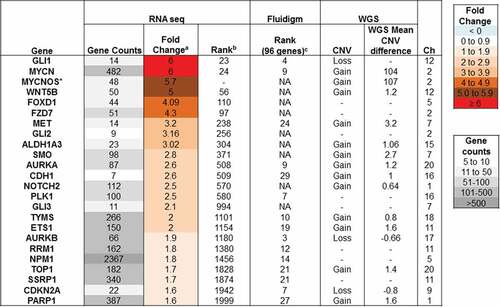
Gene expression analysis was performed using a panel of 96 cancer-related genes on the recurrent biopsy and normal cerebellum control (obtained from a pediatric autopsy specimen) by RNA sequencing and qRT-PCR (Fluidigm, Biomark). The genes were ranked from highest fold change in expression (1) to lowest (96) (). We detected elevated GLI1 expression by qRT-PCR indicating activation of the sonic hedgehog (SHH) signaling pathway. RNA sequencing data revealed upregulated expression of other SHH pathway members, SMO, GLI2 and GLI3, with no corresponding copy number increase by WGS, providing further evidence of the involvement of this signaling pathway in the tumor. Consistent with the MYCN amplification, we observed high gene expression by qRT-PCR and RNA seq (). Furthermore, immunoblotting analysis performed on HGG cell lysates confirmed elevated MYCN protein levels (Supplementary Figure 3). We also detected high gene expression in a number of genes involved in receptor tyrosine kinase (RTK) pathways such as Tyrosine-Protein Kinase Met (c-MET) with moderate copy number amplification, Aurora Kinase A (AURKA) and Polo-Kinase 1 (PLK1), with no underlying increase in copy number.
Figure 4. Gene expression of cancer-specific genes. Gene expression of a panel of cancer-specific genes was assayed by high throughput qRT-PCR and analysed relative to expression in two samples of normal brain. The relative gene expression was then ranked from 1 (highest expression) to 96. Gene expression was also assayed by whole transcriptome RNA sequencing. The average log2 fold change in expression in the sample was determined relative to 8 other pediatric glioma samples. The table lists highly expressed genes that may be contributing to disease progression.
In parallel with the molecular analysis, the neurosphere-forming GBM culture was established within 4 weeks of obtaining the recurrent biopsy and used to examine the cytotoxic efficacy of a targeted library consisting of 128 anti-cancer drugs currently approved or under clinical development for pediatric cancers. shows the IC50 compared to untreated glioma cells presented as a heat-map. We found 12/128 drugs resulted in ≤ 50% viability at concentrations below 0.05 µM. However only 4 of these temsirolimus (mTOR inhibitor), BI2536 (PLK1 inhibitor), enzalutamide (antiandrogen) and omacetaxine (mRNA translation inhibitor) have been previously shown to be able to cross the BBB. Interestingly PLK1 (which is inhibited by BI2536) was found to be 2.5x over-expressed in the biopsy sample by RNA sequencing. In contrast, there were no changes at the molecular level for androgen receptor or protein synthesis pathways. A further 12 drugs were found to be effective between 0.05 and 0.5 µM, with 2 of these (ceritinib 0.4 µM IC50 and cladribine 0.069 µM IC50) being reported to cross the BBB effectively. Ceritinib is known to target the ALK tyrosine kinase receptor, however, we found no overexpression of ALK or other known targets such as IGF-R and INSR (Supplementary Figure 4). Other known ceritinib targets include c-MET, which was found to be overexpressed, however sensitivity to the known c-MET inhibitor crizotinib was not superior (1.53 µM IC50) to that of ceritinib suggesting that it is less likely to be acting through this target (Supplementary Figure 4). Furthermore, although genomic/transcriptomic analysis does not indicate involvement of ALK, it is possible that post-translational modifications may alter the activity of this kinase.Citation16
Figure 5. High throughput screen of targeted agents against HGG neurospheres. (A) Heat map shows sensitivity to each chemotherapeutic drug as a measure of IC50 with all drugs being tested up to 10 µM for 72h. Each value is depicted as a gradient of red to white with white being the highest dose tested and red a low nM-range concentration while varying shades of pink indicate an intermediate IC50 value. Each number corresponds to a different chemotherapeutic agent, identified in the adjacent table. (B) Dose response curves for temozolomide, temsirolimus, BI2536 and ceritinib. Each drug was tested over a range of concentrations 0.001–10 µM for 72h and viability was compared to DMSO treated cells.
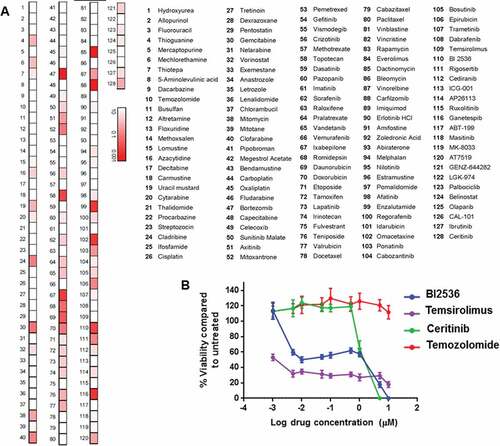
Interestingly, although molecular analysis revealed a mutation on TSC1 (which predicts activation of mTOR pathway), the GBM cells did not show any sensitivity to mTOR inhibitor temsirolimus in the HTS. Subsequent in vitro cytotoxicity experiments, which employed the formation of neurospheres prior to temsirolimus treatment, indicated a lower IC50 but with a flat dose response curve () A very similar dose response was observed for another mTOR inhibitor everolimus (Supplementary Figure 5A). Furthermore, colony formation assays performed on the HGG cells treated with temsirolimus and everlimus indicated sensitivity to both mTOR targeted agents (Supplementary Figure 5B). Despite the findings of gene expression analysis we did not observe any sensitivity to the SHH pathway inhibitor vismodegib. Compared to the three targeted agents temsirolimus, BI2536 and ceritinib, temozolomide did not show significant cytotoxic activity against the primary GBM cells ().
To further evaluate the therapeutic efficacy of the identified targeted therapies, we established an orthotopic PDX model for which tumor engraftment was confirmed by neurological decline, magnetic resonance imaging (MRI) and histological staining of brain tissues from xenografted mice. Immunohistochemical analysis performed on brains of xenografted animals indicated strongly positive staining for phosphorylated S6 Kinase (a downstream mTOR target) and phosphorylated PLK-1 while moderate phosphorylated staining was observed for ALK indicating post-translational modification and confirming further the selection of temsirolimus, BI2536 and ceritinib as the targeted agents for in vivo testing (Supplementary Figure 6). Furthermore, in contrast to gene expression, staining was not observed for phosphorylated MET or total MET however this finding is in agreement with the lack of response to MET inhibitor crizotinib.
For the therapeutic efficacy study mice were injected with 5 × 10Citation4 cultured (passage 2) primary glioma cells using stereotactic equipment (injection coordinates relative to bregma X = + 1.5, Y = + 1, Z = -3 mm). At 10 days post intracranial injection, animals were randomly separated into 5 treatment groups each comprising 9–12 mice, and monitored for neurological decline and weight loss (> 20% of maximum weight) until they either reached experimental endpoint or, if they remained asymptomatic, for up to 158 days. The following 3 candidate drugs were selected for further in vivo testing: BI2536 (25mg/kg/day IP, 2 days/week for 7 weeks), in view of its in vitro activity, its ability to cross the BBB and the presence of PLK-1 over-expression; temsirolimus (20mg/kg/day IP, 5 days/week for 8 weeks), given the presence of a driver TSC1 mutation; and ceritinib (25mg/kg/day gavage, 5 days/week for5 weeks), due to its potent in vitro activity and over-expression of c-MET. Temozolomide (15mg/kg/day, gavage, 3 days/week for 6 weeks) was used as a standard treatment control. The therapeutic doses for each drug were selected based on previous experiments which were performed to determine the maximum tolerated doses.
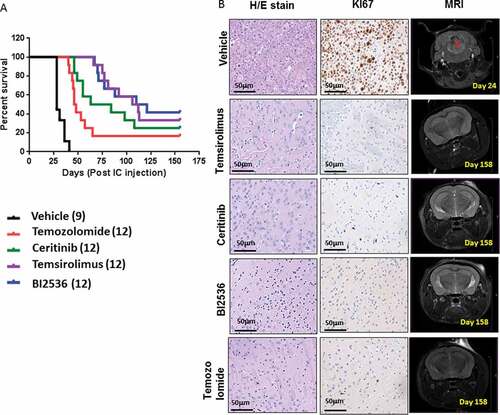
We found that the median survival from the time of intracranial injection in the vehicle group was approximately 28 days, whereas temozolomide treated mice survived 47 days (). In contrast ceritinib treated mice survived even longer (up to 73.5 days). Mice treated with temsirolimus and BI2536 showed the greatest in vivo efficacy with enhanced median survival to 109 and 115.5 days respectively (). The temsirolimus and BI2536 treated groups also contained the highest number of asymptomatic mice (4/12 and 5/12 respectively). At the trial endpoint these mice showed no evidence of tumor growth as assessed either by MRI or histological analysis (). In contrast, in the surviving ceritinib and temozolomide treated animals, residual disease was observed. All treated mice that succumbed to the disease had tumor growth confirmed by MRI prior to sacrifice, and by immunohistochemical (IHC) analysis (Supplementary Figure 7).
Figure 6. In vivo efficacy of selected chemotherapeutic agents against in orthotopic PDX animals. (A) Survival curves following treatment with temozolomide (15mg/kg/day, gavage, 3 days/week, 6 weeks), ceritinib (25mg/kg/day gavage, 5 days/week 5 weeks), temsirolimus (20mg/kg/day, IP, 5 days/week, 8 weeks), BI2536 25mg/kg/day, IP 2 days/week, 7 weeks) or vehicle (gavage, IP, 0.9% saline, 5% Tween80, 5% Peg400) in PDX animals. Treatments commenced 10 days after intracranial injection and endpoints were death, weight loss ≥ 20% or severe neurological decline. (B) Sections of brains from surviving animals, sacrificed at day 158 were examined histologically with H&E and immunostained for the proliferation marker Ki67. MRI depicts the absence of tumor in surviving animals at day 158, compared with controls.
Discussion
The current standard treatment of pediatric GBM is radiotherapy ± temozolomide, and the molecular heterogeneity of this aggressive brain cancer poses a challenge in providing more effective therapeutic options. Previous studies in adult HGGs have attempted to utilize genomic information to guide treatment although without always improving patient outcomes or survival.Citation3 These and other personalized medicine studies tend to rely exclusively on sequencing a panel of cancer-related genes to determine targeted therapies.Citation3 Few studies performed in pediatric cancer patients, have highlighted the need for more extensive molecular characterization based on whole exome sequencing and RNA sequencing of solid tumors and hematologic malignancies. Although a relatively low number of actionable mutations (~ 38–46%) were found across all the studies, the number of matched targeted therapies was even lower (~ 16–25%) due to the lack of safety and efficacy data in patients with childhood malignancies.Citation17-Citation21 Furthermore in pediatric cancers the mutational burden is markedly lower than that seen in adult cancers,Citation5,Citation14,Citation17 meaning that the benefit of precision medicine trials based on mutational analysis alone may also be lower. While much of the mutational burden in adult cancers may relate to passenger mutations, and therefore have minimal impact on treatment options, the drivers that are found in pediatric cancers are more likely to have epigenetic mechanisms (eg nMyc overexpression, histone K27M mutations) with no clear therapeutic options. We hypothesized that a multi-platform and functional profiling approach could lead to identification of actionable targets and active drugs (previously clinically validated in pediatric cancer patients) with greater potential to make a clinical impact.
We report here on the first pediatric brain tumor to be profiled on the TARGET study, using a novel platform of genomic analysis, in vitro drug screening and an orthotopic PDX animal model. In the PDX model the tumor displayed an aggressive phenotype with engraftment validated by MRI three weeks after intracranial injection and subsequent progression, closely mimicking the clinical setting.
Following molecular analysis of the initial and recurrent tumors we discovered a loss of function mutation on TSC1, a key negative regulator of the mTOR pathway. Subsequent histolological analysis of the brains from xenografted animals indicated elevated positive staining of mTOR downstream target P-S6K suggesting activation of this pathway. Treatment with temsirolimus in the PDX model resulted in a significant extension of survival with nearly 33% of the mice being “cured”. TSC1/2 mutations are well recognized in benign tumors and are rare in malignant tumors,Citation22 although they have been reported in renal cell cancer (RCC) and in sporadic adult and pediatric GBM cases.Citation23-Citation27 Although loss of either TSC1 or TSC2 is not regarded as sufficient for gliomagenesis it may accelerate tumor development when combined with other oncogenic signals.Citation9,Citation28,Citation29 Apart from TSC1, this patient’s tumor also displayed a mutation in TP53, which is one of the most frequently altered genes in cancer including pediatric HGGCitation30,Citation31 Although the effects of combined loss of TP53 and TSC1 gene function have not been studied in detail, it has been associated with cancer progression in adult cases of RCCCitation32,Citation33 and mesothelioma.Citation34 Furthermore, mTOR inhibitors such as temsirolimus have been approved for the treatment of RCC and TSC and mTOR mutations are more frequently associated with responders.Citation35 Thus, the presence of a TSC1 mutation in a case of GBM suggests that an mTOR inhibitor may be an active therapy. This is supported by the response seen in vivo in the PDX model, and could provide useful information to the clinician to help prioritize treatment options.
In addition to temsirolimus, the PLK1 inhibitor BI2536 was a highly effective agent in the PDX model. In xenografted animals we observed elevated staining for P-PLK1. PLK1 levels have been reported to be increased by TSC1 lossCitation36 making it plausible that both BI2536 and temsirolimus are targeting the same clonal TSC1 driver event. Supporting the early role of TSC1 and downstream PLK1 in the pathogenesis of this cancer, increased PLK1 activity leads to greater centromere count and whole-chromosome aneuploidy, a karyotypic pattern observed in both tumor samples. Dual inhibition of PLK1 and mTOR has demonstrated enhanced cytotoxicity to TSC1 or TSC2 null cells in vitroCitation37 and dual therapy with temsirolimus and BI2536 is a promising avenue for further study in the orthotopic PDX model.
Gene expression analysis showed high levels of MYCN, PLK1 and SHH pathway mediators. In particular, MYCN amplification was observed in both the initial and recurrent tumor. Here too, the in vitro and in vivo findings helped to understand and prioritise these results. Although SMO copy number gain was observed by molecular analysis in both the initial and recurrent tumor, the in vitro experiments showed no sensitivity to SHH inhibitors suggesting little clinical utility in this approach. While it has been suggested in other precision medicine studies that MYCN amplification is an actionable finding, in practice MYCN inhibitors are not clinically available.Citation38,Citation39 Although ALK was not over-expressed on gene expression analysis, and no ALK fusions nor receptor tyrosine kinase somatic mutations were observed, moderately higher levels of P-ALK was observed in the brains of xenografted animals while the ALK inhibitor ceritinib was active on the high throughput screen. Similarly, the in vivo experiments indicated moderate but significantly improved survival of PDX mice.
Collectively these results show that integration of genomics, transriptomics, in vitro activity and in vivo results, can help prioritize individualized treatments. Lack of efficacy in vitro could be used to lower or enhance drug priority over genomic studies alone, while in vivo results showed a clear differential of drug activity. These exciting findings highlight the utility of performing biopsy of aggressive tumors and using an integrated genomic, in vitro and in vivo platform to help define personalized therapies. A similar case report study recently reported the use of genomic, transcriptomic and PDX methods for the identification of targeted therapies for a pediatric patient with poorly differentiated carcinoma.Citation40 Although these analyses suggested the use of mTOR and MEK inhibitors the patient received a temsirolimus in combination with temozolomode/irinotecan during which treatment progressed rapidly. Subsequent evaluation of this combination therapy in the PDX model indicated antagonistic interaction between temsirolimus/irinotecan suggesting the necessity to implement in depth characterization of clinically relevant combinationsCitation40 using PDX models.
A challenge in the implementation of PDX models is the time taken to develop and treat the animals to obtain results. In the case described here, clear survival results were demonstrated 100 days after intracranial injection. The TARGET study is a pilot feasibility trial, aiming to build the laboratory platform only, and not aiming to feedback results to patients. The patient was enrolled after tumor progression and a time of rapid clinical decline, precluding clinical use of the information even if that had been the intent. However, if patients are enrolled, and a PDX model is established at the time of diagnosis of a high grade glioma, which typically progress within about 12 months, it is feasible to obtain results within a time frame that could be used to alter a patients treatment, even before the tumor recurs. Notably, even though there were many genomic differences between the tumor at diagnosis and relapse, the driver mutations were common to both tumors. Further studies are needed to establish whether the same drugs used to treat PDX models established at diagnosis will also be active in PDX models established at relapse.
Genomic technologies have a much faster turn-around than PDX and in vitro models, and in this case the time from DNA receipt to recommendation of mTOR inhibition was eight days. Although genomics does not provide the definitive measurement of treatment effect granted by in vitro or PDX models, its fast turnaround enables a staggered approach, where an initial genomics-based recommendation is made available rapidly for action in the case of quick disease progression, with refinements or changes in therapy possible when further in vitro and in vivo results become available.
In conclusion this case study describes promising results and indicates that an integrated approach based on genomic analysis, HTS and drug efficacy testing in a PDX model has the potential to guide patient management. The TARGET study has continued to recruit pediatric patients with high-risk brain, solid and liquid tumors to further develop this novel precision medicine platform. The platform is now being expanded to a national Australian trial for all high risk pediatric cancer patients, with samples taken early in the patients’ treatment course, and treatment intervention then offered to patients, in order to assess their impact on patient outcomes.
List of abbreviations
| ALK | = | Anaplastic lymphoma kinase |
| AT/RT | = | Arypical teratoid rabdoid tumor |
| AURKA | = | Aurora kinase A |
| BBB | = | Blood brain barrier |
| BRAF | = | V-Raf murine sarcoma viral oncolgene homolog B |
| CIC | = | Protein capicua homolog |
| c-MET | = | Tyrosine-protein kinase Met |
| CNS | = | Central nervous system |
| DNMT | = | DNA methyltransferase |
| FFPE | = | Formalin-fixed paraffin-embedded |
| GBM | = | Glioblastoma |
| HGG | = | High grade gliomas |
| HTS | = | High throughput screening |
| IP | = | Intraperitoneal |
| mTOR | = | Mammalian target of rapamycin |
| PDX | = | Patient derived xenograft |
| PI3K | = | Phosphatidylinositol-4,6-biphosphate 3-kinase |
| PLK | = | Polo kinase |
| qRT-PCR | = | Quantitative reverse transcriptase PCR |
| Rb | = | Retinoblastoma transcriptional co-repressor 1 |
| RNAseq | = | RNA sequencing |
| RTK | = | Receptor tyrosine kinase |
| RYR | = | Ryanodine receptor |
| SHH | = | Sonic hefgehog |
| SMO | = | Smoothened frizzled receptor |
| TSC1/2 | = | Tuberous sclerosis 1/2 |
| WGS | = | Whole genome sequencing |
Disclosure of potential conflicts of interest
The authors declare that they have no competing interests.
Acknowledgments
We would like to acknowledge the Scientific Services Group at the Children’s Cancer Institute for their technical support with animal work. We wish to acknowledge the facilities, and the scientific and technical assistance of the National Imaging Facility at the UNSW Mark Wainwright Analytical Centre, Biological Imaging Resources Laboratory and would like to thank Dr Andre Bongers and Dr Marco Gruwel (BRIL/UNSW) for their assistance with the protocol set up and conduction of the MRI experiments. In addition we would like to acknowledge the Kinghorn Centre for Clinical Genomics and the Peter MacCallum Cancer Centre for their assistance with the WGS and RNA sequencing respectively. Finally we would like to thank Mr David Thomas for the helpful discussions regarding the patient diagnosis.
Additional information
Funding
Related Research Data
References
- Worst BC, Van Tilburg CM, Balasubramanian GP, Fiesel P, Witt R, Freitag A, Boudalil M, Previti C, Wolf S, Schmidt S, et al. Next-generation personalized medicine for high-risk pediatric cancer patients - The INFORM pilot study. Eur J Cancer. 2016;65:91–101. doi:10.1016/j.ejca.2016.06.009.
- Sahm F, Schrimpf D, Jones DT, Meyer J, Kratz A, Reuss D, Capper D, Koelsche C, Korshunov A, Wiestler B, et al. Next-generation sequencing in routine brain tumor diagnostics enables an integrated diagnosis and identifies actionable targets. Acta Neuropathol. 2016;131:903–910. doi:10.1007/s00401-015-1519-8.
- Blumenthal DT, Dvir A, Lossos A, Tzuk-Shina T, Lior T, Limon D, Yust-Katz S, Lokiec A, Ram Z, Ross JS, et al. Clinical utility and treatment outcome of comprehensive genomic profiling in high grade glioma patients. J Neurooncol. 2016;130:211–219. doi:10.1007/s11060-016-2237-3.
- Letai A. Functional precision cancer medicine-moving beyond pure genomics. Nat Med. 2017;23:1028–1035. doi:10.1038/nm.4389.
- Jones C, Baker SJ. Unique genetic and epigenetic mechanisms driving pediatric diffuse high-grade glioma. Nat Rev Cancer. 2014;14:651–661. doi:10.1038/nrc3811.
- Subashi E, Cordero FJ, Halvorson KG, Qi Y, Nouls JC, Becher OJ, Johnson GA. Tumor location, but not H3.3K27M, significantly influences the blood-brain-barrier permeability in a genetic mouse model of pediatric high-grade glioma. J Neurooncol. 2016;126:243–251. doi:10.1007/s11060-015-1969-9.
- Phoenix TN, Patmore DM, Boop S, Boulos N, Jacus MO, Patel YT, Roussel MF, Finkelstein D, Goumnerova L, Perreault S, et al. Medulloblastoma genotype dictates blood brain barrier phenotype. Cancer Cell. 2016;29:508–522. doi:10.1016/j.ccell.2016.03.002.
- Ostrom QT, Gittleman H, Liao P, Rouse C, Chen Y, Dowling J, Wolinsky Y, Kruchko C, Barnholtz-Sloan J. CBTRUS statistical report: primary brain and central nervous system tumors diagnosed in the United States in 2007-2011. Neuro Oncol. 2014;16(Suppl 4):iv1–63. doi:10.1093/neuonc/nou223.
- Cohen KJ, Pollack IF, Zhou T, Buxton A, Holmes EJ, Burger PC, Brat DJ, Rosenblum MK, Hamilton RL, Lavey RS, et al. Temozolomide in the treatment of high-grade gliomas in children: a report from the Children’s Oncology Group. Neuro Oncol. 2011;13:317–323. doi:10.1093/neuonc/noq191.
- Brennan CW, Verhaak RG, McKenna A, Campos B, Noushmehr H, Salama SR, Zheng S, Chakravarty D, Sanborn JZ, Berman SH, et al. The somatic genomic landscape of glioblastoma. Cell. 2013;155:462–477. doi:10.1016/j.cell.2013.09.034.
- Robinson GW, Orr BA, Gajjar A. Complete clinical regression of a BRAF V600E-mutant pediatric glioblastoma multiforme after BRAF inhibitor therapy. BMC Cancer. 2014;14:258. doi:10.1186/1471-2407-14-258.
- Bautista F, Paci A, Minard-Colin V, Dufour C, Grill J, Lacroix L, Varlet P, Valteau-Couanet D, Geoerger B. Vemurafenib in pediatric patients with BRAFV600E mutated high-grade gliomas. Pediatr Blood Cancer. 2014;61:1101–1103. doi:10.1002/pbc.24891.
- Johann PD, Erkek S, Zapatka M, Kerl K, Buchhalter I, Hovestadt V, Jones DTW, Sturm D, Hermann C, Segura Wang M, et al. Atypical |CAPES. Cancer Cell. 2016;29:379–393. doi:10.1016/j.ccell.2016.02.001.
- Alexandrov LB, Nik-Zainal S, Wedge DC, Aparicio SA, Behjati S, Biankin A, Bignell GR, Bolli N, Borg A, Børresen-Dale A-L, et al. Signatures of mutational processes in human cancer. Nature. 2013;500:415–421. doi:10.1038/nature12477.
- Nik-Zainal S, Alexandrov LB, Wedge DC, Van Loo P, Greenman CD, Raine K, Jones D, Hinton J, Marshall J, Stebbings LA, et al. Mutational processes molding the genomes of 21 breast cancers. Cell. 2012;149:979–993. doi:10.1016/j.cell.2012.04.024.
- Ishibashi Y, Miyoshi H, Hiraoka K, Arakawa F, Haraguchi T, Nakashima S, Hashiguchi T, Shoda T, Hamada T, Okawa T, et al. Anaplastic lymphoma kinase protein expression, genetic abnormalities, and phosphorylation in soft tissue tumors: phosphorylation is associated with recurrent metastasis. Oncol Rep. 2015;33:1667–1674. doi:10.3892/or.2015.3806.
- Oberg JA, Glade Bender JL, Sulis ML, Pendrick D, Sireci AN, Hsiao SJ, Turk AT, Dela Cruz FS, Hibshoosh H, Remotti H, et al. Implementation of next generation sequencing into pediatric hematology-oncology practice: moving beyond actionable alterations. Genome Med. 2016;8:133. doi:10.1186/s13073-016-0389-6.
- Mody RJ, Wu Y, Lonigro RJ, Cao X, Roychowdhury S, Pea V, Frank KM, Prensner JR, Asangani I, Palanisamy N, et al. Integrative clinical sequencing in the management of refractory or relapsed cancer in youth. JAMA. 2015;314:913–925. doi:10.1001/jama.2015.10080.
- Parsons D, Roy A, Yang Y, Wang T, Scollon S, Kea B, Kerstein RA, Gutierrez S, Petersen AK, Bavle A, et al. Diagnostic yield of clinical tumor and germline whole-exome sequencing for children with solid tumors. JAMA Oncol. 2016;2:616–624. doi:10.1001/jamaoncol.2015.5699.
- Harris M, DuBois S, Glade Bender JL, Kim A, Crompton BD, Eea P, Dumont IP, Hong AL, Guo D, Church A, et al. Multicenter feasibility study of tumor molecular profiling to inform therapeutic decisions in advanced pediatric solid tumors: the individualized cancer therapy (icat) study. JAMA Oncol. 2016;2:608–615. doi:10.1001/jamaoncol.2015.5689.
- Chang W, Brohl AS, Patidar R, Sindiri S, Shern JF, Wei J, Song YK, Yohe ME, Gryder B, Zhang S, et al. Multidimensional ClinOmics for precision therapy of children and adolescent young adults with relapsed and refractory cancer: a report from the center for cancer research. Clin Cancer Res. 2016;22:3810–3820. doi:10.1158/1078-0432.CCR-15-2717.
- Lukas RV, Boire A, Nicholas MK. Targeted therapy in the treatment of malignant gliomas. Oncotargets Ther. 2009;2:115–133.
- Vignoli A, Lesma E, Alfano RM, Peron A, Scornavacca GF, Massimino M, Schiavello E, Ancona S, Cerati M, Bulfamante G, et al. Glioblastoma multiforme in a child with tuberous sclerosis complex. Am J Med Genet A. 2015;167A:2388–2393. doi:10.1002/ajmg.a.37158.
- Brown JM. Tuberose sclerosis with malignant astrocytoma. Med J Aust. 1975;1:811–814.
- Padmalatha C, Harruff RC, Ganick D, Hafez GB. Glioblastoma multiforme with tuberous sclerosis. Report of a case. Arch Pathol Lab Med. 1980;104:649–650.
- Matsumura H, Takimoto H, Shimada N, Hirata M, Ohnishi T, Hayakawa T. Glioblastoma following radiotherapy in a patient with tuberous sclerosis. Neurol Med Chir (Tokyo). 1998;38:287–291.
- Reyes D, Prayson R. Glioblastoma in the setting of tuberous sclerosis. J Clin Neurosci. 2015;22:907–908. doi:10.1016/j.jocn.2014.12.001.
- Parry L, Maynard JH, Patel A, Hodges AK, Von Deimling A, Sampson JR, Cheadle JP. Molecular analysis of the TSC1 and TSC2 tumor suppressor genes in sporadic glial and glioneuronal tumors. Hum Genet. 2000;107:350–356.
- Yamada D, Hoshii T, Tanaka S, Hegazy AM, Kobayashi M, Tadokoro Y, Ohta K, Ueno M, Ali MAE, Hirao A. Loss of Tsc1 accelerates malignant gliomagenesis when combined with oncogenic signals. J Biochem. 2014;155:227–233. doi:10.1093/jb/mvt112.
- Schwartzentruber J, Korshunov A, Liu XY, Jones DT, Pfaff E, Jacob K, Sturm D, Fontebasso AM, Quang D-AK, Tönjes M, et al. Driver mutations in histone H3.3 and chromatin remodelling genes in pediatric glioblastoma. Nature. 2012;482:226–231. doi:10.1038/nature10833.
- Adamski J, Tabori U, Bouffet E. Advances in the management of pediatric high-grade glioma. Curr Oncol Rep. 2014;16:414. doi:10.1007/s11912-014-0414-0.
- Kim SH, Kowalski ML, Carson RP, Bridges LR, Ess KC. Heterozygous inactivation of tsc2 enhances tumorigenesis in p53 mutant zebrafish. Dis Model Mech. 2013;6:925–933. doi:10.1242/dmm.011494.
- Habib SL, Yadav A, Mahimainathan L, Valente AJ. Regulation of PI 3-K, PTEN, p53, and mTOR in malignant and benign tumors deficient in tuberin. Genes Cancer. 2011;2:1051–1060. doi:10.1177/1947601912445376.
- Guo Y, Chirieac LR, Bueno R, Pass H, Wu W, Malinowska IA, Kwiatkowski DJ. Tsc1-Tp53 loss induces mesothelioma in mice, and evidence for this mechanism in human mesothelioma. Oncogene. 2014;33:3151–3160. doi:10.1038/onc.2013.280.
- Al-Saleem T, Wessner LL, Scheithauer BW, Patterson K, Roach ES, Dreyer SJ, Fujikawa K, Bjornsson J, Bernstein J, Henske EP. Malignant tumors of the kidney, brain, and soft tissues in children and young adults with the tuberous sclerosis complex. Cancer. 1998;83:2208–2216.
- Astrinidis A, Senapedis W, Henske EP. Hamartin, the tuberous sclerosis complex 1 gene product, interacts with polo-like kinase 1 in a phosphorylation-dependent manner. Hum Mol Genet. 2006;15:287–297. doi:10.1093/hmg/ddi444.
- Valianou M, Cox AM, Pichette B, Hartley S, Paladhi UR, Astrinidis A. Pharmacological inhibition of Polo-like kinase 1 (PLK1) by BI-2536 decreases the viability and survival of hamartin and tuberin deficient cells via induction of apoptosis and attenuation of autophagy. Cell Cycle. 2015;14:399–407. doi:10.4161/15384101.2014.986394.
- McKeown MR, Bradner JE. Therapeutic strategies to inhibit MYC. Cold Spring Harb Perspect Med. 2014;4:a014266–a014266. doi:10.1101/cshperspect.a014266.
- Posternak V, Cole MD. Strategically targeting MYC in cancer. F1000Res. 2016;5:408. doi:10.12688/f1000research.
- Dela Cruz FS, Diolaiti D, Turk AT, Rainey AR, Ambesi-Impiombato A, Andrews SJ, Mansukhani MM, Nagy PL, Alvarez MJ, Califano A, et al. A case study of an integrative genomic and experimental therapeutic approach for rare tumors: identification of vulnerabilities in a pediatric poorly differentiated carcinoma. Genome Med. 2016;8:116. doi:10.1186/s13073-016-0366-0.